Evaluation of Greenhouse Gas Emissions from Dairy Manure

Proceedings Home | W2W Home w2w17 logo

Purpose

Greenhouse gas (GHG) emissions from dairy manure can be affected by barns, bedding and manure collection, as well as processing and storage. To reduce life cycle environmental impacts of milk production, it is important to understand the mechanisms involved in production and emission of GHGs from dairy manure. In addition to the GHGs emitted from the manure surface, the production of these gases in manure at different depths is an important but poorly understood driver of emissions. Because it is often not practical to measure GHG production and emissions directly in the field, simulation of these processes, both experimentally and through modeling, is needed to help understand the GHG emission mechanisms.Because manure samples are heterogeneous and their composition varies based on the bedding materials and bedding rate as well as cleaning frequency, it is also necessary to consider the impacts of these different types of manure heterogeneity and their impact on emission processes. Another important element that can impact GHGs emissions from dairy manure is oxygen. GHG emission rates can be different based on manure storage status (aerobic, anaerobic, and mixed conditions) and storage time. Several other factors, such as manure bedding materials, bedding rate, applied stress, temperature and moisture content can also impact the microbial activities that produces these GHGs. Our goals are to enhance understanding of the relationships between these factors and GHG emissions from dairy manure, and to identify strategies by which substantial reductions in GHG can be realized in a practical way.

What did we do?

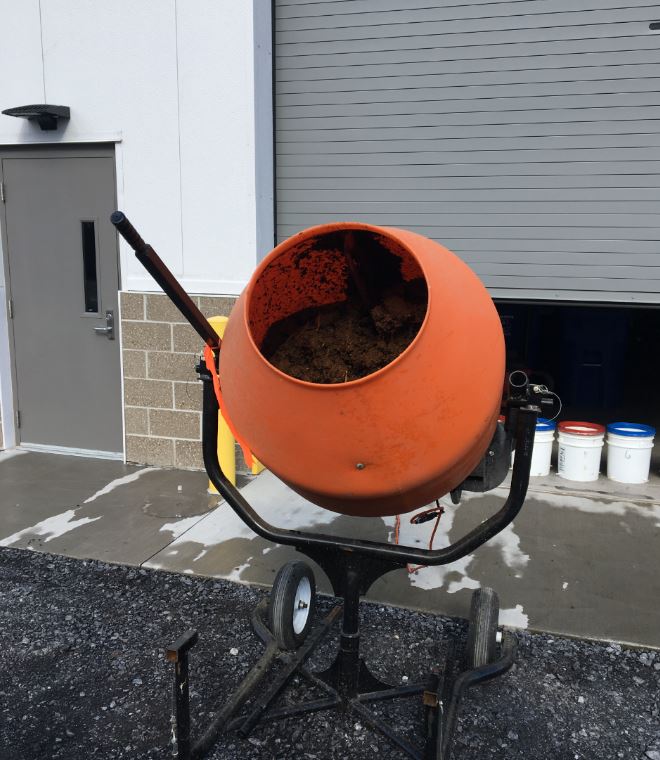
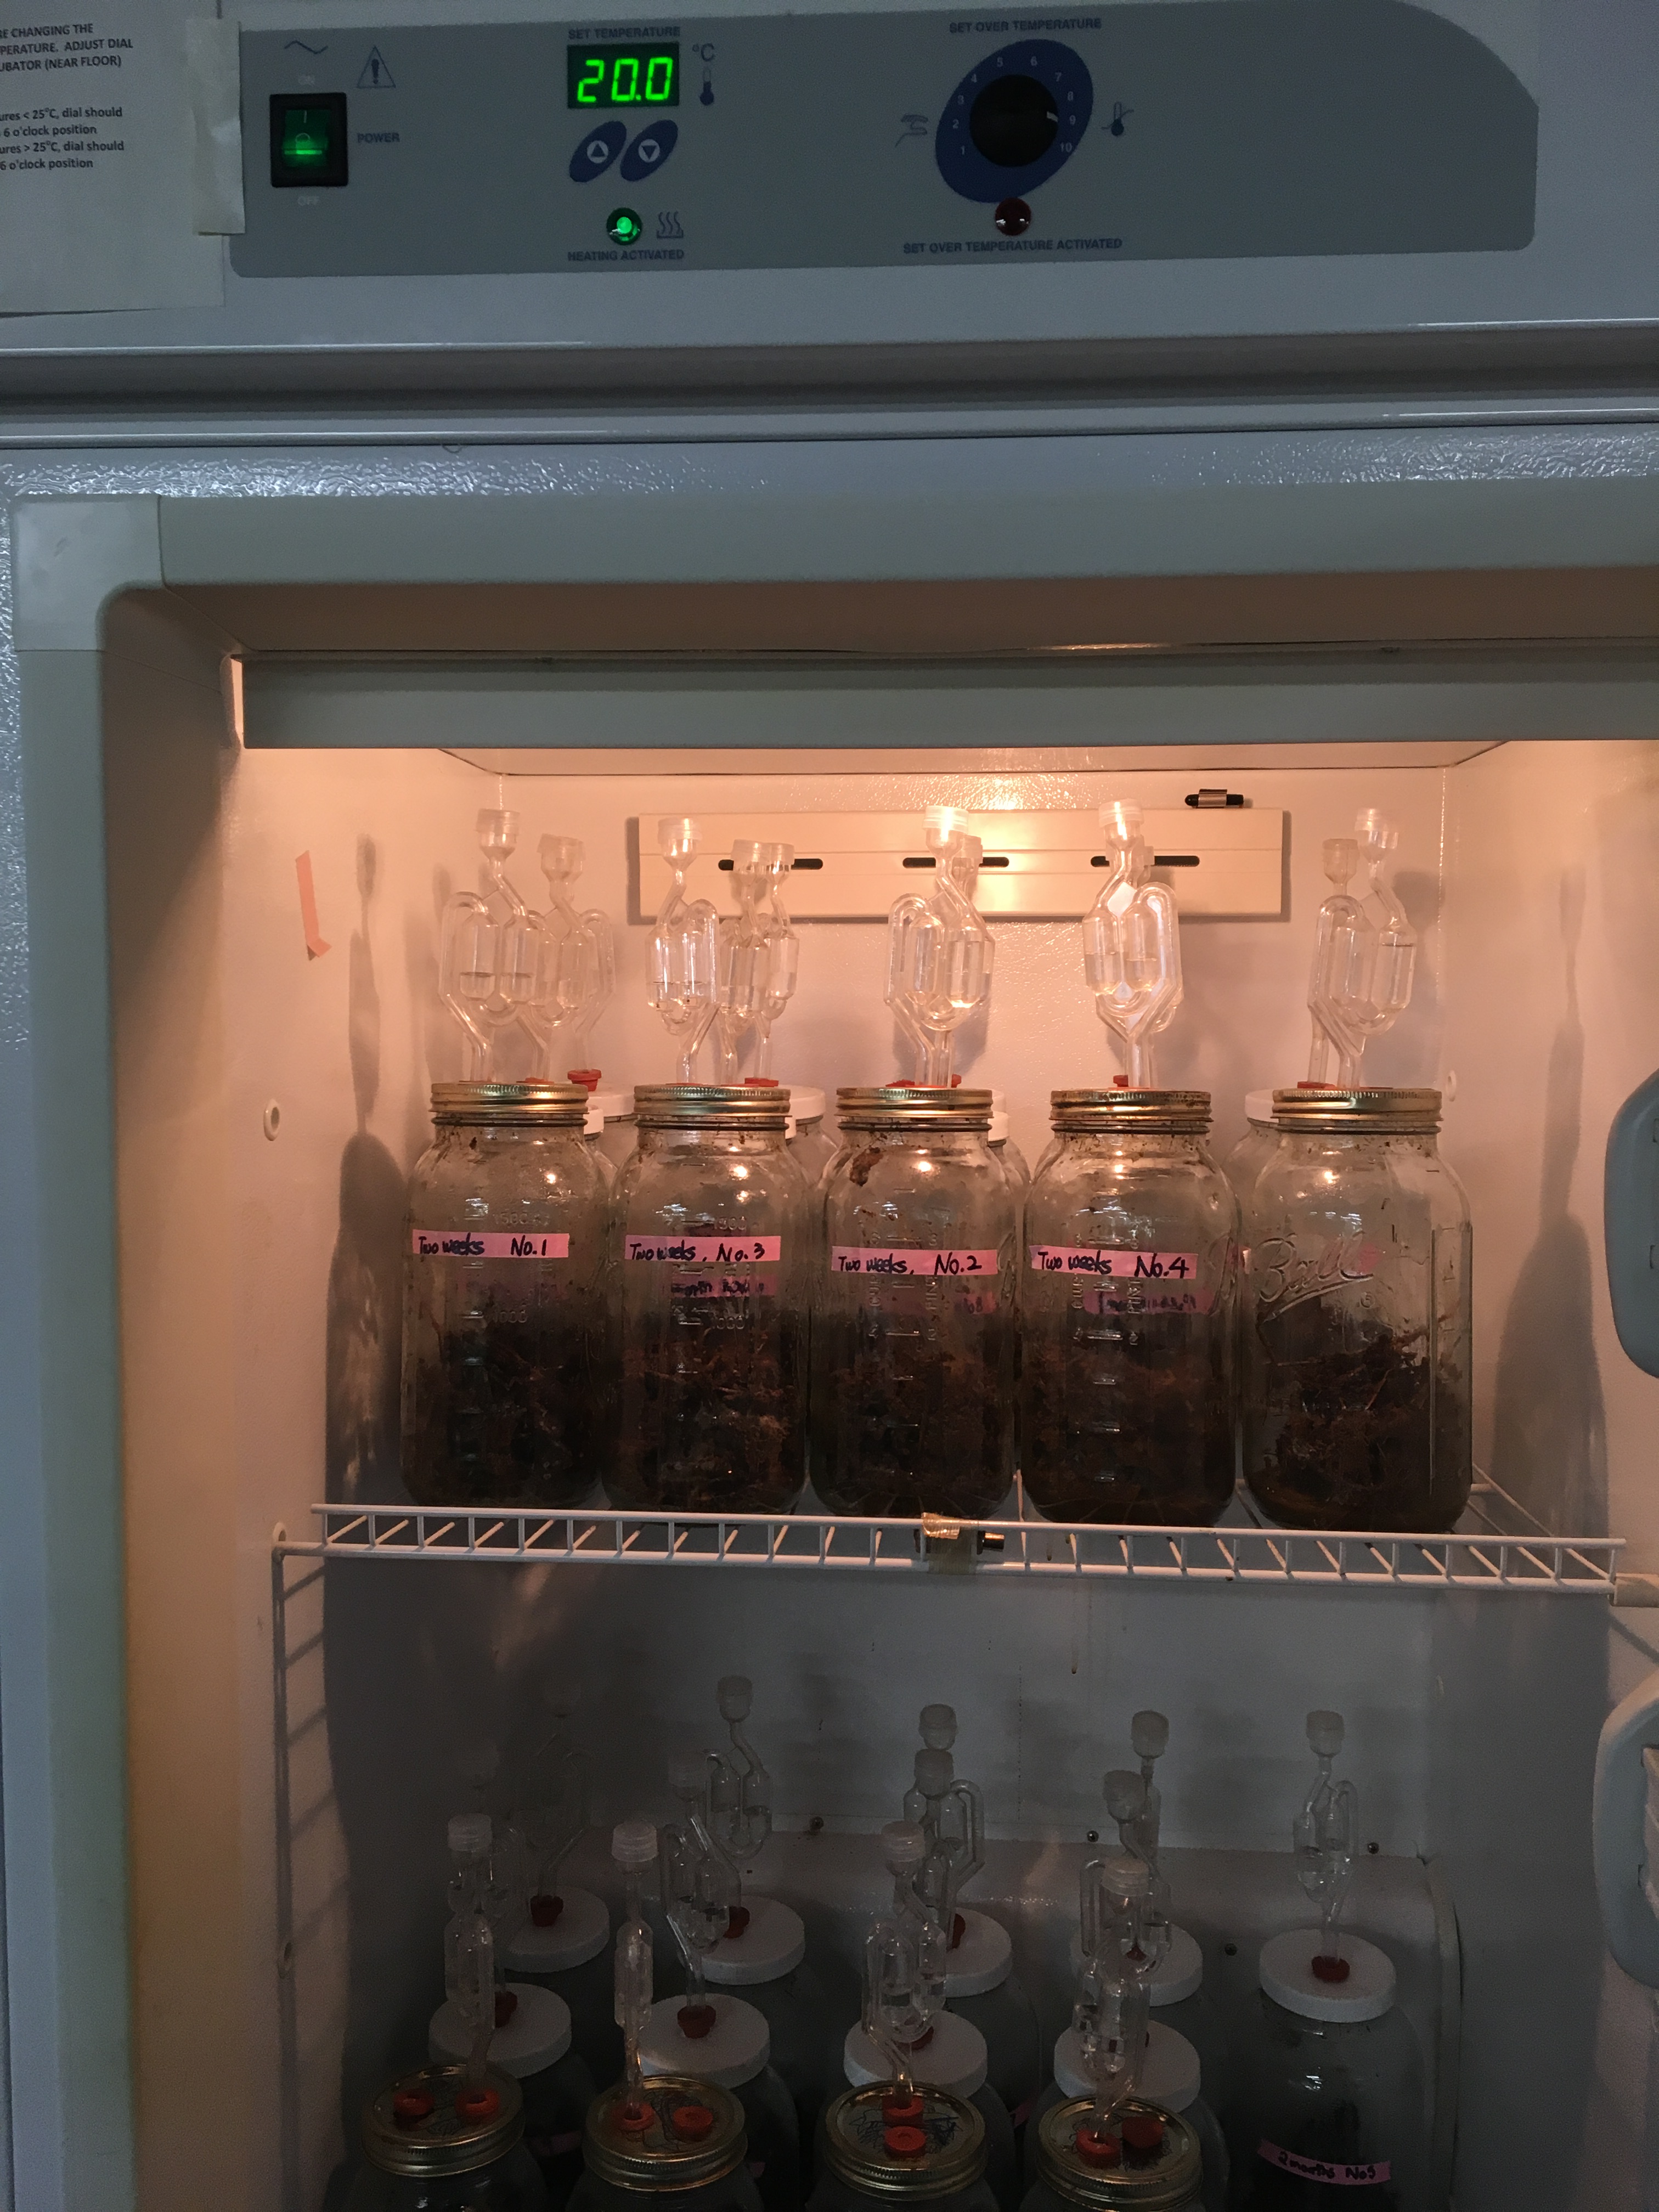
In a controlled laboratory environment we investigated three different dairy manures: sand stacked manure, sawdust bedded manure, and organic sawdust bedded manure. The first two manures were studied and measured in 2016, and the last one was collected and measured in February 2017. After sample collection, manures were mixed in a cement blender to be more homogeneous, and were then transported to buckets and jars for compaction and storage. Nine buckets were filled with manure in layers, and each layer was characterized for physical and biochemical properties. Three levels of stress (0 N/m2, 4196 N/m2, and 12589 N/m2) were applied above the manure to emulate the impact of overburden at various pile depths. Manure bulk density and permeability for each bucket were measured, and the average of each treatment was summarized to evaluate relationships with GHG emissions. Four gases (NH3, CH4, CO2, and N2O) were investigated. The manure moisture content and water holding capacity were measured adjusted to create aerobic, anaerobic, and mixed conditions for manure microorganisms. Three moisture contents were applied to 300 g manure samples, each three replicates. Each manure storage condition was simulated in 2L glass vessels for five durations (one day, two weeks, one month, two month, and three months). The relationship between storage time and GHG rates was assessed.

Picture of cement blenderPicture of buckets and manure compactionPicture of dairy manure storage after blending and compaction

What have we learned?

The results showed that there are good prospects that GHGs reductions can be realized in dairy manure management. In this work, manure that was characterized between each sample layer in the buckets showed similar results, which means the samples are pretty homogeneous. Bulk density and permeability decreased with increasing applied stress. GHG emissions and ammonia emissions showed correlation with the compaction density. Using different bedding materials did impact the GHGs rate.

Future Plans

The combination of prediction models (DNDC and IFSM) and real-word data will be discussed next.

Corresponding author, title, and affiliation

Fangle Chang, post-doctoral at Penn State University, State College PA

Corresponding author email

fuc120@psu.edu

Other authors

Micheal Hile, Eileen E. Fabian (Wheeler),

Additional information

Micheal Hile, mlh144@psu.edu

Eileen E. Fabian (Wheeler), Professor of Agricultural Engineering, Environmental Biophysics, Animal Welfare, and Agricultural Emissions, Integrated Research and Extension Programs, Penn State University, State College PA, fabian@psu.edu

Tom L. Richard, Professor of Agricultural and Biological Engineering, Director of Penn State Institutes for Energy and the Environment, Bioenergy and Bioresource Engineering, Penn State University, State College PA, tlr20@psu.edu

Acknowledgements

This material is based upon work that is supported by the National Institute of Food and Agriculture, U.S. Department of Agriculture, under award number 2013-68002-20525. Any opinions, findings, conclusions or recommendations expressed in this publication are those of the author(s) and do not necessarily reflect the view of the U.S. Department of Agriculture.

The authors are solely responsible for the content of these proceedings. The technical information does not necessarily reflect the official position of the sponsoring agencies or institutions represented by planning committee members, and inclusion and distribution herein does not constitute an endorsement of views expressed by the same. Printed materials included herein are not refereed publications. Citations should appear as follows. EXAMPLE: Authors. 2017. Title of presentation. Waste to Worth: Spreading Science and Solutions. Cary, NC. April 18-21, 2017. URL of this page. Accessed on: today’s date.

Climate Change Mitigation and Adaptation in Dairy Production Systems of the Great Lakes

Proceedings Home | W2W Home  waste to worth 2017 logo

Purpose

To better understand how dairy agriculture can reduce its impact on climate change, the USDA has supported a large, transdisciplinary research project to examine dairy production systems across the Great Lakes region of the United States. The goals of the Sustainable Dairy Coordinated Agricultural Project are to identify where in the life cycle of a dairy system can beneficial management practices (BMP) be applied to reduce greenhouse gases (GHG) without sacrificing productivity or profit to the farmer. Since 2013, a team of 70 researchers has been collaborating across institutions and disciplines to conduct the investigations.

What did we do?

Experimental data were collected at the cow, barn, manure, crop and soil levels from 2013-2016 by agricultural and life scientists. Modelers continue to conduct comparative analyses of process models at the animal, field and farm scales. Atmospheric scientists have down-scaled global climate models to the Great Lakes region and are integrating climate projections with process modeling results. The Life Cycle Assessment team is evaluating select beneficial management practices to identify where the greatest reduction of greenhouse gases (GHG) may occur. Results of focus groups and farmer surveys in Wisconsin and New York will help us understand how producers currently farm and what types of changes they may be willing to implement, not just to reduce emissions but to adapt to long-term changes in climate.

What have we learned?

Through the Dairy CAP grant, researchers have developed and refined the best ways to measure GHG emissions at the cow, barn, manure, crop and soil levels, and these data are archived through the USDA National Sustainable Dairy LogoAgricultural Library. Results show that the greatest levels of methane produced on a farm come from enteric emissions of the cow and changes in the diet, digestion and genetics of the cow can reduce those emissions. Another significant source of methane—manure production, storage and management—can be substantially reduced through manure management practices, particularly when it is processed through an anaerobic digester. Changes in timing of nitrogen application and use of cover crops practices are found to improve nitrogen efficiency and reduce losses from the field.

A comparative analysis of process models showed multiple differences in their ability to predict GHG emissions and nutrient flow (particularly nitrogen dynamics) at the animal, farm, and field scales. Field data collected were used to calibrate and refine several models. The Life Cycle Assessment approach shows that a combination of BMPs can reduce GHG emissions without sacrificing milk production. The application of down-scaled climate data for the Great Lakes region is being used in conjunction with the suite of BMPs to develop mitigation and adaptation scenarios for dairy farming in the Upper Midwest.

Research findings are shared through a series of fact sheets available on the project website, and a web-based, virtual farm that presents educational materials for 150- and 1500-cow operations to a variety of audiences, ranging from high school students to academics.

Future Plans

The Dairy CAP grant sunsets in 2018, but research questions remain relative to the efficacy of beneficial management practices at different stages in the life cycle of a farm. Challenges revolve around the complexity of farming practices, the individuality of each farm and how it is managed, and uncertainty associated with the predictive capabilities of models. Mitigation and adaptation strategies will be shared with the dairy industry, educators and extension partners who will be responsible for working with farmers at the field level. Implementation of these strategies will make dairy farming in the Great Lakes region more resilient.

Corresponding author, title, and affiliation

Carolyn Betz, Research Project Manager, University of Wisconsin-Madison. Department of Soil Science

Corresponding author email

cbetz@wisc.edu

Other authors

Matt Ruark and Molly Jahn

Additional information

http://www.sustainabledairy.org

http://virtualfarm.psu.edu

Acknowledgements

This material is based upon work that is supported by the National Institute of Food and Agriculture, U.S. Department of Agriculture, under award number 2013-68002-20525.

A Model Comparison of Daily N2O Flux with DayCent, DNDC, and EPIC


Proceedings Home W2W Home w2w17 logo

Purpose 

Process-based models are increasingly used as tools for studying complex agroecosystem interactions and N2O emissions from agricultural fields. The widespread use of these models to conduct research and inform policy benefits from periodic model comparisons that assess the state of agroecosystem modeling and indicate areas for model improvement. The increasingly broad application of models requires an assessment of model performance using datasets that span multiple biogeophysical contexts. While limited in the capacity to identify specific areas for model improvement, general evaluations provide a critical perspective on the use of model estimates to inform policy and also identify necessary model improvements that require further evaluation.

What did we do? 

The objectives of this model comparison were to i) calibrate and validate three process-based models using a large dataset; ii) evaluate the performance of a multi-model ensemble to estimate observed data; and iii) construct a linear model to identify and quantify possible model bias in the estimation of soil N2O flux from agricultural fields. We selected three models that have been used to evaluate N2O emissions from agricultural fields: DayCent, DNDC, and EPIC. Using data from two field experiments over five years, we calibrated and validated each model using observations of soil temperature (n = 887), volumetric soil water content (VSWC) (n = 880), crop yield (n = 67), and soil N2O flux (n = 896). Our model validations and comparisons consisted of commonly conducted statistical evaluations of root mean squared error, correlation, and model efficiency. Additionally, the large sample sizes used here allowed for more robust linear regression models that offered additional insight into relationships between model estimations and observations of N2O flux. We hypothesized that such a linear model would indicate if there was model bias in estimations of soil N2O flux. Ensemble modeling can reduce the error associated with climate projections and has recently been applied to the estimation of N2O flux from agroecosystems. Thus, we also constructed a multi-model ensemble to evaluate the use of multiple models to improve estimates of soil N2O flux.

What have we learned? 

In a comparison of three process-based models, calibration to a large dataset produced favorable estimations of soil temperature, VSWC, average yield, and N2O flux when the models were evaluated using RMSE, R2, and the Nash-Sutcliffe E-statistic. However, an evaluation of linear regression models revealed a consistent bias towards underestimating high-magnitude daily N2O flux and cumulative N2O flux. Observations of soil temperature and VSWC were unable to significantly explain model bias. Calibration to available data did not result in consistent model estimation of additional system properties that contribute to N2O flux, which suggests a need for additional model comparisons that make use of a wide variety of data types. The major contribution of this work has been to identify a potential model bias and future steps required to evaluate its source and improve the simulation of nitrogen cycling in agroecosystems. Process-based models are powerful tools, and it is not our objective to undermine their past and future application. However, more work is left to be done in understanding the biogeophysical system that produces soil N2O and in harmonizing the process-based models that simulate that system and which are used to evaluate management and generate policy.

Future Plans 

Future work should test our findings in additional agroecological contexts to determine the extent to which a bias towards underestimating peak N2O flux persists. A meta-analysis of published data may be the most direct method for doing so. New datasets will need to be collected that represent simultaneous observations of multiple system properties (e.g. soil NO3-, soil NH4+, and heterotrophic respiration) from different soil layers and at increased temporal frequencies. Model developers should use these rich datasets to identify the source of N2O estimation bias and improve the structure and function of process-based models.

Corresponding author, title, and affiliation      

Richard K. Gaillard, Graduate Student, University of Wisconsin-Madison

Corresponding author email    

rgaillard@wisc.edu

Other authors  

Curtis D. Jones, Assistant Research Professor, University of Maryland; Pete Ingraham, Research Scientist, Applied Geosolutions;

Additional information               

sustainabledairy.org

Acknowledgements     

This material is based upon work that is supported by the National Institute of Food and Agriculture, U.S. Department of Agriculture, under award number 2013-68002-20525. Any opinions, findings, conclusions or recommendations expressed in this publication are those of the author(s) and do not necessarily reflect the view of the U.S. Department of Agriculture.

Additional Authors:

Sarah Collier, Research Associate, University of Wisconsin-Madison;

Roberto Cesar Izaurralde, Research Professor, University of Maryland;

William Jokela, Research Scientist (retired), USDA-ARS;

William Osterholz, Research Associate, University of Wisconsin-Madison;

William Salas, President and Chief Scientist, Applied Geosolutions;

Peter Vadas, Research Scientist, USDA-ARS;

Matthew Ruark; Associate Professor; University of Wisconsin-Madison

The authors are solely responsible for the content of these proceedings. The technical information does not necessarily reflect the official position of the sponsoring agencies or institutions represented by planning committee members, and inclusion and distribution herein does not constitute an endorsement of views expressed by the same. Printed materials included herein are not refereed publications. Citations should appear as follows. EXAMPLE: Authors. 2017. Title of presentation. Waste to Worth: Spreading Science and Solutions. Cary, NC. April 18-21, 2017. URL of this page. Accessed on: today’s date.

Estimating GHG Emissions from Manure Management Practices in Dairy Systems

Proceedings HomeW2W Home  waste to worth 2017 logo

Purpose

This study had the objective of quantifying greenhouse gas (GHG) emissions from different manure management practices and dairy farm sizes. A comparison of the main practices among farm sizes was also conducted to highlight practices that are able to minimize GHG emissions.

What did we do?

First, a survey was sent to Wisconsin dairy farms to collect information on manure management, machinery power, and time of operation. Manure management practices includeTable 1. Summary of the effects of various livestock antibiotics on decomposition under aerobic, anaerobic, and denitrifying conditions
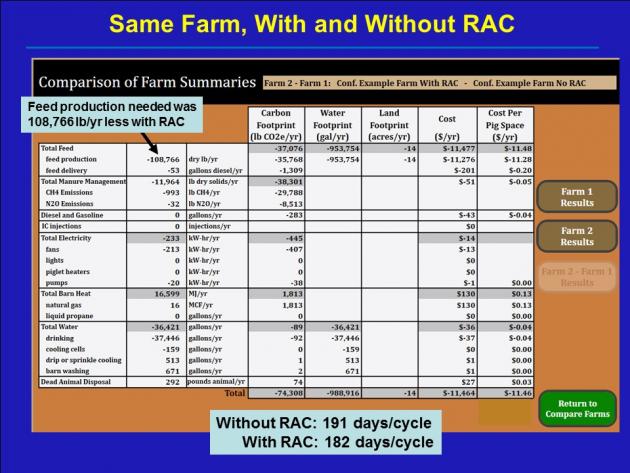
d collection, transportation, storage, land application, and processing (anaerobic digestion (AD), solid-liquid separation (SLS), and sand separation (SS)). Second, modelling tools were used to estimate GHG emissions based on farm size and practice. Four farm sizes have been evaluated: small (1-99 animal units, 1 AU = 1,000 pounds of animal), medium (100-199 AU), large (200-999 AU) and permitted facilities (≥ 1,000 AU).

Three representative farms were modeled for GHG emissions based on survey results: a small farm (75 AU) handling 1.8 ton solid manure/day, a large farm (425 AU) handling 21.7 ton liquid manure/day, and a permitted facility (2,000 AU) handling 140 ton liquid manure/day and with manure processing. In addition, a base case scenario with the most representative practices for each farm size, and a low and a high GHG emitting scenario were modeled to analyze potential mitigation strategies (Table 1).

What have we learned?

Nitrous oxide (N2O) after manure land-application is the major contributor to GHG emissions in small farms (Figure 1). Most small farms land-apply manure daily or have short termFigure storage. Emissions can be reduced by using a barn cleaner instead of a skid steer as it is more efficient in terms of energy consumption. The high emitting scenario in small farms indicates that adding long term storage would increase GHG emissions mostly in the form of methane (CH4) from storage.

Storage is the major contributor to GHG emissions for large farms, where most emissions occur in the form of CH4. Storage CH4 emissions can be reduced by minimizing the storage retention time or by using a cover. Despite that manure storage has implications on air quality, its role is crucial for water quality purposes and therefore, removing the storage structure from the dairy farm is not a feasible option.

Manure processing is an interesting GHG mitigation strategy as shown in the permitted facility scenarios (Figure 1). AD and SLS achieve significant GHG emission reductions, where negative emissions indicate that AD displaces more GHG emissions from the production of grid electricity than the emissions coming from all manure handling processes. Injecting manure instead of surface applying it has proven to reduce ammonia emissions, but it resulted in an increase in N2O emissions in our model.

Future Plans

There is opportunity for future work analyzing data collected in the survey. These data include nutrient use, crop yields, bedding use and replacement, and milk yield and characteristics, which can be analyzed in the context of farm size and management practices.

Corresponding author, title, and affiliation

Aguirre-Villegas, Horacio Andres. Assistant Scientist. Department of Biological Systems Engineering, University of Wisconsin-Madison.

Corresponding author email

aguirreville@wisc.edu

Other authors

Rebecca Larson. Assistant Professor. Department of Biological Systems Engineering, University of Wisconsin-Madison

Additional information

References

Aguirre-Villegas, Horacio A., and Rebecca A. Larson. 2017. “Evaluating Greenhouse Gas Emissions from Dairy Manure Management Practices Using Survey Data and Lifecycle Tools.” Journal of Cleaner Production 143: 169–79. doi:10.1016/j.jclepro.2016.12.133.

Acknowledgements


This material is based upon work that is supported by the National Institute of Food and Agriculture, U.S. Department of Agriculture, under award number 2013-68002-20525. Any opinions, findings, conclusions or recommendations expressed in this publication are those of the author(s) and do not necessarily reflect the view of the U.S. Department of Agriculture.


The authors are solely responsible for the content of these proceedings. The technical information does not necessarily reflect the official position of the sponsoring agencies or institutions represented by planning committee members, and inclusion and distribution herein does not constitute an endorsement of views expressed by the same. Printed materials included herein are not refereed publications. Citations should appear as follows. EXAMPLE: Authors. 2017. Title of presentation. Waste to Worth: Spreading Science and Solutions. Cary, NC. April 18-21, 2017. URL of this page. Accessed on: today’s date.

Are Models Useful for Evaluating or Improving the Environmental Impact of Pork Production?

green stylized pig logo

Models are basically equations that are based on real-world measurements. Measurements are made in different situations and/or different times. Models are used to make comparisons between different choices or look at “what if” scenarios without having to implement each possible option.

Generally, models that are created with large, diverse (but still compatible) data sets containing relevant information are going to be more reliable than models with smaller data sets with smaller data sets. Models can then be used to predict performance or evaluate changes in a system.

There are very good reasons to use models when looking at the environmental footprint of pork production:

  1. Efficiency. It is expensive and impractical to measure actual emissions from every farm or barn.
  2. Decision-making. Models allow farmers and their advisers to look at “what if?”. Prior to making an expensive decision, farmers can evaluate the location, type of building, manure storage, manure treatment, feed ration, etc. and select the best option.
  3. Measure progress trends. Models can be applied at different points in time to see if a farm or industry is making progress in reducing their impacts.

Are there limitations to models?

Yes. By their very nature, models are a simplified representation of a complex system. Modeling is a balance between complexity (how much information does the user need and how much time will it take?) and accuracy (how much is gained by including additional variables?).  The results must be evaluated in their appropriate context. As an example, many TV weather forecasters look at several sources of information, including models when formulating their forecast. While on a given day the forecast may be off (either due to inaccurate analysis or results) it is safe to say that overall, weather forecasting is greatly enhanced by the use of models.

Do you have an example of a model used on pig farms?

One example of a model that is currently looking at the environmental footprint of pork production is the Pork Production Environmental Footprint Calculator.  It currently estimates greenhouse gas (GHG) emissions and the day to day costs of the activities that generate those emissions, but research is underway to expand the model to include land,  and water footprints–leading to a more comprehensive “environmental footprint” model.

The model referenced above can be used for estimating the GHG emissions from the various operations on a pig farm in order to calculate the farm’s cumulative emissions. It shows where the major contributions arise, and provides a test bed for identifying strategies that reduce emissions at least cost. The model requires input information that most producers will know about their operation such as the type of barn, animal throughput, type and quantity of feed ration used, a physical description of the facilities (size of barn, insulation, fans etc.), the time in the barn, temperature profile for that area, type of manure management system (lagoon, dry lot, pit, etc.).  Sample costs for day to day farm activities are provided in the model, but can be updated by the user. The model output includes a summary of feed and energy usage for the simulation, including energy estimates for temperature control (both heating and ventilation) as well as costs.

Authors: Jill Heemstra, University of Nebraska jheemstra@unl.edu and Rick Fields, University of Arkansas rfields@uaex.edu

Reviewers: Dr. Jennie Sheerin Popp, University of Arkansas, Dr. Karl Vandevender, University of Arkansas

For More Information:

Acknowledgements

This information is part of the program “Integrated Resource Management Tool to Mitigate the Carbon Footprint of Swine Produced In the U.S.,” and is supported by Agriculture and Food Research Initiative Competitive Grant no. 2011-68002-30208 from the USDA National Institute of Food and Agriculture. Project website.

Does pig health have an impact on greenhouse gas (GHG) emissions?

green stylized pig logoAnimal health does affect greenhouse gas emissions. Sick animals are much less efficient and/or some sick animals may die.  In both of these cases, inputs are used but result in less (or no) product at the end. Most inputs, feed, water, climate control, etc. have greenhouse gas emissions associated with them.

Health status can also potentially change the characteristics of animal manure (amount, nutrient content) as feed and water consumption is disrupted. If the change causes manure to have a higher nitrogen content, the manure in storage may directly emit more nitrous oxide, a greenhouse gas.

Every day, farmers must make decisions on management of their pigs on managing health, from vaccinations to biosecurity planning. They need to consider the level of risk, the expense vs benefits, impacts on pig performance, employee time and skills, and impacts on neighbors.

With such a complexity of information and potential outcomes/impacts, more are turning toward decision tools or models to explore the potential ramifications of decisions and compare different scenarios. These models can be used to estimate outcomes such as  GHG emissions, environmental impacts, or other outputs.

Key Points – How Does Animal Health Relate to Environmental Footprint?

  • Emitted GHGs become a net loss to the system if the animal dies, or if the amount of that product (milk, meat, etc) is reduced due to poor animal health status.
  • Diseases or challenges that reduce productivity (weight gain, number of young born/weaned, milk yield or quality, etc.) tend to reduce efficiency (and increase waste) in the system.
  • Having accurate data to create decision tools or models will help provide farm decision-makers information to properly evaluate potential impacts and trade-offs as they work to improve efficiency and reduce environmental impacts.

For more information:

Acknowledgements

Authors: Rick Fields, University of Arkansas rfields@uaex.edu and Jill Heemstra, University of Nebraska-Lincoln jheemstra@unl.edu

This information is part of the program “Integrated Resource Management Tool to Mitigate the Carbon Footprint of Swine Produced In the U.S.,” and is supported by Agriculture and Food Research Initiative Competitive Grant no. 2011-68002-30208 from the USDA National Institute of Food and Agriculture. Project website.

Do Growth Enhancers Affect the Carbon Footprint of Pork Production?

green stylized pig logoIn swine production, maximizing growth rate while minimizing inputs (efficiency) is a top aim of most farmers. This helps an operation become more profitable, but it also has positive environmental benefits in that the amount of water, feed, or energy needed to produce each pound of pork is reduced. This results in fewer greenhouse gases emitted per pound of pork. (For more information on the relationship between efficiency and carbon footprint in animal agriculture see this Animal Frontiers article).

One particular growth enhancer used by pig farms is ractopamine. This is not an antibiotic, but it alters animal metabolism so that pigs produce more lean tissue (muscle) and less fat. For more on this feed additive, see this Texas A&M fact sheet).

A Comparison of Environmental Footprint With and Without Ractopamine

The image below shows a comparison of the same farm system with and without ractopamine. The results are estimated carbon, water, and land footprints as well as economic costs. The numbers were generated by the Pig Production Environmental Footprint Calculator.

The slide shows a smaller carbon footprint; -37,076 lbs of carbon dioxide equivalents per year when using ractopamine. This farm used 953,754 less gallons of water/year with the growth enhancer and required 14 less acres of land to support the farm. The economic implications (using prices from 2015) were a $11,477 advantage with ractopamine.

slide showing a comparison in carbon, water, land, and economic footprint for a farm with and without ractopamine as a growth enhancer

Slide credit: Dr. Rick Ulrich, University of Arkansas.

Are There Other Ways To Improve Growth Besides Ractopamine?

While growth enhances are a proven way to improve efficiency, there are other research-proven recommendations when making management choices to improve growth rate:

  • Phase feeding – diets change due to changing energy, protein, and other nutritional requirements are different as the animal grows
  • Balancing for specific amino acids (and not just crude protein) for each phase
  • Maintaining a clean environment
  • If in a building, keeping temperature in the optimum range

Management choices also impact health status and biosecurity protocols are used to prevent the presence of specific diseases.  In the past, antibiotics could be added to feed or water at low levels to enhance growth rate, but the concern over the proliferation of antibiotic-resistant bacteria resulted in the new policies to only utilize antibiotics to treat (rather than prevent) disease in food animals. The inclusion of antibiotics deemed medically important is being eliminated (federal rules took effect October, 2015 and the policy is in full effect at the end of 2016) for growth-promoting purposes. (For more, see this newsletter from the National Pork Producers explaining the rules to their members).

For More Information

Acknowledgements

Author: Amy Carroll, University of Arkansas

This information is part of the program “Integrated Resource Management Tool to Mitigate the Carbon Footprint of Swine Produced In the U.S.,” and is supported by Agriculture and Food Research Initiative Competitive Grant no. 2011-68002-30208 from the USDA National Institute of Food and Agriculture. Project website.

Does Manure Solid-Liquid Separation Reduce Greenhouse Gas Emissions on Swine Farms?

green stylized pig logoThere is some research suggesting that separating swine manure into solids and liquids can slightly reduce greenhouse gas (GHG) emissions emitted from the manure itself. It is not likely to be significant enough for separation to be a viable strategy by itself.

The primary reason to use solid-liquid manure separation is to prepare manure for further treatment in a system that can:

  1. generate energy (such as anaerobic digestion, thermal technologies, etc.)
  2. produce products for re-use on a farm (such as bedding for dairy cows),
  3. generate compost or fertilizer.

Any of these options can reduce the GHG emissions or carbon footprint of a farm by replacing fossil-fuel intensive inputs.

For more information

Authors: Rick Fields, University of Arkansas and Jill Heemstra, University of Nebraska jheemstra@unl.edu

Acknowledgements

This information is part of the program “Integrated Resource Management Tool to Mitigate the Carbon Footprint of Swine Produced In the U.S.,” and is supported by Agriculture and Food Research Initiative Competitive Grant no. 2011-68002-30208 from the USDA National Institute of Food and Agriculture. Project website.

How Can Pig Farms Reduce Carbon Footprint?

green stylized pig logoEven though pig farms are not a large source of greenhouse gases (GHGs), the pork industry (along with many agriculture industries) are looking at GHG emissions to identify areas for improvement.

When carbon footprint is reported, you may see numbers that reflect the total GHG emissions for the entire industry or for individual farms. Sometimes you will see it reported in terms of GHGs emitted per pound of pork produced. This is a very appropriate way to examine an industry’s improvements over time as it standardizes the number against changes in number of animals, number of farms, etc.

There are several areas being researched as ways to reduce GHG emissions:

Recommended: [Fact sheet] What is a carbon footprint?

A National Pork Board report on the total production cycle showed that selection and planning of manure storage systems represents the biggest opportunity for reducing the carbon footprint of a farm. Manure emits methane and some nitrous oxide as it decomposes. Both of these GHGs, especially nitrous oxide, are more potent than carbon dioxide in their ability to trap heat.

The video below, by Rick Ulrich, University of Arkansas provides a summary of different areas that are being studied to develop a tool for pig farms on reducing environmental footprint.

Acknowledgements

Author: Jill Heemstra, University of Nebraska jheemstra@unl.edu

This information is part of the program “Integrated Resource Management Tool to Mitigate the Carbon Footprint of Swine Produced In the U.S.,” and is supported by Agriculture and Food Research Initiative Competitive Grant no. 2011-68002-30208 from the USDA National Institute of Food and Agriculture. Project website.

What Is an Environmental Foot Print? (Ecological Footprint)

green stylized pig logoThe Cambridge dictionary defines environmental footprint as:

the effect that a person, company, activity, etc. has on the environment, for example the amount of natural resources that they use and the amount of harmful gases that they produce

Also referred to as an ecological footprint, this is a measure that attempts to consider multiple impacts of an activity rather than focus on a single one. In relation to the swine industry, this foot print takes into account the results of carbon, water, land and air footprints of pig farming.

Related: Evaluating the environmental footprint of pork production

How do you bring all of these different pieces together? In 2011, the U.S. National Pork Board and many land grant researchers launched a project to develop a science-based decision tool called Pig Production Environmental Footprint Calculator (PPEFC). The PPEFC has the ability to calculate (estimate) impact to greenhouse gas emissions, costs, land use, and water consumption across the pork production chain, including feed formulation and crop production. The combined analysis of all of these factors allows identification of potential ecologically and economically feasible production practices for pork producers.

One of the pieces of this project is developing an environmental footprint, cost, and nutrient database of the US animal feed ingredients and integrating it with the calculator. The calculator is built upon cradle-to-farm gate life-cycle assessment (LCA) of pork production combined with the US National Resource Council (NRC) swine nutrient requirements models (NRC 2012), farm operation inputs, and animal feed database. Farm operation inputs include: barn characteristics, utilities, manure management, dead animal disposal, and farm operation costs. For a description of the inputs, visit this conference presentation at LCA Foods 2014.

Additional Information

Factsheets: What is a water footprint? | What is a land footprint? | What is a carbon footprint?

Pig Production Environmental Footprint Calculator (National Pork Board).

Animal agriculture and:

Acknowledgements

Author: Amy Carroll, University of Arkansas

Reviewers: Jill Heemstra, University of Nebraska; Karl Vandevender, University of Arkansas

This information is part of the program “Integrated Resource Management Tool to Mitigate the Carbon Footprint of Swine Produced In the U.S.,” and is supported by Agriculture and Food Research Initiative Competitive Grant no. 2011-68002-30208 from the USDA National Institute of Food and Agriculture. Project website.