Promoting Manure Composting for Livestock Operations

Purpose

While both raw and composted manure benefit soil health and crop production, there are benefits to creating and land-applying composted manure over raw manure. Product uniformity, volume, weed seed, pathogen and parasite reduction and nutrient stability are just a few of the benefits. However, composting manure in Minnesota and North Dakota have yet to gain popularity.

A group of compost producers, who ultimately became our producer cooperators and partnered with us for workshops, were consulted on the reason composting manure is not more common. One said, “It is lack of understanding and time management that holds most other farmers back from composting manure; they do not know how much composting can help their operation.” Another mentioned, “When I started researching composting for my farm, I took a three-day class in Illinois because there wasn’t anything available in North Dakota or Minnesota. Most farmers are not willing to travel that far. There is a need for composting education programs in the two-state area.”

What Did We Do?

NDSU Extension partnered with the University of Minnesota Extension with the original plan of holding four workshops in two years (two each in ND and MN). When implications from the COVID-19 pandemic ensued, we changed our plans to host an online workshop in 2020 and were able to continue with two in-person workshops in 2021.

The online workshop consisted of 13 videos that were sent to registrants 2 weeks before an online, live discussion was held in August 2020 with the presentation team as well as 3 producer cooperators. One of the videos consisted of on-farm interviews with each of our producer cooperators to show the registrants the ability to manage compost differently with similar results. The videos are still available and have been viewed collectively 1,845 times.

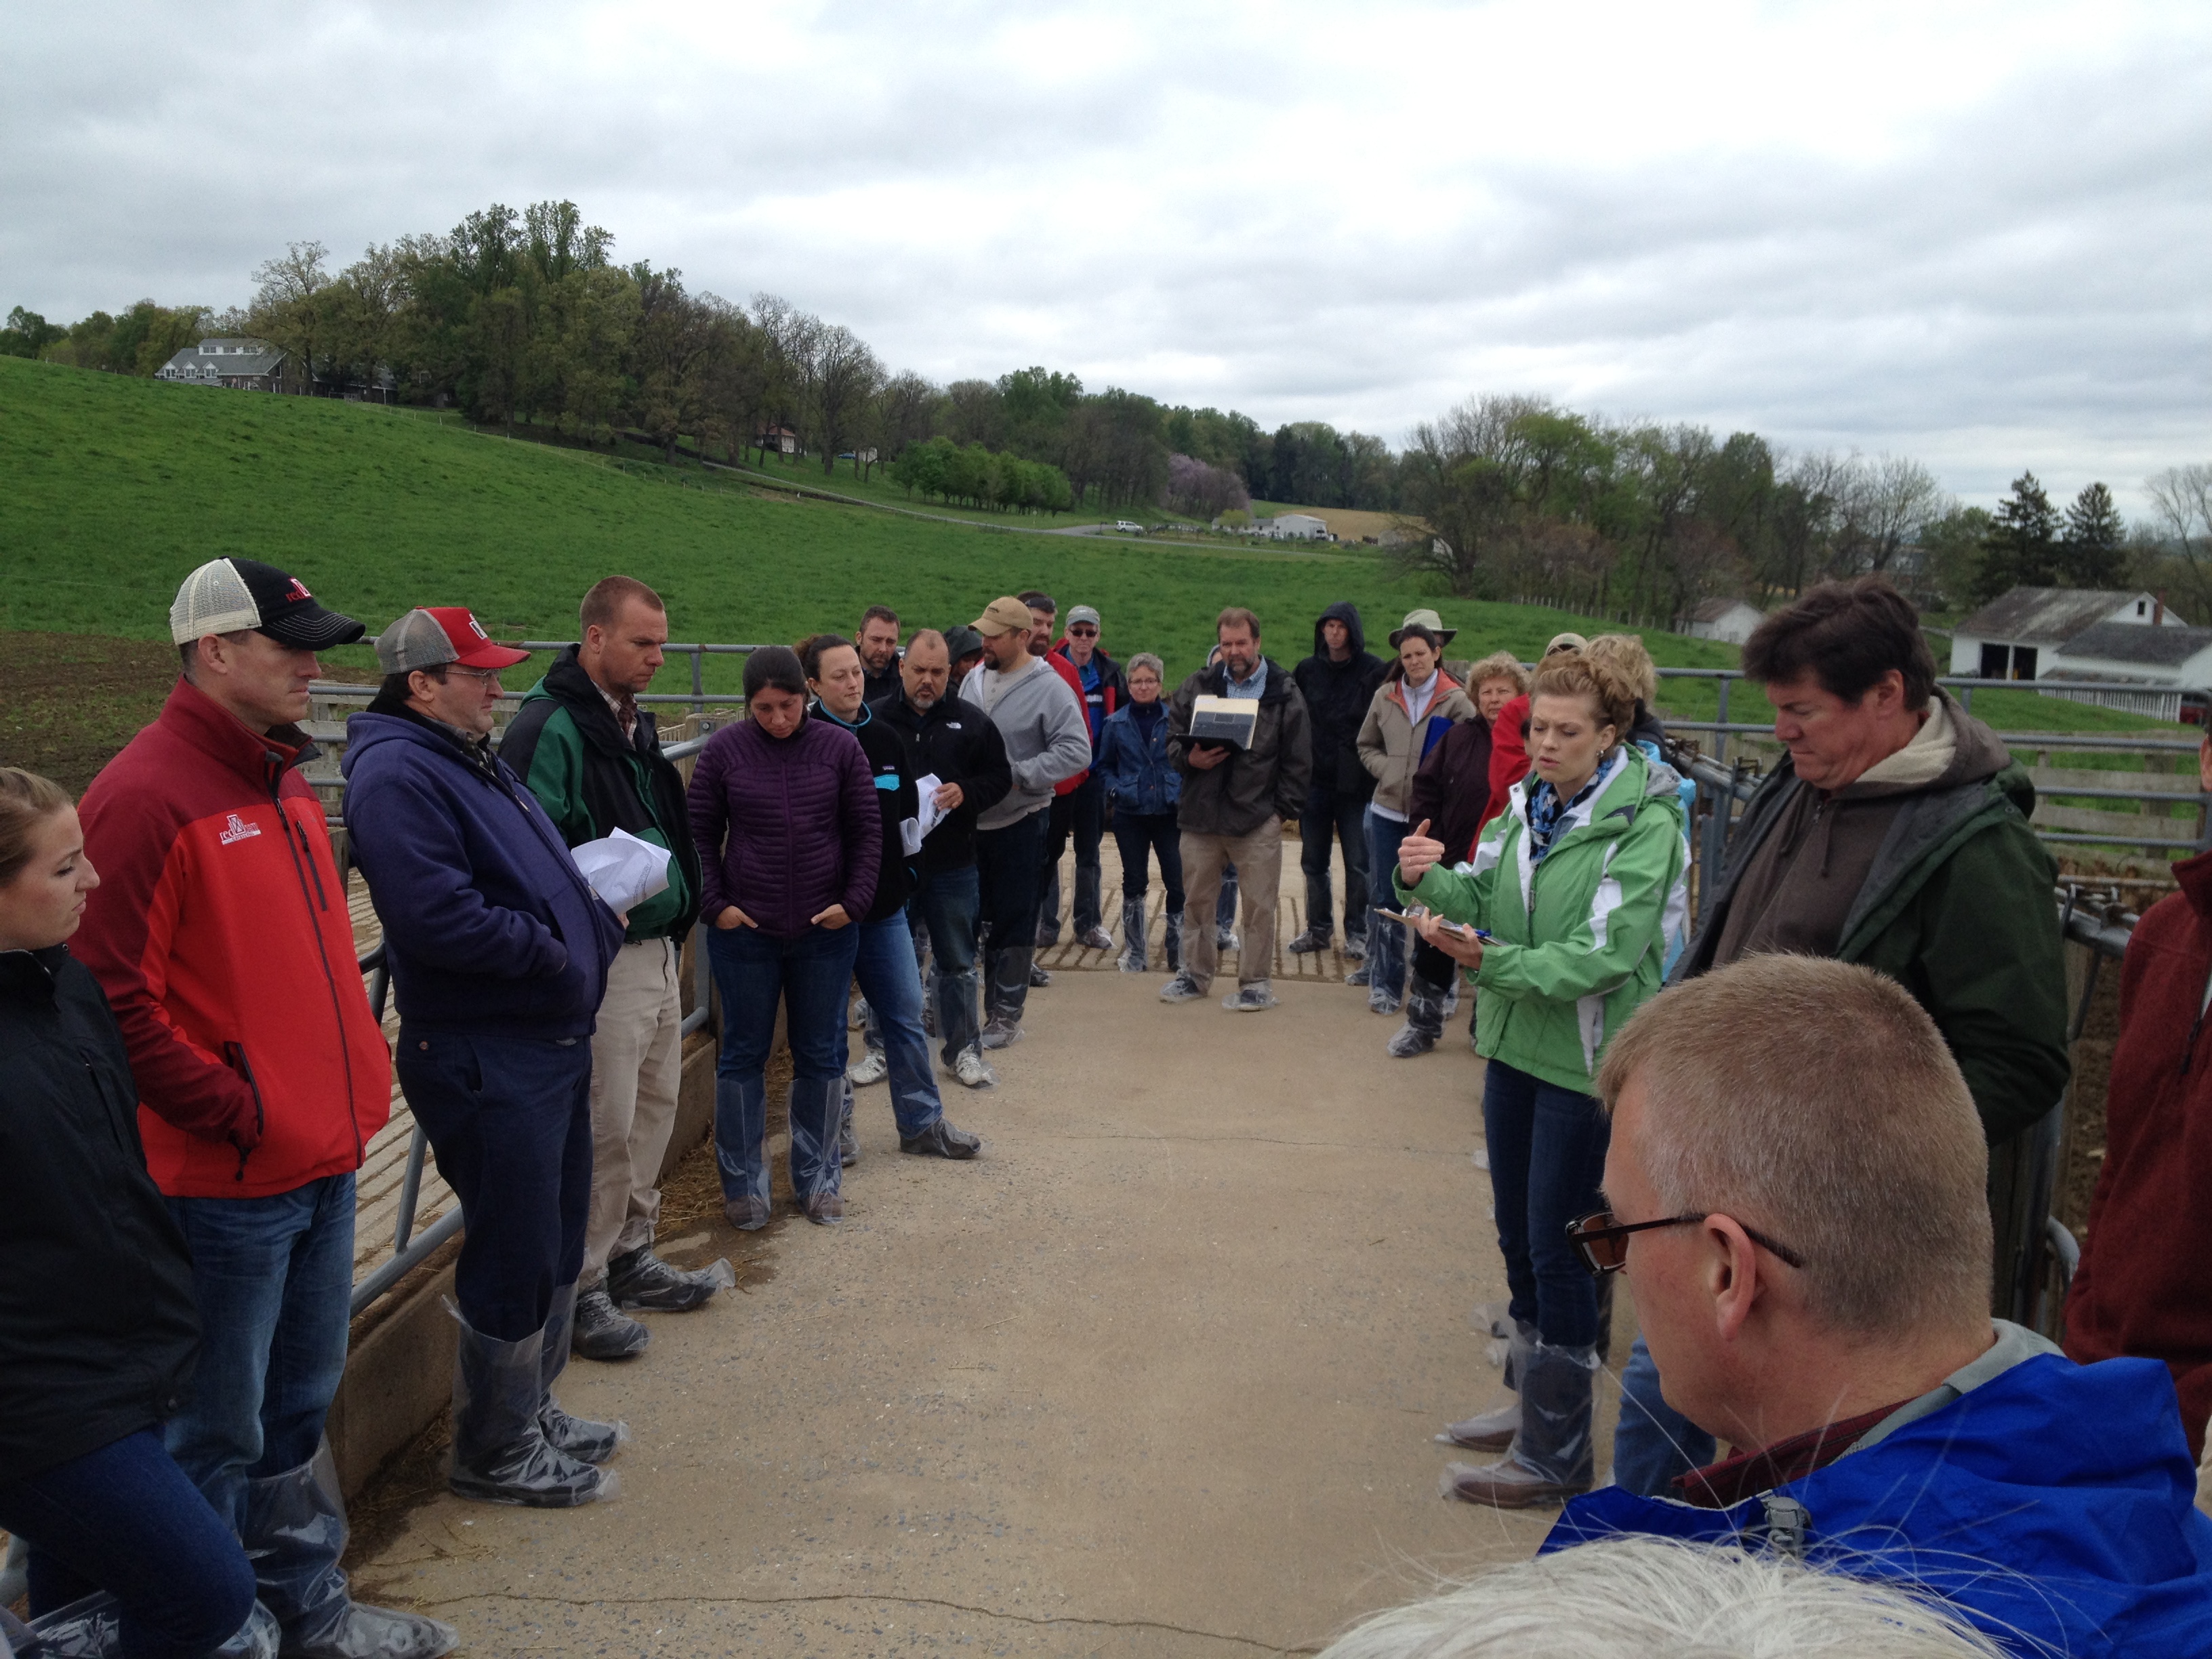
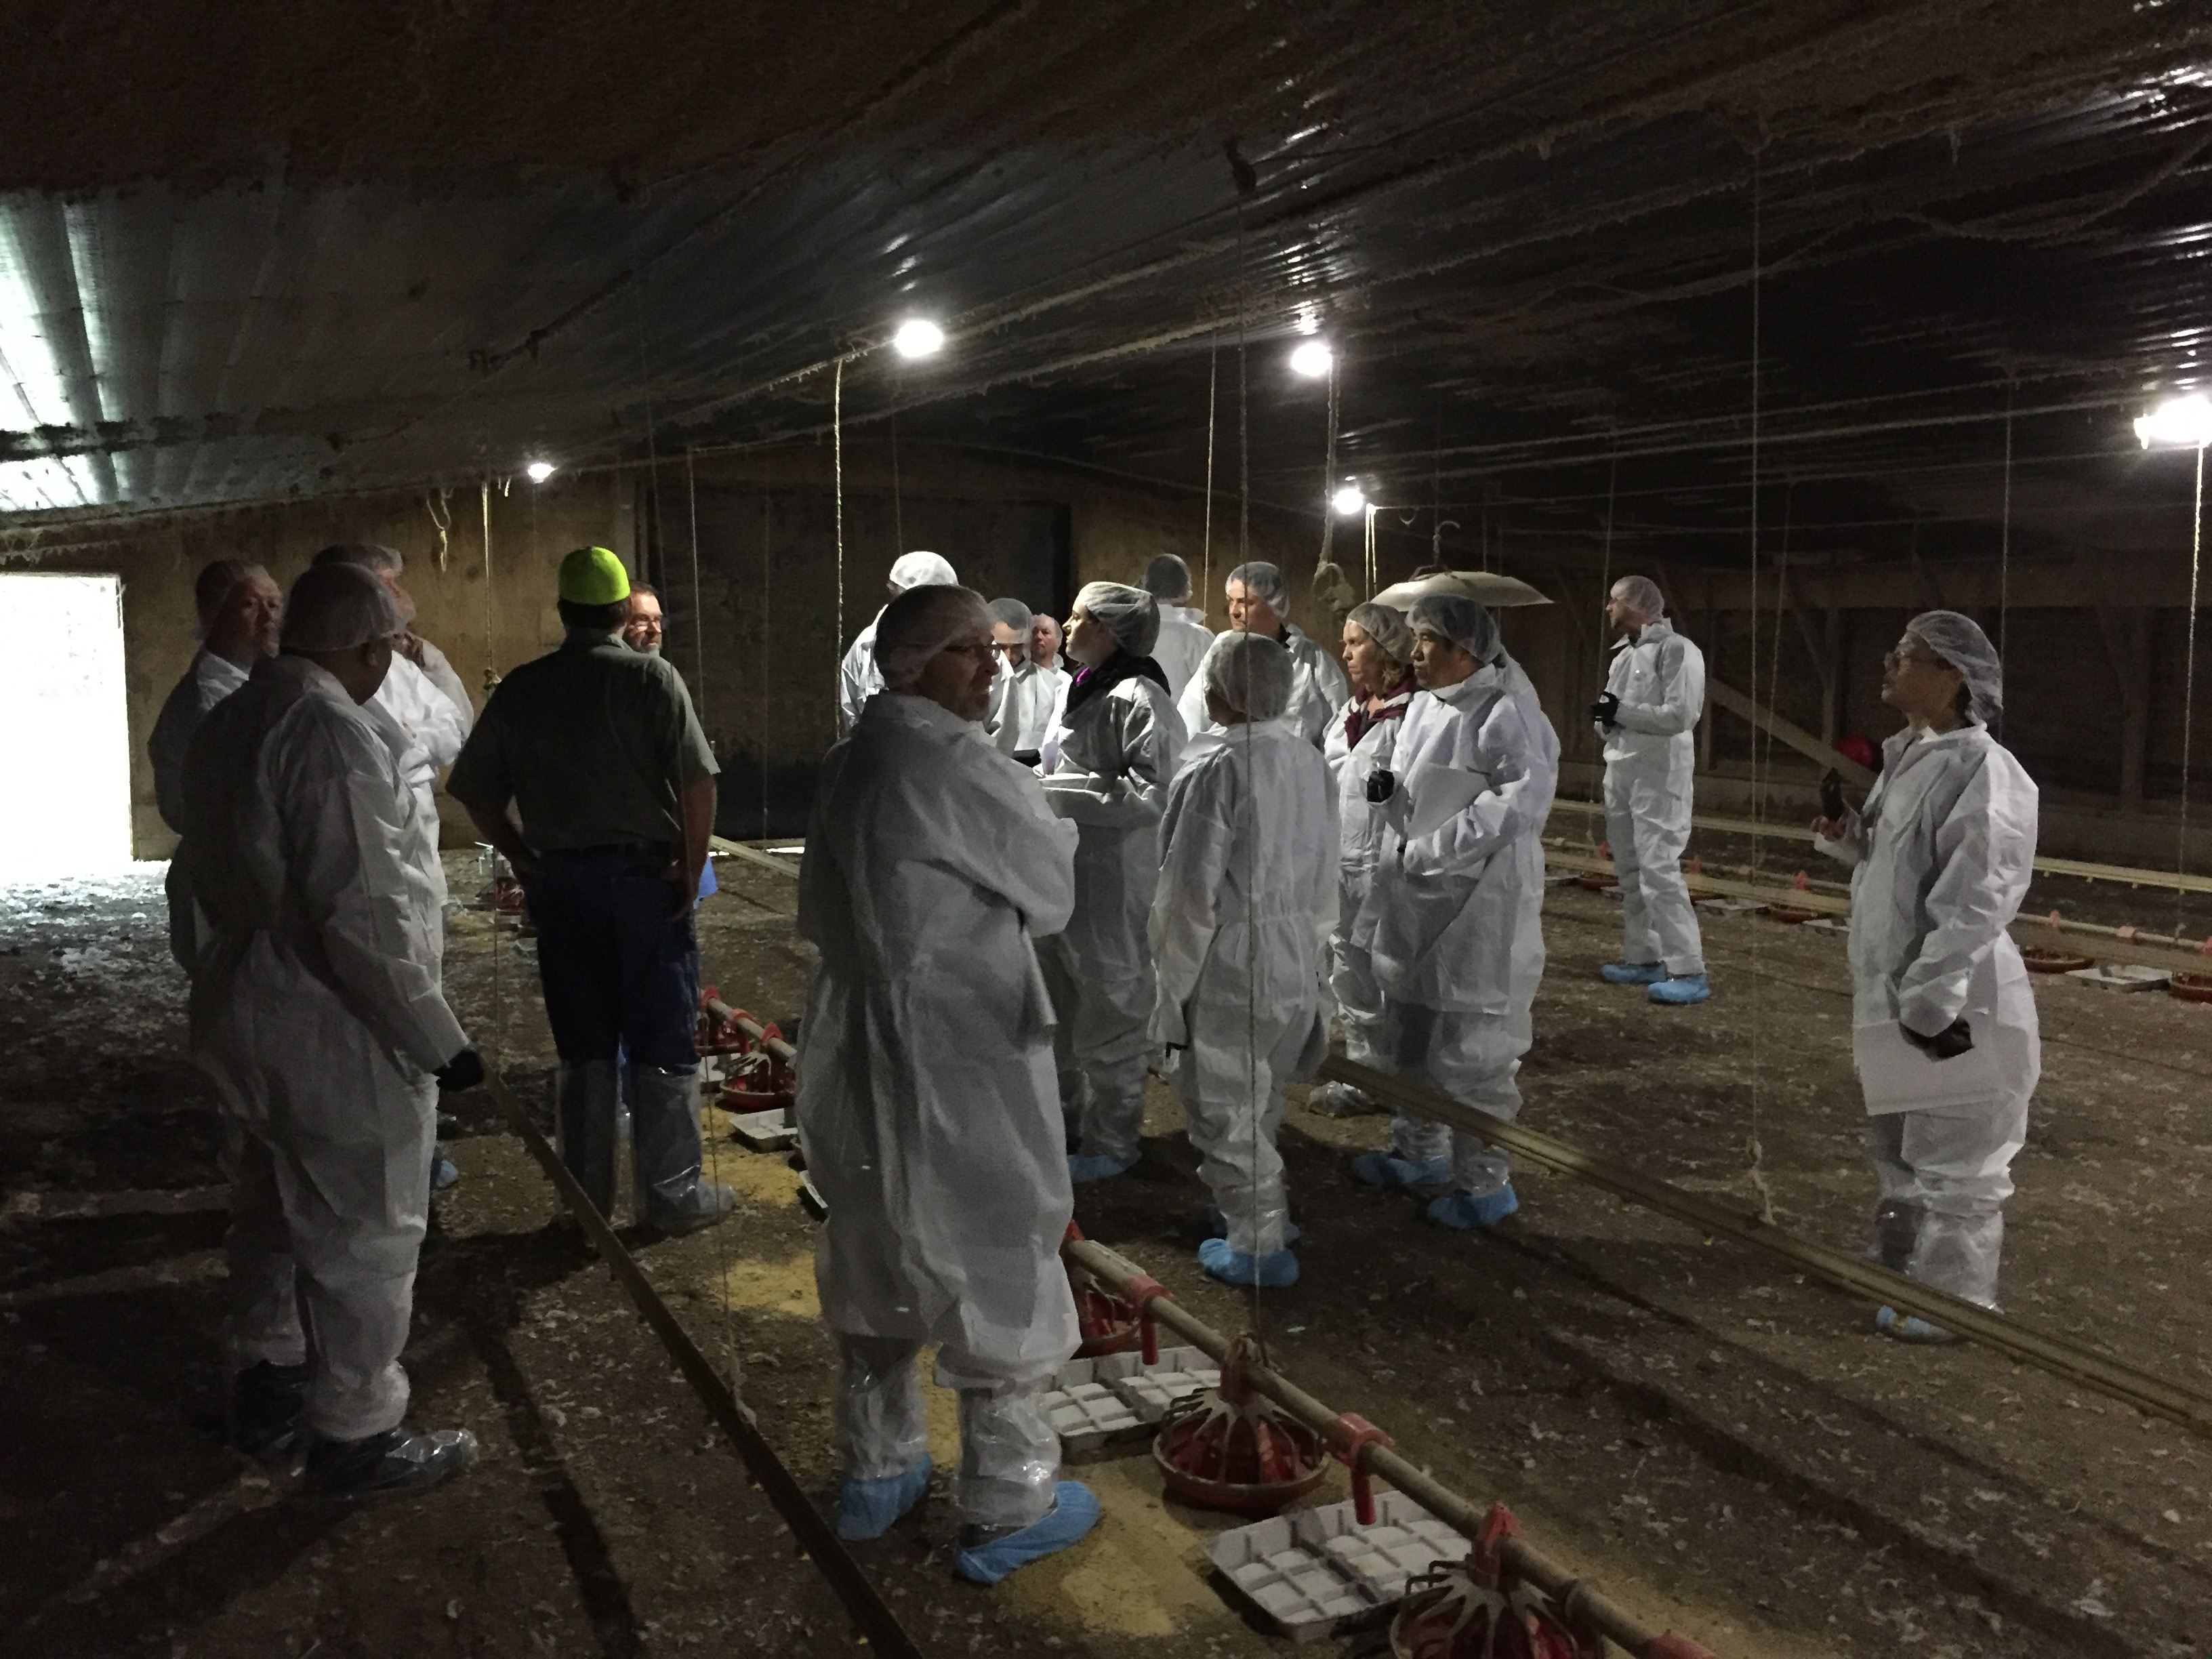
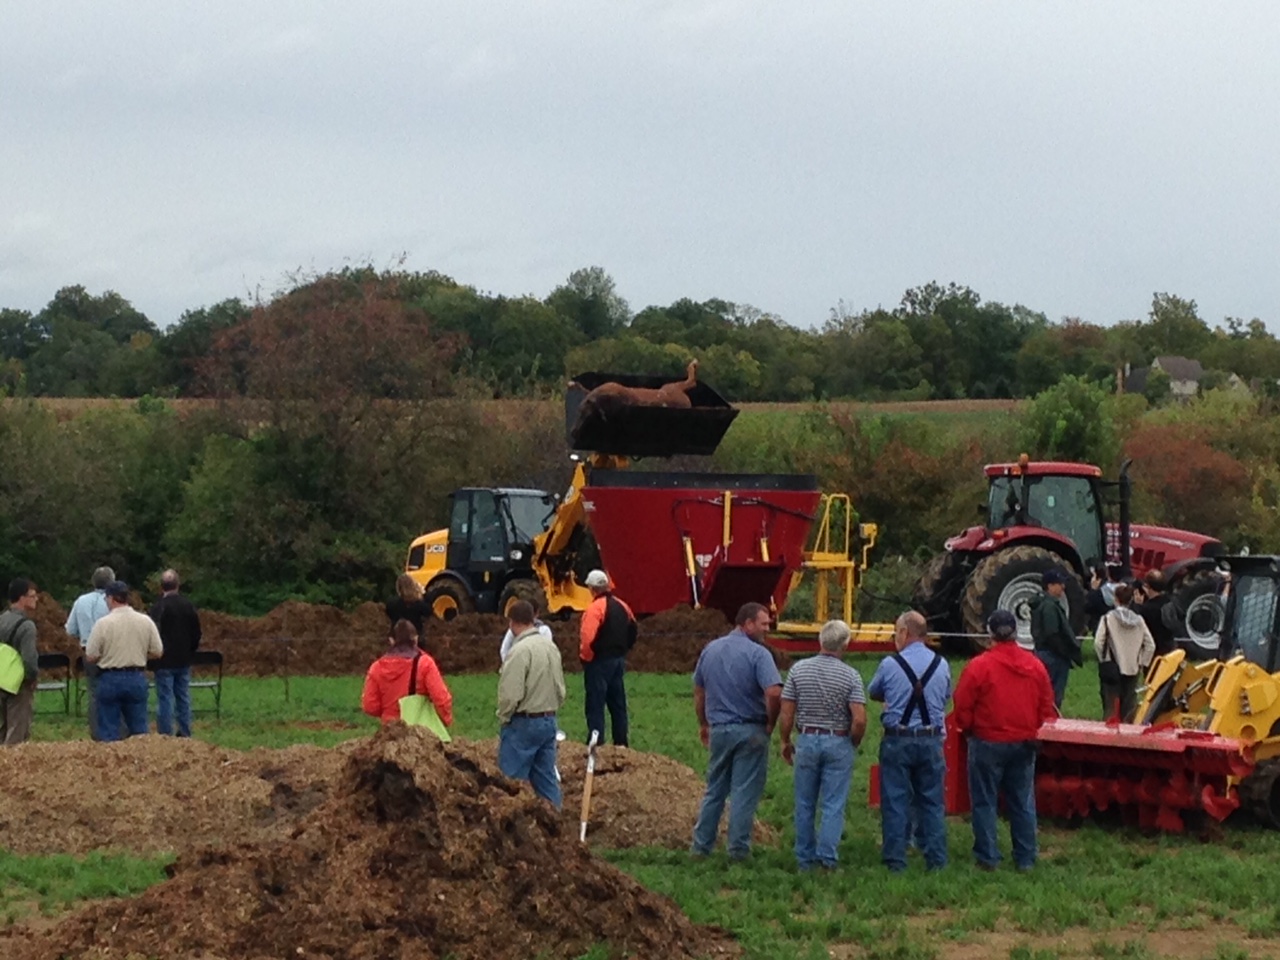
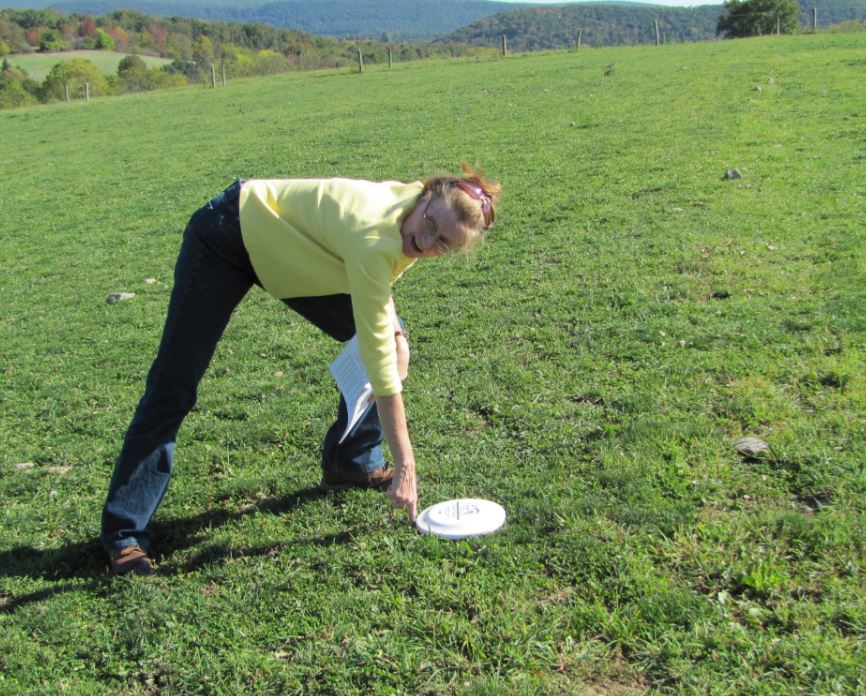
The in-person workshops were held in July and August of 2021. Each workshop covered the same material as the online workshop and all three producer cooperators attended each event. The producer cooperators were responsible for helping attendees with the compost diagnostics activity as well as answering questions during a panel discussion.

What Have We Learned?

Online Workshop

    • 180 people registered for the online workshop and 50 joined the live discussion with presenters and producer cooperators
    • 43 responded to the immediate follow-up survey where
      • 76% thought the self-paced format was excellent
      • 64% thought the amount of material was excellent
      • 62% thought the topics covered were excellent
    • 15 months after the online workshop, 21 people participated in a follow-up survey and as a result of the workshop, 58% reported they had altered their manure composting practices.
    • When asked what manure composting change(s) they made, 58% reported they improved their operations adding,
      • “I have more confidence in my ability to compost successfully and have a better understanding of the environmental impacts of composting.”
      • “I no longer have to pay someone to haul away our waste”
      • “Although not composting on a commercial level, I manage several community gardens where large volumes of biomass are accumulated. After learning additional techniques, my piles were hotter and decomposed more quickly. The key? More moisture!”

Moving the workshop online for the first year allowed us to fully engage our producer cooperators. The online workshop resulted in participant comments such as,

    • “Well organized and executed. Appreciated that videos were individual by topic area, short, and focused. That allowed me to watch what was relevant and fit it into my day more easily.”
    • “Really enjoyed the discussion and interaction between the three cooperators. Also appreciated having enough time to flesh out the information, i.e., didn’t try to squeeze it into one hour.”

Though an in-person meeting would have allowed more hands-on experience, the online version reached a broader audience with attendees from 31 states and 3 countries.

In-person Workshops

    • 31 people attended the in-person workshops in ND and MN, of which 10 participated in a 4-month follow-up survey
      • 67% of those who made changes as a result of the workshop stated they started composting manure
    • 100% of those who did not make changes were either agency or university Extension/research personnel who reported the workshops impacted them, their work, and/or their relationship with their clients by:
      • “Allowing me to be more educated about manure composting so that when producers inquire about composting I am able to give them accurate information.”
      • “Using workshop information to inform clients of another manure handling method to consider; composting.”

The workshops, both online and in-person, facilitated discussion and mutual learning among experienced and novice composters of livestock manure.

Future Plans

Questions about static composting were asked during both the online and in-person workshops. This practice is not common in North Dakota or Minnesota so there is certainly a future learning and workshop opportunity.

Authors

Mary A. Keena, Extension Specialist, North Dakota State University

Corresponding author email address

mary.keena@ndsu.edu

Additional authors

Chryseis Modderman, Extension Educator, University of Minnesota; Melissa L. Wilson, Assistant Professor and Extension Specialist, University of Minnesota; William J. Gale, Extension Agent, North Dakota State University

Additional Information

    1. Online Composting Workshop Videos YouTube playlist: https://youtube.com/playlist?list=PLnn8HanJ32l6uhwdS9m-G1z8Bq1U0aJzF
    1. Two compost-related publications for producers were created for use while at the compost rows:

Acknowledgements

This project was funded by North Central Sustainable Agriculture Research and Education (NC-SARE).


The authors are solely responsible for the content of these proceedings. The technical information does not necessarily reflect the official position of the sponsoring agencies or institutions represented by planning committee members, and inclusion and distribution herein does not constitute an endorsement of views expressed by the same. Printed materials included herein are not refereed publications. Citations should appear as follows. EXAMPLE: Authors. 2022. Title of presentation. Waste to Worth. Oregon, OH. April 18-22, 2022. URL of this page. Accessed on: today’s date.

USDA-NRCS and the National Air Quality Site Assessment Tool (NAQSAT) for Livestock and Poultry Operations

Proceedings Home | W2W Home w2w17 logo

Purpose

The National Air Quality Site Assessment Tool (NAQSAT) was developed as a first-of-its-kind tool to help producers and their advisors assess the impact of management on air emissions from livestock and poultry operations and identify areas for potential improvement related to those air emissions.

What did we do?

In 2007, several land-grant universities, with leadership from Michigan State University, began developing NAQSAT under a USDA-NRCS Conservation Innovation Grant (CIG). The initial tool included beef, dairy, swine, and poultry operations. A subsequent CIG project, with leadership from Colorado State University, made several enhancements to the tool, including adding horses to the species list. In 2015, USDA-NRCS officially adopted NAQSAT as an approved tool for evaluating air quality resource concerns at livestock and poultry operations. USDA-NRCS also contracted with Florida A&M University in 2015 to provide several regional training workshops on NAQSAT to NRCS employees. Six training workshops have been completed to date (Raleigh, NC; Modesto, CA; Elizabethtown, PA; Lincoln, NE; Richmond, VA; and Yakima, WA) with assistance from multiple NAQSAT development partners. Additionally, USDA-NRCS revised its comprehensive nutrient management plan (CNMP) policy in October 2015 to make the evaluation of air quality resource concerns mandatory as part of CNMP development.

Snippet from website of the National Air Quality Site Assessment Tool

Group photo of team in field

Zwicke in class lecturing

Zwicke and group in animal housing facility

What have we learned?

NAQSAT has proven to be a useful tool for bench-marking the air emissions impacts of current management on confinement-based livestock and poultry operations. In the training sessions, students have been able to complete NAQSAT runs on-site with the producer or producer representative via tablet or smartphone technologies. Further classroom discussion has helped to better understand the questions and answers and how the NAQSAT results can feed into the USDA-NRCS conservation planning process. Several needed enhancements and upgrades to the tool have been identified in order to more closely align the output of the tool to USDA-NRCS conservation planning needs. NAQSAT has also proven to be useful for evaluating the air quality resource concern status of an operation in relation to the CNMP development process.

Future Plans

It is anticipated that the identified needed enhancements and upgrades will be completed as funding for further NAQSAT development becomes available. Additionally, as use of NAQSAT by USDA-NRCS and our conservation planning and CNMP development partners expands, additional training and experience-building opportunities will be needed. The NAQSAT development team has great geographic coverage to assist in these additional opportunities.

Corresponding author, title, and affiliation

Greg Zwicke, Air Quality Engineer – Air Quality and Atmospheric Change Team, USDA-NRCS

Corresponding author email

greg.zwicke@ftc.usda.gov

Other authors

Greg Johnson, Air Quality and Atmospheric Change Team Leader, USDA-NRCS; Jeff Porter, Animal Nutrient and Manure Management Team Leader, USDA-NRCS; Sandy Means, Agricultural Engineer – Animal Nutrient and Manure Management Team, USDA-NRCS

Additional information

naqsat.tamu.edu

https://lpelc.org/naqsat-for-swine-and-poultry

https://lpelc.org/naqsat-for-beef-and-dairy/

Acknowledgements

C.E. Meadows Endowment, Michigan State University

Colorado Livestock Association

Colorado State University

Florida A&M University

Iowa Turkey Federation

Iowa Pork Producers

Iowa Pork Industry Center

Iowa State University

Iowa State University Experiment Station

Kansas State University

Michigan Milk Producers Association

Michigan Pork Producers Association

Michigan State University

Michigan State University Extension

National Pork Board

Nebraska Environmental Trust

Oregon State University

Penn State University

Purdue University

Texas A&M University

University of California, Davis

University of Georgia

University of Georgia Department of Poultry Science

University of Idaho

University of Maryland

University of Maryland Department of Animal and Avian Sciences

University of Minnesota

University of Missouri

University of Nebraska

USDA-ARS

Virginia Tech University

Washington State University

Western United Dairymen

Whatcom County (WA) Conservation District

The authors are solely responsible for the content of these proceedings. The technical information does not necessarily reflect the official position of the sponsoring agencies or institutions represented by planning committee members, and inclusion and distribution herein does not constitute an endorsement of views expressed by the same. Printed materials included herein are not refereed publications. Citations should appear as follows. EXAMPLE: Authors. 2017. Title of presentation. Waste to Worth: Spreading Science and Solutions. Cary, NC. April 18-21, 2017. URL of this page. Accessed on: today’s date.

Field Technology & Water Quality Outreach

Proceedings Home | W2W Home waste to worth 2017 logo

Purpose

In 2015, Washington State Department of Agriculture (WSDA) partnered with local and state agencies to help identify potential sources of fecal coliform bacteria that were impacting shellfish beds in northwest Washington.  WSDA and Pollution Identification and Correction (PIC) program partners began collecting ambient, as well as rain-driven, source identification water samples. Large watersheds with multiple sub-basins, changing weather and field conditions, and recent nutrient applications, meant new sites were added almost daily. The increased sampling created an avalanche of new data. With this data, we needed to figure out how to share it in a way that was timely, clear and could motivate change. Picture of water quality data via spreadsheet, graphs, and maps.

Conveying complex water quality results to a broad audience can be challenging. Previously, water quality data would be shared with the public and partners through spreadsheets or graphs via email, meetings or quarterly updates. However, the data that was being shared was often too late or too overwhelming to link locations, weather or field conditions to water quality. Even though plenty of data was available, it was difficult for it to have meaningful context to the general public.

Ease of access to results can help inform landowners of hot spots near their home, it can link recent weather and their own land management practices with water quality, as well as inform and influence decision-making.

What Did We Do?

Using basic GIS tools we created an interactive map, to share recent water quality results. The map is available on smartphones, tablets and personal computers, displaying near-real-time results from multiple agencies.  Viewers can access the map 24 hours a day, 7 days a week.

We have noticed increPicture of basic GIS tool.
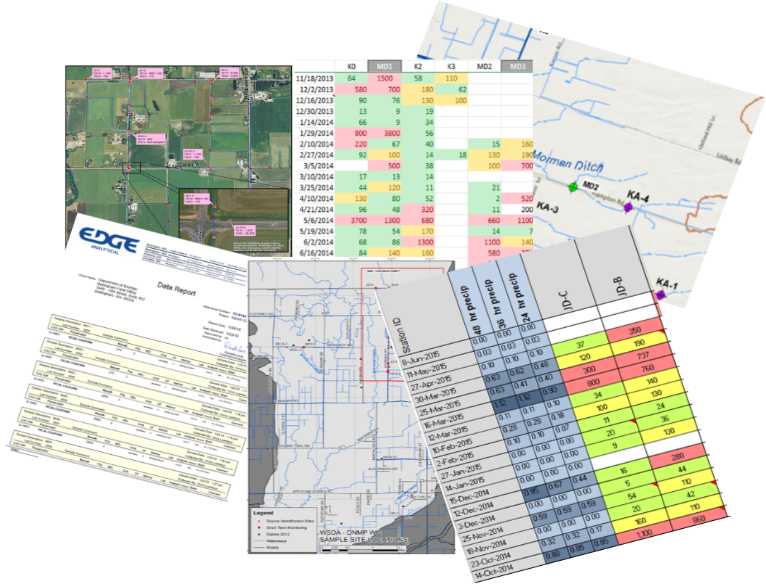
ased engagement from our dairy producers, with many checking the results map regularly for updates. The map is symbolized with graduated stop light symbology, with poor water quality shown in red and good in green. If they see a red dot or “hot spot” in their neighborhood they may stop us on the street, send an email, or call with ideas or observations of what they believe may have influenced water quality. It has opened the door to conversations and partnerships in identifying and correcting possible influences from their farm.

The map also contains historic results data for each site, which can show changes in water quality. It allows the viewer to evaluate if the results are the norm or an anomaly. “Are high results after a rainfall event or when my animals are on that pasture?”

The online map has also increased engagement with our Canadian neighbors to the north. By collecting samples at the US/Canadian border we have been able to map streams where elevated bacteria levels come across the border. This has created an opportunity to partner with our Canadian counterparts to continue to identify and correct sources.

What Have We Learned?

You do not need to be a GIS professional to create an app like this for your organization. Learning the system and fine-tuning the web application can take some time, but it is well worth the investment. GIS skills derived from this project have proven invaluable as the app transfers to other areas of non-point work.  The web application has created great efficiencies in collaboration, allowing field staff to quickly evaluate water quality trends in order to spend their time where it is most needed. The application has also provided transparency to the public regarding our field work, demonstrating why we are sampling particular areas.

From producer surveys, we have learned that viewers prefer a one-stop portal for information. Viewers are less concerned about what agency collected the data as they are interested in what the data says. This includes recent, as well as historical water quality data, field observations; such as wildlife or livestock presence or other potential sources. Also, a brief weekly overview of conditions, observations and/or trends has been requested to provide additional context.

Future Plans

The ease and efficiency of the mobile mapping and data sharing has opened the door to other collaborative projects. Currently we are developing a “Nutrient Tracker” application that allows all PIC partners to easily update a map from the field. The map allows the user to log recent field applications of manure. Using polygons to draw the area on the field, staff can note the date nutrients were identified, type of application, proximity to surface water, if it was a low-, medium- or high-risk application, if follow-up is warranted, and what agency would be the lead contact. This is a helpful tool in learning how producers utilize nutrients, to refer properties of concern to the appropriate agency, and to evaluate recent water quality results against known applications.

Developing another outreach tool, WSDA is collecting 5 years of fall soil nitrate tests from all dairy fields in Washington State. The goal is to create a visual representation of soil data, to demonstrate to producers how nitrate levels on fields have changed from year to year, and to easily identify areas that need to be re-evaluated when making nutrient application decisions.

As part of a collaborative Pollution Identification and Correction (PIC) group, we would like to create a “Story Map” that details the current situation, why it is a concern, explain potential sources and what steps can be taken at an individual level to make a difference. A map that visually demonstrates where the watersheds are and how local neighborhoods really do connect to people 7 miles downstream.  An interactive map that not only shows sampling locations, but allows the viewer to drill down deeper for more information about the focus areas, such as pop-ups that explain what fecal coliform bacteria are and what factors can increase bacteria levels. We envision a multi-layer map that includes 24-hour rainfall, river rise, and shellfish bed closures. This interactive map will also share success stories as well as on-going efforts.

Author

Kerri Love, Dairy Nutrient Inspector, Dairy Nutrient Management Program, Washington State Department of Agriculture

klove@agr.wa.gov

Additional Information

Results Map Link: http://arcg.is/1Q9tF48

Washington Shellfish Initiative: http://www.governor.wa.gov/issues/issues/energy-environment/shellfish

Mobile Mapping Technology presentation by Michael Isensee, 2016 National CAFO Roundtable

Sharing the Data: Interactive Maps Provide Rapid Feedback on Recent Water Quality and Incite Change by Educating the Public, Kyrre Flege, Washington State Department of Agriculture and Jessica Kirkpatrick, Washington State Department of Ecology,  2016 National Non-Point Source Monitoring Workshop

Whatcom County PIC Program: http://www.whatcomcounty.us/1072/Water-Quality

Skagit County, Clean Samish Initiative: https://www.skagitcounty.net/Departments/PublicWorksCleanWater/cleansamish.htm

Lower Stillguamish PIC Program: http://snohomishcountywa.gov/3344/Lower-Stilly-PIC-Program

GIS Web Applications: http://doc.arcgis.com/en/web-appbuilder/

Acknowledgements

The web application was a collaborative project developed by Kyrre Flege, Washington State Department of Agriculture and Jessica Kirkpatrick, Washington State Department of Ecology.

The authors are solely responsible for the content of these proceedings. The technical information does not necessarily reflect the official position of the sponsoring agencies or institutions represented by planning committee members, and inclusion and distribution herein does not constitute an endorsement of views expressed by the same. Printed materials included herein are not refereed publications. Citations should appear as follows. EXAMPLE: Authors. 2017. Title of presentation. Waste to Worth: Spreading Science and Solutions. Cary, NC. April 18-21, 2017. URL of this page. Accessed on: today’s date.

Manure Management Technology Selection Guidance

Proceedings Home W2W Home w2w17 logo

Purpose

Manure is an inevitable by-product of livestock production. Traditionally, manure has been land applied for the nutrient value in crop production and improved soil quality.With livestock operations getting larger and, in many cases, concentrating in certain areas of the country, it is becoming more difficult to balance manure applications to plant uptake needs. In many places, this imbalance has led to over-application of nutrients with increased potential for surface water, ground water and air quality impairments. No two livestock operations are identical and manure management technologies are generally quite expensive, so it is important to choose the right technology for a specific livestock operation. Information is provided to assist planners and landowners in selecting the right technology to appropriately address the associated manure management concerns.

What did we do?

As with developing a good conservation plan, knowledge of manure management technologies can help landowners and operators best address resource concerns related to animal manure management. There are so many things to consider when looking at selecting various manure treatment technologies to make sure that it will function properly within an operation. From a technology standpoint, users must understand the different applications related to physical, chemical, and biological unit processes which can greatly assist an operator in choosing the most appropriate technology. By having a good understanding of the advantages and disadvantages of these technologies, better decisions can be made to address the manure-related resource concerns and help landowners:

• Install conservation practices to address and avoid soil erosion, water and air quality issues.

• In the use of innovative technologies that will reduce excess manure volume and nutrients and provide value-added products.

• In the use of cover crops and rotational cropping systems to uptake nutrients at a rate more closely related to those from applied animal manures.

• In the use of local manure to provide nutrients for locally grown crops and, when possible, discourage the importation of externally produced feed products.

• When excess manure can no longer be applied to local land, to select options that make feasible the transport of manure nutrients to regions where nutrients are needed.

• Better understand the benefits and limitations of the various manure management technologies.

Picture of holding tank

Complete-Mix Anaerobic Digester – option to reduce odors and pathogens; potential energy production

Picture of mechanical equipment

Gasification (pyrolysis) system – for reduced odors; pathogen destruction; volume reduction; potential energy production.

Picture of field

Windrow composting – reduce pathogens; volume reduction

Picture of Flottweg separation technology

Centrifuge separation system – multiple material streams; potential nutrient
partitioning.

What have we learned?

• There are several options for addressing manure distribution and application management issues. There is no silver bullet.

• Each livestock operation will need to be evaluated separately, because there is no single alternative which will address all manure management issues and concerns.

• Option selections are dependent on a number of factors such as: landowner objectives, manure consistency, land availability, nutrient loads, and available markets.

• Several alternatives may need to be combined to meet the desired outcome.

• Soil erosion, water and air quality concerns also need to be addressed when dealing with manure management issues.

• Most options require significant financial investment.

Future Plans

Work with technology providers and others to further evaluate technologies and update information as necessary. Incorporate findings into NRCS handbooks and fact sheets for use by staff and landowners in selecting the best technology for particular livestock operations.

Corresponding author, title, and affiliation

Jeffrey P. Porter, P.E.; National Animal Manure and Nutrient Management Team Leader USDA-Natural Resources Conservation Service

Corresponding author email

jeffrey.porter@gnb.usda.gov

Other authors

Darren Hickman, P.E., National Geospatial Center of Excellence Director USDA-Natural Resources Conservation Service; John Davis, National Nutrient Management Specialist USDA-Natural Resources Conservation Service, retired

Additional information

References

USDA-NRCS Handbooks – Title 210, Part 651 – Agricultural Waste Management Field Handbook

USDA-NRCS Handbooks – Title 210, Part 637 – Environmental Engineering, Chapter 4 – Solid-liquid Separation Alternatives for Manure Handling and Treatment (soon to be published)

Webinars

Evaluation of Manure Management Systems – http://www.conservationwebinars.net/webinars/evaluation-of-manure-management-systems/?searchterm=animal waste

Use of Solid-Liquid Separation Alternatives for Manure Handling and Treatment – http://www.conservationwebinars.net/webinars/use-of-solid-liquid-separation-alternatives-for-manure-handling-and-treatment/?searchterm=animal waste

The authors are solely responsible for the content of these proceedings. The technical information does not necessarily reflect the official position of the sponsoring agencies or institutions represented by planning committee members, and inclusion and distribution herein does not constitute an endorsement of views expressed by the same. Printed materials included herein are not refereed publications. Citations should appear as follows. EXAMPLE: Authors. 2017. Title of presentation. Waste to Worth: Spreading Science and Solutions. Cary, NC. April 18-21, 2017. URL of this page. Accessed on: today’s date.

Partnerships in the Manure Nutrient Management Field

Proceedings Home W2W Homew2w17 logo

Purpose

Responsible manure nutrient management improves environmental quality while maintaining agricultural productivity. Multiple organizations and individuals play a part in improving the understanding and practice of responsible management. But how does manure nutrient management information flow? The “Pathways” project’s goals were to understand and delineate pathways for effective information dissemination and use among various agricultural professional audiences that facilitate successful integrated (research/outreach/education) projects and programs. This presentation examines the relevance of partnerships within the manure nutrient management network and barriers to these partnerships.

What did we do?

We disseminated the “Pathways” survey online utilizing the mailing lists of several professional and producer organizations and listservs associated with manure management. There were 964 surveys started and 608 completed. The six types of organizations with more than 10% of the total survey population’s responses were university/Extension; government non-regulatory agencies; government regulatory agencies; producers; special government agencies; and sale or private enterprises.

The South Dakota State University Institutional Review Board deemed the survey exempt under federal regulation 45 CFR 46.101 (b) (IRB-1402010-EXM and IRB-1502001-EXM).

What have we learned?

The survey posed “How important is collaboration with each of the following groups related to manure nutrient management?” Figure 1 shows the mean relevance among all survey participants, evaluated on a scale of 1 (Not important/somewhat unimportant) to 4 (Highly important). On average, all potential partner groups were recognized as important (>2). Partnerships with producers were deemed most important (3.68) by all survey respondents.

After assessing relevance, we asked survey participants to indicate what barriers, if any, deter them from collaboration with each of the following groups related to manure nutrient management (select all that apply). For all potential partners listed, with the exception of tribal governments, “No Barriers to Use” was the most selected option. “Do Not Have a Relationship” was a common and stronger barrier for commodity, sales and service partners, compared to government agencies, for example.

The barriers “Discouraged or Not Allowed” and “No Incentive to Collaborate” were relatively small selections. The barrier “Do Not Have a Relationship” is possible to overcome at both individual and organizational levels, where needed.

Figure 1. The average relevance and the distribution of barriers to collaborating or partnering with the types of organizations specified, for purposes of manure nutrient management

Future Plans

In the future, assessing the reasons for specific partnerships can further aid improving communication and collaboration in the manure nutrient management network.

Corresponding author, title, and affiliation

Erin Cortus, Associate Professor and Environmental Quality Specialist at South Dakota State University

Corresponding author email

erin.cortus@sdstate.edu

Additional information

lpelc.org/the-pathways-project

Acknowledgements

The Pathways Project greatly appreciates the support of the North Central Region Water Network Seed Grant, South Dakota Sustainable Agriculture Research and Education, and the collaborative groups of educators, researchers and agency personnel, for improving and advocating the survey.

The authors are solely responsible for the content of these proceedings. The technical information does not necessarily reflect the official position of the sponsoring agencies or institutions represented by planning committee members, and inclusion and distribution herein does not constitute an endorsement of views expressed by the same. Printed materials included herein are not refereed publications. Citations should appear as follows. EXAMPLE: Authors. 2017. Title of presentation. Waste to Worth: Spreading Science and Solutions. Cary, NC. April 18-21, 2017. URL of this page. Accessed on: today’s date.

Organizing demonstrations and tours for Government officials and Extension on Animal Mortality Management

Proceedings Home W2W Home w2w17 logo

Purpose

Provide some discussion on putting together Tour and Demonstration educational events. To Provide real life demonstrations and educational opportunities dealing with Mortality management.

What did we do?

The agent participated on a multi-state and multi country steering committee to organize and host an international symposium on Animal Mortality and Disposal Management. This was the 5th symposium and had 179 registered attendees from 11 different countries: Australia, Canada, China, Georgia, Korea, New Zealand, Nigeria, the UK, the US, Tunisia, and Vietnam.

The agent served as the host state coordinator (Penn), the 3 bus tour coordinator and the demonstration’s chairperson. Demonstrations included high density foaming, compost pile building and turning, environmental grinder processors, Clean Harbor Industries,  truck wash stations, and proper euthanasia with cap and bolt guns. The agent will list the success and challenges of these types of demonstrations and educational events. Results are from the 5th International Symposium on Managing Animal Mortality, Products, and By-products, and Associated Health Risk: Connecting Research, Regulations and Response at the Southeast Agricultural Research and Extension Center on Wednesday, September 30, 2015.

Moving horse for mortality composting
Examples of demonstrations during the field day

What have we learned?

Excellent industry tours and Farm tours and Demonstrations are an excellent learning opportunity. All Parties including Extension, Farmers, Industry and government personnel can benefit from hands on education.  Those in attendance gained skills and knowledge to be able to host their own training sessions and to be better prepared to handle animal mortality outbreaks and events in their own state.  They gained a first hand experience on pile building and related technologies for this type of event.

Demo with tractor covering mortality composting pile
Turning of a 60 day compost pile

Future Plans

The International Committee on Animal Mortality and Waste Products is a collection of University researchers and educators, State Department of Agriculture, Federal Homeland Security and Environmental Protection Agency personnel. The committee plans to meet for future International Symposiums as needed.

http://animalmortmgmt.org/symposium/contributors/

Corresponding author, title, and affiliation

J Craig Williams, County Agent, Penn State Extension

Corresponding author email

jcw17@psu.edu

Additional information

Conference website

http://animalmortmgmt.org/

The authors are solely responsible for the content of these proceedings. The technical information does not necessarily reflect the official position of the sponsoring agencies or institutions represented by planning committee members, and inclusion and distribution herein does not constitute an endorsement of views expressed by the same. Printed materials included herein are not refereed publications. Citations should appear as follows. EXAMPLE: Authors. 2017. Title of presentation. Waste to Worth: Spreading Science and Solutions. Cary, NC. April 18-21, 2017. URL of this page. Accessed on: today’s date.

Elimination of Equine Streptococci from Soiled Equine Bedding


Proceedings Home W2W Home w2w17 logo

Purpose            

Streptococcus equi subspecies equi (S. equi), causes the potentially fatal respiratory disease in horses known as “strangles”, while the closely related Streptococcus equi subspecies zooepidemicus (S. zooepidemicus) causes potentially fatal infections in humans. A study was undertaken to determine the survival of these 2 organisms in compost and soiled bedding.

What did we do? 

Dacron bags were filled with a feedstock mixture of soiled equine bedding and feed waste at ratios of 3:1 (C:N ratio 40.6), 1:1 (C:N ratio 31.9), and 1:4 (C:N ratio 25.4). The Dacron bags were inoculated with S. zooepidemicus, and placed in 3 compost windrows of the same 3 feedstock ratios 24 h later. Streptococci were quantified at different time points. Next, S. equi was inoculated into Dacron bags then placed into a compost windrow of the same feedstock ratio. Streptococci were quantified. To rule out killing of both Streptococcal species by microflora during the 24 h storage period, samples of soiled equine bedding, both autoclaved and non-autoclaved, were inoculated with S. zooepidemicus and periodically sampled. A repeated study was conducted with S. equi. To determine the role of moisture on the killing of S. equi in equine waste, soiled equine bedding was dried at 37 °C for 48 h and sterile water then added to dried bedding.

What have we learned?             

Microbes in soiled equine bedding may eliminate Streptococci, indicating that normal compost microflora may provide sustainable methods for the control of human and animal pathogens.

Future Plans    

Future studies could assess the role of individual bacterial species in the abatement of Streptococci, and possible additives to a compost pile which might increase numbers of streptocidal organisms. In addition, compost could be examined to discover novel antibiotics or bacteriophages which may be used for disease control.

Corresponding author, title, and affiliation        

Alexandria Garcia, Graduate Student, University of Maine

Corresponding author email    

Alexandria.poulin@gmail.com

Other authors   

Dr. Robert Causey, Associate Professor at University of Maine, Scott Mitchell, Student, Kathleen Harvey, Student, Ashley Myer, Student, Mark Hutchison, Extension Professor, and Martin Stokes, Professor

Additional information               

Garcia, Alexandria, “Abatement of Streptococcus equi in Equine Compost” (2016). Electronic Theses and Dissertations. 2435.

http://digitalcommons.library.umaine.edu/etd/2435

Acknowledgements       

Maine Agricultural Center, Dr. M. Susan Erich, Mark Hutchinson


The authors are solely responsible for the content of these proceedings. The technical information does not necessarily reflect the official position of the sponsoring agencies or institutions represented by planning committee members, and inclusion and distribution herein does not constitute an endorsement of views expressed by the same. Printed materials included herein are not refereed publications. Citations should appear as follows. EXAMPLE: Authors. 2017. Title of presentation. Waste to Worth: Spreading Science and Solutions. Cary, NC. April 18-21, 2017. URL of this page. Accessed on: today’s date.

Methods for Regulating Dry Matter Intake in Grazing Horses


Proceedings Home W2W Home w2w17 logo

Purpose 

Pasture dry matter intake of many horses (e.g., mature idle horses) exceeds that necessary to provide daily energy requirements creating an inefficiency. One strategy for regulating pasture intake is to restrict the herbage mass (HM) available for grazing by “pre-grazing” with horses having higher nutrient requirements (e.g., work, growth, lactation), or an entirely different species (e.g., cattle, sheep or goats) using a “leader-follower” rotational grazing system. Another strategy for regulating pasture intake is to restrict the time allowed for grazing. Both methods have the potential to improve the efficiency of pasture use by preventing over-consumption.

What did we do? 

Two experiments were conducted to evaluate the effectiveness of regulating pasture intake by: 1) restricting HM available for grazing, or 2) restricting time allowed for grazing. In the first experiment six mature geldings were assigned to a HIGH (n=3) or LOW (n=3) density HM pasture (0.37 ha) for a 7 d. Treatments were reversed and carried out for an additional 7 d. The LOW pasture HM was achieved by mowing to a predetermined sward height that yielded a target HM. Mowing was used to achieve the target HM, instead of “leader-follower” rotational grazing, in order to accurately obtain the desired target HM. Herbage mass of each grazing cell was estimated using a weighted falling plate meter according to Vibart et al. (1). Body weight (BW) was measured on d-0 and 7 and changes in BW were used to reflect differences in DM intake between treatments. Mean HM available at the start of grazing was 876 and 2180 ± 76 kg DM/ha, for LOW and HIGH, respectively (Treatment P < .001), and corresponds to approximately 11 and 27 kg DM•d^-1•hd^-1 available for grazing, for LOW and HIGH, respectively, assuming a grazing efficiency of 70%. Herbage mass density decreased from d-1 to 7 (Treatment x Day; P < 0.001) by 148 and 771 ± 105 kg DM/ha for LOW and HIGH, respectively. The magnitude of BW change tended (P = .06) to be greater for LOW (-11.5 ± 3.9 kg) than HIGH (3.3 ± 3.9). The tendency for BW loss in LOW was likely a function of decreased intake leading to decreased gut fill, as opposed to a body tissue loss, given the estimated initial HM for LOW was more than adequate to meet energy requirements of all 3 horses over the 7-d period (i.e., approximately 11 kg DM•d^-1•hd^-1) (3). The greater HM reduction in HIGH, as compared to LOW, suggests horses in HIGH consumed more forage than required to meet maintenance energy requirements (e.g., potentially 14 kg DM/d), and! represen ts inefficient use of pasture.

A second experiment using eight mature geldings maintained in a single pasture (1.5 ha) and containing approximately 3,000 kg DM/ha was conducted to determine the effect of restricting time available for grazing on pasture DM intake. Horses were randomly assigned to either continuous grazing (CG; n=4) or restricted grazing (RG; n=4) for 14 d. Horses in the RG group were muzzled to prevent grazing from 1600 to 800 the following day, but otherwise allowed to graze freely. Body weight was measured on d-0, 7 and 14. Differences in body weight between treatments were used as an indicator of differences in pasture DM intake. Body weight was not different between treatments on d-0, however BW increased from d-0 to 7 for CG (22 ± 6.6 kg; P < .01), and decreased over the same period for RG (-19 ± 6.6 kg; P < .01). The gain in BW along with the initial 3,000 kg DM/ha available for grazing (approximately 28 kg DM•d-1•hd-1) suggests CG consumed DM well above that required for meeting maintenance energy requirements; whereas the loss of BW in RG suggests reduced DM intake as compared to CG. A longer term study is necessary to determine if BW change observed for RG stabilizes or continues on a downward trajectory, indicating restriction was too severe.

1. Vibart RE, White-Bennet SL, Green JT, Washburn SP. Visual assessment versus compressed sward heights as predictors of forage biomass in cool-season pastures. J Dairy Sci. 2004;87:36.

2. Walker GA. Common Statistical Methods for Clinical Research. Vol. 2nd. Cary, NC: SAS Institute, Inc; 2002.

3. NRC. Nutrient Requirements of Horses: Sixth Revised Edition. Washington, D.C.: The National Academies Press; 2007. 360 p.

What have we learned?        

The results of both experiments suggest that: 1) Mature idle horses, continuously grazing abundant pasture, consume more DM than is necessary to meet daily energy requirements representing inefficiency, 2) restriction of either herbage mass available for grazing, or time available for grazing can be developed as tools to regulate pasture DM intake of grazing horses, and ultimately enhance efficiency of pasture use.

Future Plans    

Future plans include designing experiments to refine both restriction of herbage mass available for grazing, and time available for grazing as practical methods for improving the efficiency of feeding horses on pasture.

Corresponding author, title, and affiliation        

Paul D. Siciliano, Professor, North Carolina State University

Corresponding author email  

Paul_Siciliano@ncsu.edu

Other authors   

Morghan A. Bowman, Graduate Research Assistant, North Carolina State University

Additional information              

Glunk, E.C., Pratt-Phillips, SE and Siciliano, P.D. 2013. Effect of restricted pasture access on pasture dry matter intake rate, dietary energy intake and fecal pH in horses. J. of Equine Vet. Sci. 33(6):421-426.

Dowler, L.E., Siciliano, P.D., Pratt-Phillips, S.E., and Poore, M. 2012. Determination of pasture dry matter intake rates in different seasons and their application in grazing management. J. Equine Vet. Sci. 32(2):85-92.

Siciliano, P.D. and S. Schmitt. 2012. Effect of restricted grazing on hindgut pH and fluid balance. J. Equine Vet. Sci. 32(9):558-561.

Acknowledgements       

This project was supported by the North Carolina Agricultural Research Service.

The authors are solely responsible for the content of these proceedings. The technical information does not necessarily reflect the official position of the sponsoring agencies or institutions represented by planning committee members, and inclusion and distribution herein does not constitute an endorsement of views expressed by the same. Printed materials included herein are not refereed publications. Citations should appear as follows. EXAMPLE: Authors. 2017. Title of presentation. Waste to Worth: Spreading Science and Solutions. Cary, NC. April 18-21, 2017. URL of this page. Accessed on: today’s date.

Pennsylvania Horse Farm’s Whole Farm Balance Inputs of Nitrogen and Phosphorus

Proceedings Home W2W Home w2w17 logo

Purpose

In Pennsylvania there has been an increased emphasis on farm and nutrient management practices on equine operations due to expansion of environmental regulations. Of the 31,000 operations which house horses in Pennsylvania, 23,250 are non-commercial operations and over 75 percent are on limited acreage, requiring intensive management. Managers of equine operations frequently do not have agricultural backgrounds and need assistance with farm management plans. Proper management of equine operations requires a series of complementing Best Management Practices (BMPs) that implement strategies to preserve pasture vegetative cover, to balance nutrient production with nutrient utilization, to properly manage excess manure nutrients, and to manage equine operations for minimal release of sediment.

This environmental program was developed to identify needed BMPs for the equine industry and help farm mangers understand, select, and implement sustainable farm management practices. The program consisted of three components: Documentation of existing practices and conditions on equine operations, educational outreach to increase knowledge and skills, and on-farm implementation of BMPs. These three projects covering 2009-2015, measured sediment and nutrient losses, for high density horse operations; and recorded environmentally sound farm management practices.

What did we do?

Swinker in pasture
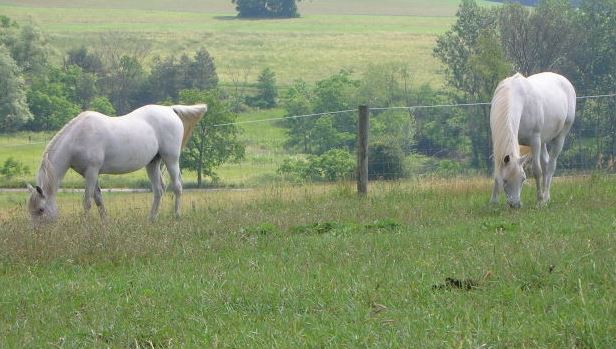
Project 1- documented conservation and farm management practices on 23 equine operations, quantitatively evaluated pasture desirable plants and canopy cover, sampled feed, hay and soil, and conducted nutrient management audits. Pasture data, collected using line point transect methodology, included calculation of percent canopy cover, basal stems and desirable forage. The 23 surveyed operations were used to develop a baseline for total nutrient balances and levels for the Pennsylvania horse industry.

Project 2- looked at nitrogen and phosphorus inputs on 14 farms to determine the risk of horse farms for non-point source pollution. Over a 12 months period, amounts of imported fertilizer, hay, concentrate feed, and bedding were obtained from farm managers. Samples of hay, concentrate feed, and bedding were taken from each farm and analyzed for N and P. Whole farm nutrient balance was calculated as a percent by the equation ((imported nutrients- exported nutrients) /imported nutrients) X 100. Nitrogen and P whole farm balances were recorded as a percentage basis for the total farm and on a kilogram basis for per animal unit and per hectare values. PROC SURVEYMEANS was used to determine descriptive statistics on the sample and whole farm balance values.

Project 3- involved 95 farm operations (1,086.90 ac.) in a project designed to implement practices to increase canopy cover and desirable forages in pastures and reduce nutrient and sediment loss. The team provided individual assistance to help owners locate resources, technical assistance and funding. All farm managers (n=95) farms were visited documenting conservation/management practices, BMPs already in place and identification of areas of concern/improvement needs. The team finalized field farm survey instruments, quantitatively documented pasture plants/canopy cover, sampled feed/hay/soil, and conducted nutrient management audits. Pasture data was collected using line point intercept and Equine Pasture Evaluation Disc methodology. All plant species were documented with pasture condition scores generated using pasture condition score sheets.

Out of the 95 farms visited, a total of 43 farm (744.55 ac. collectively), pastures were targeted for improvement, soil tested and prepared for methods to improve the pasture grass stands. Farms selected to reseed pastures were provided with a seed mix that was custom blended for their farm based on soil conditions, farm management, pasture needs and level of use.

Twenty-seven of the farms conducted reseeding using a no-till drill, 8 farms utilized conventional plowing and 8 farms utilized broadcasting and/or frost seeding. The remaining 48 farms did not need to reseed and instead received recommendations on methods to improve and manage existing forage quality through improving or utilizing BMPs. Four farms did not continue involvement in the program after the initial farm visit by the team.Picture of two horse in a pasture

What have we learned?

Project 1- The surveyed farms have helped to validate and evaluate existing tools on horse operations. The “pasture sediment loss” tools used (at that time) in this project (PA RUSLE2, Pasture Condition Score, Nutrient Balancing, Pasture Nutrient Balancing sheets and PA Phosphorous-Index) helped to analyze the cost-effectiveness and sustainability of the nutrient reduction strategies. The survey results have shown that these selected tools need to be adjusted in order to properly measure sediment and soil loses on horse farms.

Smaller farm operators reported a major hurdle to managing pastures is lack of knowledge and lack of equipment. In addition, 33% of farm managers reported they wanted to utilize the suggested practices, but required financial assistance or more technical information.

Results of the information gathered by the Equine Environmental Stewardship (EES) team projects has been used and examined by state agencies, assisting in development of in-service training for their personnel, used in revising potential regulations and assistance concerning horse farm operations.

Study 2- The majority of the horses on the farms were non-breeding horses, which the only managed output was manure. Four of the farms did not export any manure, 3 exported a small portion of their collected manure and 6 exported all their collected manure. Whole farm balance inputs averaged 53 kg N per 1000 lbs of animal (AU) and 13 kg P/AU. Whole farm balances ranged from 100% retention of imported nutrients where no products were exported to a negative balance where all collected manure was exported. Average N and P whole farm balances were 73% and 51% retention of inputs, respectively. With limited export of nutrients from horse farms as foals or manure, more manure must be exported and/or nutrient imports must be decreased to approach nutrient balance and decrease the risk of nutrient pollution.

Project 3- Out of the 95 farms visited, a total of 43 farms (representing 744.5 acres) were reseeded. Twenty farms needed to utilize the no-till drill purchased through the project grant. Pastures chosen for reseeding had low forage yields and canopy covers less than 50%. After reseeding the pastures, yields increased to 1.0 to 2.0 tons per acre resulting in an economic gain that averaged $450 to $600 per acre.

In conclusion: The Team noted that farm owners are committed to adopting practices that maintain healthy horses, healthy farms, and a healthy environment. Each of the farms listed worked with the Equine Team to select and implement one or more Best Management Practices (BMPs) on their farm. BMP’s were chosen to increase pasture canopy cover and improve pasture quality, proper composting and or disposal of manure, and ration formulation. Practicing rotational grazing, utilizing sacrifice areas, soil testing and applying lime and fertilizers are BMPs farmers were encouraged to adopt.

Future Plans

The survey results are being used in the development of the curriculum for Environmental Stewardship short courses, to help agency personnel understand the equine industry and to help farm owners develop the knowledge and skills necessary to adopt environmentally sound farm management practices.

Corresponding author, title, and affiliation

Ann Swinker, Extension Horse Specialist, Pennsylvania State University

Corresponding author email

aswinker@gmail.com

Additional information

Ann Swinker

Penn State University

324 Henning Building

Department of Animal Science

University Park, PA 16802

814-865-7810

FAX: 814-865-7442

E-mail: aswinker@psu.edu

Bott, R., Greene, E., Trottier, N., Willliams, C., Westendorf, M., Swinker N., Mastellar, S., Martinson, K., Environmental implications of nitrogen output on horse operations: A review, Journal of Equine Veterinary Science 08/2015; DOI:10.1016/j.jevs.2015.

Swinker, A., D. Foulk, H. McKernan , Environmentally Friendly Farm Program Recognizes Pennsylvania Farms that Adopt Sound Management Practices Protecting Water Quality and the Environment, Waste to Worth, Seattle WA, March 31 – April 3, 2015.

USDA, CIG Grant Final Report: Pennsylvania Small Farm Environmental Stewardship Program: Implementing Conservation Practices on Small Farms and Using Environmental, Agreement Number: 69-3A75-11-180. 56 pages.

Swinker, A. M., Northeast Regional USDA CRIS Report, September 2013, USDA Regional Project, NE-1041 – Environmental Impacts of Equine Operations, https://projects.sare.org/sare_project/lne10-303/

PSU DAS web site; http://www.das.psu.edu/research-extension/equine/adult-education Environmental stewardship Project and Equine Science Newsletter websites

Acknowledgements

USDA Natural Resource Conservation Service Conservation Innovation Grant and SARE Grant for funding this project. USDA Regional Project, NE-1041, All the hard work of the PSU Extension Equine Team

The authors are solely responsible for the content of these proceedings. The technical information does not necessarily reflect the official position of the sponsoring agencies or institutions represented by planning committee members, and inclusion and distribution herein does not constitute an endorsement of views expressed by the same. Printed materials included herein are not refereed publications. Citations should appear as follows. EXAMPLE: Authors. 2017. Title of presentation. Waste to Worth: Spreading Science and Solutions. Cary, NC. April 18-21, 2017. URL of this page. Accessed on: today’s date.