Evaluating the Impact of Ammonia Emissions from Equine Operations on the Environment


Proceedings Home W2W Home w2w17 logo

Purpose 

In the United States, animal agriculture is the largest source of ammonia (NH3) emissions that are a major air and water pollutant contributing to eutrophication, soil acidity, and aerosol formation that can impair atmospheric visibility and human health. Ammonia volatilization occurs when excess crude protein (CP) is fed and excreted as urinary nitrogen, primarily as urea. Information regarding NH3 emissions from equine operations is limited. It is generally understood that air quality in stables can adversely affect both horse and human health, however, the effects of different housing systems and nutritional management of horses on air quality have received little investigation.

What did we do? 

In the first study, 9 mature horses were used in a 3 X 3 replicated Latin square design study to determine the effects of dietary CP concentrations on potential NH3 losses from feces and urine. Horses were fed 3 diets formulated using bahiagrass and Tifton-85 bermudagrass hays and a commercial vitamin mineral supplement. The 3 diets differed in dietary CP concentration and were labelled as: LOW-CP, MED-CP, and HIGH-CP (10.6, 11.5 and 12%, respectively). Total collection of feces and urine was conducted over 3 days. For in-vitro determination of NH3 concentrations, urine samples were pooled and mixed with either wheat straw or wood shavings, while fecal samples were pooled and mixed with wheat straw. Ammonia emission by these samples was measured using a vessel emission system with an airflow rate (2.5 L min-1) at 20°C over a 7-d period. Concentration of NH3 in each vessel was measured using a photoacoustic multi-gas analyzer. Temperature, airflow rate and NH3 concentration in each vessel were used to calculate NH3 emission rate (ER).

The objective of the second study was to determine air emissions from 4 Mid-Atlantic equine operations as affected by housing type and feeding practices. A questionnaire was administered to respective farm managers to record facility and individual stall dimensions, daily cleaning practices, and feeding practices. Farm A was a University riding stable, Farm B was a University breeding farm, Farm C was a racehorse training facility, and Farm D was a Standardbred breeding facility. At least 4 stalls were chosen in each facility based upon location within barn to quantify NH3 concentrations. Body weight, breed, age, class of horse, exercise schedule, and time spent in the stall were recorded for the horses in the selected stalls. For analysis of NH3 concentration, air samples were collected from stall floors using a dynamic flux chamber and concentrations measured using a photoacoustic NH3 analyzer. To achieve a representation of NH3 emitted from stall surfaces, 5 locations were selected and measurements taken at approximately the same time each day. Temperature, airflow rate and a weighted concentration of NH3 in the flux chamber were used to calculate NH3 emissions.


Figure 1 Cumulative ammonia emissions rate of urine when mixed with A) shavings and B) straw and incubated

Figure 2. Daily ammonia emissions per horse over 3 days using the flux chamber system on 4 horse operations

What have we learned? 

When measuring NH3 concentrations and calculating the ER in-vitro, urinary-N was the main source of NH3 volatilized from equine manure, potentially due to the high urea-N concentration in the urine. Cumulative fecal NH3 emissions ranged from 19.7 to 39.8 mg/m2 and contributed only a small amount in comparison to the NH3 lost from urine. While dietary CP intake did not influence NH3 emissions, cumulative emissions tended to be higher when horses consumed more CP. Urinary NH3 emissions were greater when mixed with wheat straw compared to wood shavings. This study shows there may be a relationship between dietary CP intake and potential NH3 losses from equine urine under laboratory conditions. When estimating NH3 emissions on the 4 equine operations, greater dietary CP intake was associated with increased urinary NH3 volatilization. Daily CP intake ranged from 149-211 % above NRC CP requirement. Estimated NH3 emissions from facilities ranged from 18.5 to 124 g d-1 horse-1 and were similar to emissions previously reported from other large livestock species. Differences in NH3 emissions could be due to several factors including cleaning practices and ventilation rate. These studies provide a better understanding of the impact equine operations are having on atmospheric NH3 levels.

Future Plans    

Future research will aim to quantify NH3 emissions from entire equine operations as well as accounting for diurnal, seasonal and regional fluxes in NH3. In addition, there is interest to determine how protein quality will affect NH3 emissions from horse urine.

Corresponding author, title, and affiliation        

Jessie Weir, University of Florida

Corresponding author email   

jessie23@ufl.edu

Other authors   

Hong Li, Assistant Professor, University of Delaware; Lori K. Warren, Associate Professor, University of Florida; Erica Macon, Graduate Student, Middle Tennessee State University; Carissa Wickens, Extension Equine Specialist, University of Florida

Additional information               

Additional information regarding these projects is available by contacting Jessie Weir (jessie23@ufl.edu), or Carissa Wickens (cwickens@ufl.edu). 

The authors are solely responsible for the content of these proceedings. The technical information does not necessarily reflect the official position of the sponsoring agencies or institutions represented by planning committee members, and inclusion and distribution herein does not constitute an endorsement of views expressed by the same. Printed materials included herein are not refereed publications. Citations should appear as follows. EXAMPLE: Authors. 2017. Title of presentation. Waste to Worth: Spreading Science and Solutions. Cary, NC. April 18-21, 2017. URL of this page. Accessed on: today’s date.

Developing a Comprehensive Nutrient Management Plan (CNMP)

Proceedings Home W2W Home w2w17 logo

Purpose

Livestock producers are presented with a number of challenges and opportunities. Developing a quality Comprehensive Nutrient Management Plan (CNMP) can effectively help landowners address natural resource concerns related to soil erosion, water quality, and air quality from manure management. As livestock operations continue to expand and concentrate in certain parts of the country, utilizing a CNMP becomes even more important. Following the NRCS 9-step planning process is critical in developing a good plan. Effective communication is a key element between all parties involved in the planning process. A CNMP documents the decisions made by the landowner for the farmstead area, crop and pasture area, and nutrient management. Information will cover the elements essential for developing a quality CNMP.

What did we do?

Since the CNMP documents the records of decisions by the landowner, it has to be organized in such a fashion that it is understandable to and usable by the landowner. The CNMP is the landowner’s plan. Therefore, the role of the planner is to help landowners do the things that will most benefit them and the resources in the long run. This will take both time and effort. To provide consistency with other conservation planning efforts within NRCS, CNMPs following the same process outlined in the National Planning Procedures Handbook. There are several items that are essential for a quality CNMP to be developed:

• Have a good understanding of potential resource concerns especially soil erosion, water quality and air quality.

• Make the appropriate number of site visits. Trying to do this from the office will likely lead to a poor quality CNMP that may not be implemented.

• Address resource concerns for the Farmstead and Crop and Pasture areas.

• Ensure that all nutrient sources are addressed.

• Follow the 9 steps of planning.

• Decisions are agreed upon by the landowner. The CNMP reflects the landowner’s record of decisions.

• Follow-up to address any questions or concerns.

• Update as necessary. A CNMP is not a static document.

Field

Land application of animal manure without proper land treatment practices

Muddy field with standing water

Proper animal manure storage required to address water quality issues

Picture of lined water bed

Evaluation of storage area to adequately address surface and subsurface
water quality issues

Picture of tractor and tanker spreader

Land application and nutrient management are critical elements for a
properly prepared CNMP

What have we learned?

The quality of CNMPs varies greatly across the country. Some were becoming so large that landowners were having difficulty finding the activities that needed to be completed. The revised CNMP format and process following the NRCS Conservation Planning approach should improve both the quality and usability of the plans developed. Due to statutes in the Farm Bill, all conservation practices recorded in the record of decision of the CNMP, whether receiving financial assistance or not, must be implemented by the end of the established contract period between the landowner and NRCS. Therefore it is important to only include the practices that are going to be implemented. CNMPs should be periodically updated to account for operational changes such as animal numbers, cropping systems, or land application methods.

Future Plans

The CNMP planning process will be evaluated to determine whether landowner objectives are being met and resource concerns properly addressed. Additional evaluations will look at the consistency of the plans generated across the country and the usability by landowners.

Corresponding author, title, and affiliation

Jeffrey P. Porter, P.E.; National Animal Manure and Nutrient Management Team Leader, USDA-Natural Resources Conservation Service

Corresponding author email

jeffrey.porter@gnb.usda.gov

Additional information

References

USDA-NRCS General Manual – Title 190, Part 405 – Comprehensive Nutrient Management Plans

USDA-NRCS Handbooks – Title 180, Part 600 – National Planning Procedures Handbook

Code of Federal Register (CFR) Title 7, Part 1466 – Environmental Quality Incentives Program (1466.7 EQIP Plan of Operations and 1466.21 Contract Requirements)

Webinar

Comprehensive Nutrient Management Plans and the Planning Process – http://www.conservationwebinars.net/webinars/comprehensive-nutrient-management-plans-and-the-planning-process/?searchterm=cnmp

The authors are solely responsible for the content of these proceedings. The technical information does not necessarily reflect the official position of the sponsoring agencies or institutions represented by planning committee members, and inclusion and distribution herein does not constitute an endorsement of views expressed by the same. Printed materials included herein are not refereed publications. Citations should appear as follows. EXAMPLE: Authors. 2017. Title of presentation. Waste to Worth: Spreading Science and Solutions. Cary, NC. April 18-21, 2017. URL of this page. Accessed on: today’s date.

Reducing Hay Waste Associated with Outdoor Feeding of Adult Horses

Why Be Concerned with Hay Waste On Horse Farms?

Hay is commonly fed to horses and is usually the largest and most expensive dietary component for adult horses. Hay waste can occur during both storage and feeding, and can add up to ≥ 40%, depending on forage type, storage method, environment, and storage length. Horses are commonly fed large round-bales and small square-bales in outdoor paddocks; however, no research exists to characterize hay waste. The objectives were to determine hay waste and economics of small square-bale and large round-bale feeders when used in outdoor feeding of adult horses. Related: Managing Manure on Horse Farms

What did we do?

Large round- and small-square bale hay feeders were evaluated during two separate studies. photo of different bale feeders
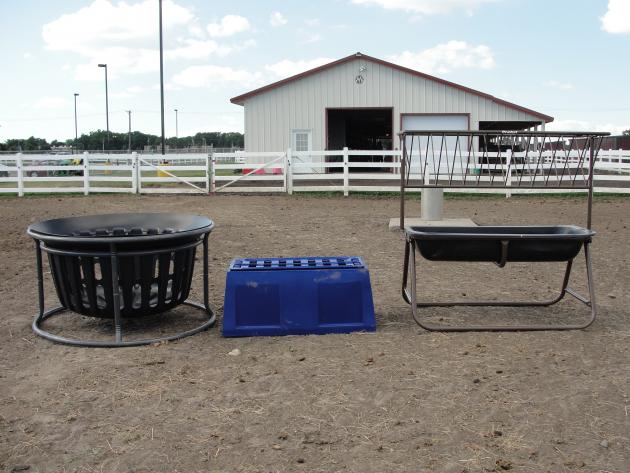
Nine round-bale feeders, were tested, including the Cinch Net ($147; Cinch Chix LLC), Cone ($1,195*; Weldy Enterprises; model R7C), Covered Cradle ($3,200; SM Iron Inc.), Hayhut ($650; Hayhuts LLS), Hay Sleigh ($425; Smith Iron Works Inc.), Ring ($300; R & C Livestock), Tombstone ($250; Dura-Built), Tombstone Saver ($650; HiQual), Waste Less ($1,450; JSI Innovations LLC), and a no-feeder control (Figure 1). Twenty-five mature horses were used to form five groups of five horses. Each feeder was placed on the ground in an outdoor dirt paddock. The groups of horses fed in rotation for four days, and every fourth day, groups were rotated to a different paddock. Waste hay (hay on the ground outside of the feeder) and orts (hay remaining inside the feeder) were collected daily. Percent hay waste was calculated as the amount of hay waste divided by the amount of hay fed minus orts. The number of months to repay the feeder cost (payback) was calculated using hay valued at $200/ton, and improved efficiency over the no-feeder control.

Three small square-bale feeders were tested, including a hayrack ($280; Horse Bunk Feeder and Hay Rack, Priefert Manufacturing), slat feeder ($349; The Natural Feeder), basket feeder ($372; Equine Hay Basket, Tarter Farm and Ranch Equipment), and a no-feeder control (Figure 1). Two feeders of each type were placed in separate, outdoor, dirt paddocks. Twelve adult horses were divided into four similar herds of three horses each and were rotated through the four paddocks, remaining in each paddock for a period of seven days. Grass hay was fed at 2.5% of the herd bodyweight split evenly between two feedings. Waste hay (hay on the ground outside of the feeder) and orts (hay remaining inside the feeder) were collected before each feeding. Percent hay waste was calculated as the amount of hay waste divided by the amount of hay fed minus orts. The number of months to repay the feeder cost (payback) was calculated using hay valued at $200/ton, and improved efficiency over the no-feeder control.

What have we learned?

No injuries were observed from any feeder types during the data collection period.

Hay waste differed between round-bale feeder designs. Mean percent waste was: Waste Less, 5%; Cinch Net, 6%; Hayhut, 9%; Covered Cradle, 11%; Tombstone Saver, 13%; Tombstone, Cone and Ring, 19%; Hay Sleigh, 33%; and no-feeder control, 57%. All feeders reduced waste compared to the no-feeder control. Feeder design affected payback. The Cinch Net paid for itself in less than 1 month; Tombstone and Ring, 2 months; Hayhut and Tombstone Saver, 4 months; Hay Sleigh, 5 months; Waste Less, 8 months; Cone, 9 months; and Covered Cradle, 19 months.

Hay waste was different between small square-bale feeder designs. Mean hay waste was 1, 3, 5 and 13% for the slat, basket, hayrack and no-feeder control, respectively. All feeders resulted in less hay waste compared with the no-feeder control. Feeder design also affected payback. The hayrack, basket, and slat feeders paid for themselves in 11, 10, and 9 months, respectively.

Future Plans

Future research investigating hay waste associated with outdoor feeding of adult horses should focus on different forage types and the optimum number of horses per feeder. Related: Small Farm Environmental Stewardship

Authors

Krishona Martinson, Associate Professor, University of Minnesota krishona@umn.edu

Amanda Grev, Research Assistant, University of Minnesota; Emily Glunk, Assistant Professor, Montana State University; William Lazarus, Professor, University of Minnesota; Julie Wilson, Executive Director, Minnesota Board of Veterinary Medicine; and Marcia

Additional information

Grev, A.M., E.C. Glunk, M.R. Hathaway, W.F. Lazarus, and K.L. Martinson. 2014. The effect of small square-bale feeder design on hay waste and economics during outdoor feeding of adult horses. Journal of Equine Veterinary Science. 34: 1,269-1,273.

Martinson, K., J. Wilson, K. Cleary, W. Lazarus, W. Thomas and M. Hathaway. Round-bale Feeder Design Affects Hay Waste and Economics During Horse Feeding. 2012. J. Anim. Sci. 90: 1047–1055.

Acknowledgements

The large round-bale feeder research was funded by a grant from the MN Horse Council and manufacturer fees. The small-square bale feeder research was funded by a grant from the American Quarter Horse Foundation.

The authors are solely responsible for the content of these proceedings. The technical information does not necessarily reflect the official position of the sponsoring agencies or institutions represented by planning committee members, and inclusion and distribution herein does not constitute an endorsement of views expressed by the same. Printed materials included herein are not refereed publications. Citations should appear as follows. EXAMPLE: Authors. 2015. Title of presentation. Waste to Worth: Spreading Science and Solutions. Seattle, WA. March 31-April 3, 2015. URL of this page. Accessed on: today’s date.

Improving Pasture Utilization by Optimizing Horse Preference

Purpose

Differences in preference, defined as the behavioral response of an animal to plants when a choice is given, affects not only animal utilization of forage species, but forage persistence and yield if preferred species are repeatedly grazed. Horses are known to be selective grazers, when compared to other livestock. Forage yield is an important criteria when selecting grasses for productive pastures, especially for highly selective livestock like horses. The objectives of this research were to evaluate preference and yield of cool-season perennial and annual cool-season grasses while grazed by horses.

What did we do?

Research was conducted in 2010 through 2014 in St. Paul, Minnesota. Four adult stock-type horses rotationally grazed two separate experiments. Cool-season perennial grasses were planted in replicated monocultures and grazed each month during the growing season (April through October). Cool-season perennial grasses inlcuded tall fescue, meadow fescue, quackgrass, smooth bromegrass, meadow bromegrass, reed canarygrass, perennial ryegrass, timothy, Kentucky bluegrass, creeping foxtail, and orchardgrass. Cool-season annual grasses were planted each spring and fall in replicated monocultures and grazed in May and June (spring planting) and September and October (fall planting). Cool-season annual grases included winter wheat, annual ryegrass, spring barley, spring wheat, and spring oat.

Prior to grazing, grasses were measured for yield. Immediately after grazing, horse preference was determined by visually assessing percentage of forage removal on a scale of 0 (no grazing activity) to 100 (100% of vegetation grazed). Following grazing, manure was removed, and remaining forage was mowed to 3 inches and allowed to re-grow. Plots were hand-weeded, fertilized according to soil analysis and irrigated if necessary.

What have we learned?

figure 1. photo of forage growing Figure 2. photo of forage growing

Figures 1 and 2. Kentucky bluegrass, timothy (photos 1 and 2)  Left: pre-grazed timothy and right: post-grazed timothy), and meadow fescue were the most preferred perennial cool-season grasses with most grazing events removing > 60% of the forage, while meadow bromegrass, creeping foxtail, reed canarygrass, and orchardgrass were less preferred, with removals of < 50% of the forage (P ≤ 0.0027).

Kentucky bluegrass, timothy (Figures 1 and 2), and meadow fescue were the most preferred perennial cool-season grasses with most grazing events removing > 60% of the forage, while meadow bromegrass, creeping foxtail, reed canarygrass, and orchardgrass were less preferred, with removals of < 50% of the forage (P ≤ 0.0027). Quackgrass, tall fescue, perennial ryegrass, and smooth bromegrass were moderately preferred by horses. Orchardgrass produced the highest yield with ≥10.1 t/ha, while creeping foxtail, smooth bromegrass, and timothy produced the lowest yield with ≤ 8.7 t/ha (P = 0.0001). Quackgrass, perennial ryegrass, reed canarygrass and meadow bromegrass yielded moderately well.

Figure 3. photo of winter wheat growing Figure 4. photo of winter wheat after

Figures 3 and 4. Winter wheat (photos 3 and 4)  Left: pre-grazed winter wheat and right: post-grazed winter wheat) was the most preferred annual cool-season grass with a removal of 93%, while oat was least preferred with a removal of 22% (P < 0.001).

Winter wheat (Figures 3 and 4) was the most preferred annual cool-season grass with a removal of 93%, while oat was least preferred with a removal of 22% (P < 0.001). Oat and spring wheat yielded the highest with ≥ 3.91 t/ha while winter wheat yielded the least at 1.91 t/ha (P < 0.001). This information will aid owners and professionals when choosing pasture species that maximize horse preference and forage yield.

Future Plans

Future equine grazing research should focus on evaluating horse preference and yield of cool-season grass mixtures. Research should also focus on evaluating horse preference and yield of alternative forages.

Authors

Krishona Martinson, Associate Professor, University of Minnesota krishona@umn.edu

Amanda Grev, Graduate Research Assistant, University of Minnesota; Deavan Catalano Graduate Research Assistant, University of Minnesota; Michelle Schultz, Graduate Research Assistant, University of Minnesota; and Craig Sheaffer, Professor, University of Minnesota

Additional information

Allen, E., C. Sheaffer, K. Martinson. 2013. Forage Nutritive Value and Preference of Cool-Season Grasses Under Horse Grazing. Agronomy Journal. 105: 679-684.

Allen, E., C. Sheaffer, K. Martinson. 2012. Yield and Persistence of Cool-Season Grasses Under Horse Grazing. Agronomy Journal. 104: 1741–1746.

Grev, A.M., K.L. Martinson, and C.C. Sheaffer. 2014. Yield, forage nutritive value, and preferences of spring planted annual grasses under horse grazing. Journal of Animal Science. 92; pg. 34.

The authors are solely responsible for the content of these proceedings. The technical information does not necessarily reflect the official position of the sponsoring agencies or institutions represented by planning committee members, and inclusion and distribution herein does not constitute an endorsement of views expressed by the same. Printed materials included herein are not refereed publications. Citations should appear as follows. EXAMPLE: Authors. 2015. Title of presentation. Waste to Worth: Spreading Science and Solutions. Seattle, WA. March 31-April 3, 2015. URL of this page. Accessed on: today’s date.

Composted Horse Manure and Stall Bedding Pilot Project

Why Study Compost as Bedding for Horses?

The purpose of this project was to study and promote the use of compost as an alternative horse stall bedding and encourage horse owners and managers to think more creatively about manure management. Our objective was to reduce bedding use, and improve manure management practices at equine facilities in Snohomish County, Washington State.

Recreational and professional horse owners contribute to maintaining agricultural open space and supporting the agricultural infrastructure and local economy. Horse owners have historically been overlooked as contributors to animal agriculture, and as a result many horse owners lack a basic knowledge about manure and nutrient management. They are not aware of their impact on water and soil quality. Disposal of used stall bedding is costly for horse owners in northwestern Washington State, and has a potentially large impact on water quality. Disposal practices often include filling in low spots and ravines, or building massive piles. Composting manure at high temperatures eliminates pathogens and parasites, stabilizes nutrients, and reduces odors and vector attraction.

What did we do?

The Snohomish Conservation District (SCD) worked with ten commercial and two private equine facilities to test the use of compost as an alternative horse stall bedding material. Facilities ranged in size from 5 to >20 stalls. The primary system used for composting and reusing bedding involved a micro-bin composter (O2 Compost, Snohomish, WA) and a Stall Sh*fter® (Brockwood Farm, Nashville, IN). Micro-bins were assembled on-site and filled with used stall bedding (Fig.1-2).

Figure 1. Assemble compost micro-bin on site and fill with manure and beddingFigure 2. Turn on blower to provide aeration and monitor temperature

After 30 days of composting, the bin was emptied and the manure was separated from the bedding (Fig. 3). The composted bedding was then used in a stall (Fig. 4). Equine facility managers provided feedback on the effectiveness, perception, and impacts of using the compost as stall bedding. Results varied between trial sites based on type and quantity of bedding used, season, and stall management practices.

Figure 3. After 30 days of composting, empty the bin and sort the composted manure from the bedding using the Stall Sh*fter (registered trademark)

Figure 4. Use composted bedding in the stall and composted manure in the garden.

What have we learned?

Composted stall waste makes a soft absorbent bedding for horses or other livestock. Composted bedding is less dusty than shavings or wood pellets, darker in color, and has a pleasant earthy odor. There were no reports of composted bedding increasing stall odors or flies, or negatively impacting horse health. The best results were reported when mixing the composted bedding with un-composted bedding in equal proportions or two parts compost to one part bedding. There were some reports of horses with skin and respiratory conditions improving during the time they were on composted bedding, including thrush in the feet, hives and “rain rot” on the body, and “scratches” on the legs.

When separating the composted manure from the bedding, the amount and type of bedding determines the effectiveness of a bedding re-use system. Concern about appearances was more prevalent than concern about disease or parasite transfer. Even though barn managers were not entirely ready to make the switch to composted bedding, this project helped start many conversations (in person, through publications, and social media) about manure management and resource conservation. It was a great opportunity to help horse owners make the mental leap from “waste” to “resource”.

Future Plans

This project demonstrated that compost is a safe and effective horse stall bedding. Future work should be focused in three areas:

1. Developing systems for making composted bedding that are practical on a large scale and provide an economic incentive for large equine facilities to recycle their waste.

2. Outreach and education programs directed at horse owners who board their animals at commercial facilities. Would some horse owners be willing to pay a premium to board their horses at a facility that is managed in an environmentally sustainable manner?

3. Clinical trials to examine the effects of composted bedding on skin and respiratory conditions.

Author

Caitlin Price Youngquist, Agriculture Extension Educator, University of Wyoming Extension cyoungqu@uwyo.edu

Additional information

Visit http://BetterGround.org, a project of the Snohomish Conservation District.

The full report, including photographs of trial sites, is available on the Western SARE website: https://projects.sare.org/sare_project/ow11-315/

Acknowledgements

I would like to thank all of the farm owners and managers who very graciously participated in this project and were willing to try something new. The contribution of time and energy is very much appreciated.

Thanks also to the staff at O2 Compost for their efforts, ideas, and creativity. This would not have been possible without them.

And Mollie Bogardus for helping take this project to the next level, and explore all the possibilities.

The authors are solely responsible for the content of these proceedings. The technical information does not necessarily reflect the official position of the sponsoring agencies or institutions represented by planning committee members, and inclusion and distribution herein does not constitute an endorsement of views expressed by the same. Printed materials included herein are not refereed publications. Citations should appear as follows. EXAMPLE: Authors. 2015. Title of presentation. Waste to Worth: Spreading Science and Solutions. Seattle, WA. March 31-April 3, 2015. URL of this page. Accessed on: today’s date.

Existing Equine Pasture Best Management Survey Findings from NE-1441 States


Purpose

Pasture is a good source of nutrition and 94% of U.S. equine operations allow horses to access pastures [8]. Proper management of equine operations requires the adoption of Best Management Practices (BMPs) to balance nutrient production and prevent erosion. Government agencies are concerned about non-point sources of water pollution and have focused on agriculture, including equine operations, as a major contributor to water quality issues. Many states’ laws have regulated equine farms, requiring farm managers to incorporate BMPs. Best Management Practice utilization on horse farms needs to be quantified before regulations are adopted. The objectives of these various states’ surveys were to quantify and assess the use of the equine industry’s BMPs in pasture management and erosion control and to examine potential environmental impacts. The object of this abstract is to compare and look for some similarities in the ways horse farms are managed to mitigate negative environmental impacts. Few studies have investigated horse BMPs in the regions. More research is needed to assess the effect of horse farm management on the nation’s water quality.

What did we do?

Over the past five years, state university extension equine specialist participating on the NE-1441: Environmental Impacts of Equine Operations, multi-state project, have conducted surveys of their state equine industry. Many of the state surveys were conducted to quantify and assess the use of the equine industry’s BMPs in pasture management and erosion control and to examine potential environmental impacts.

In all cases a written survey instrument was developed and the questions were reviewed by experts in the field for content and face validity. Some of the surveys used the multiple waves, (postage) mailing techniques, while some used online survey mailings, and others used an SRS clicker feedback style quiz during a program or event [1,3,7,10]. Several states developed a large list of names and email addresses consisting of horse owners/farm managers from within their state. All used follow-up reminders sent to non-responding addresses to increase return rates. All of the state’s surveys analyzed the data for descriptive statistics. Frequencies and percentages were determined for all surveys. Cross tabulations were used to determine the relationship between management practices and farm management demographics. There is difficulty in comparing the different surveys because they are all different in methodology and in the way they were conducted and analyzed.

What have we learned?

Size and scope of the equine industry-

The New Jersey equine industry consists of 7,200 horse farms with 29% having 8 or more horses. In NJ more than 50% of the farms had 5 or fewer horses and 56% of the farms had 4.05 hectors (10 ac) or less and 18.6% had more than 8.09 ha. [10] The Maryland Equine Industry consists of 87,000 horses located on 20,200 operations, averaging 11.6 ha of pasture [3].  The Pennsylvania study averaged housing 13.4 horses on 21 ha (52.7 ac) of pasture and has 32,000 operations [7].  The Tennessee study reported the average herd size of 5, with 25.6 ac designated for pasture [6]. Forty-two percent of Vermont’s horse operation house over 9 horses on 25 ac of land.

Methods horse farms used to manage pasture quality-

Results of a Pennsylvania horse farm survey showed, that during the growing season, as many as 65% reported using a rotational pasture system and 25% continuously grazing horses [7].  A Maryland survey found that only 30% of horse farm operators used rotational grazing on their farms [3].  In a Tennessee survey, continuous grazing was practiced by 51.5% of respondents. Only 23.8% of TN respondents allowed pasture to recover to a recommended grazing height and 45.3% reported sometimes resting pastures [6].  The New Jersey survey reported 54% practicing some form of rotational grazing [9].  A study conducted on farms in Minnesota and Wisconsin revealed farms had an average stocking density of 1.75 acres per horse [1].  Designated sacrifice lots were present on 84% of farms, while the average ground cover was 88% in NJ [10]. The PA study, reported 23.8% allowed pasture to recover to a recommended grazing height and 45.3% reported sometimes resting pastures. Most respondents, 75.4% assessed their pasture vegetative cover at 80% or better, and 5% reported poor vegetative cover [7].

Methods horse farms used to manage soil and weeds-

Pasture weed problems were reported to be a major issue by 78.1% of TN owners. Half of TN farm operators (49.8%) indicated they have never performed soil fertility tests [6]. While in NJ, 31% of horse farms indicated they soil test [10]. PA horse farm operators (49.8%) indicated they have never performed soil fertility tests on their pastures, with only 25.4% testing soil every 1-3 yrs [7].  In the NJ survey 89% reported mowing pastures [10].

Methods horse farms used to manage manure-

The PA survey reported that farms composting and using compost on the farm (34.1%), hauled off the farm fresh (10.9%), spread fresh on crop/pasture fields daily (10.6%), composted and hauled off farm (7.7%), horses pastured 24 hr/d with manure harrowed or removed (16.4%), horses pastured 24 hr/d with manure never managed (7.1%) [7]. New Jersey farms, 54% indicated they spread manure on their farmland, and 74% indicated that they have a designated area for storing manure. NJ farm with greater pasture acreage were positively correlated with having manure storage [10].  The TN survey, reported, that stall waste was stored on bare ground in uncovered piles (89.8%) and either stored indefinitely or spread regularly on pastures [6].

How do farm managers receive/obtain information-

Several studies showed, horse managers are receiving most of their educational information from publications, magazine articles and the internet [7].  Therefore, Extension needs to reach horse farm managers with what we do best, factsheets, popular press articles and meetings. In the PA survey, resources participants used for information included books, magazines, publications (79.4%), internet resources (79.1%), acquaintances (65%), agencies (60.5%), multi-media (27.8%), private businesses (15.7%), and 2% reported using none. Participants indicated that the primary limitation to them altering current management practices was finances (75%), knowledge (37.5%), regulations (13.7), and an inability to obtain services (11.7%) [7].

In a South Dakota study, 29% of participants indicated that their primary need for information was regarding horse pasture management and 12% wanted to figure out how to increase grazing for horses as a primary goal. Many new SD landowners were present at an Extension event with 38% having owned their acreage for less than 3 years, and only 19% had owned their acreages for more than 10 years [5].

Future Plans

Knowledge of the current scope and nature of equine industry management practices are important when developing regulations and laws that will govern land management on equine operations. Recently, several state environmental regulations are having a direct impact on equine operations. However, horse farms frequently manage horses on fewer acres per animal unit and have the potential to pose a significant environmental risk. A NJ study reported that the rate of spreading manure decreased on farms with over 20 horses [10].

Most states surveys data shows that many horse farms are utilizing BMPs to help reduce environmental impact. However, many of these studies determined that landowners of small acreages have little knowledge of natural resources management [2,5,7].  There are several areas, such as soil testing and the use of sacrifice loafing areas in pasture management, where educational programming and cost share funding are needed to target specific BMPs underutilized by the equine industry. Nearly all survey respondents reported having some pasture and nutrient management questions [2,5,7,10].

In order to help stable managers understand the principles of sustainable best management practices, Cooperative Extension can conduct state-wide “Environmental Stewardship Short Courses.” These educational programs need to be a comprehensive series of educational programs (face-to-face meeting or webinars) to promote adoption of best management practices on equine operations. In addition, what is really needed is a comparative surveys instrument that can be used nation-wide to quantify and assess the use of the equine industry’s BMPs on horse farms.

Authors

Ann Swinker, Extension Horse Specialist, Pennsylvania State University aswinker@psu.edu

Betsy Greene, Extension Equine Specialist, University of Vermont

Amy Burk, Extension Horse Specialist, University of Maryland

Rebecca Bott, Extension Equine Specialist, South Dakota State University

Bridget McIntosh, Extension Equine Specialist, Virginia

Additional information

  1. Earing J, Allen E, Shaeffer CC, Lamb JA, Martinson KL. Best Management Practices on Horse Farms in Minnesota and Wisconsin. J Anim. Sci. 2012; 90:52.
  2. Fiorellino, N., McGrath , J., Momen, B., Kariuki, S., Calkins, M., Burk, A., 2014. Use of Best Management Practices and Pasture and Soil Quality on Maryland Horse Farms, J. Eq. Vet. Sci. 34:2, 257-264.
  3. Fiorellino, N.M., K.M. Wilson, and A.O. Burk. 2013. Characterizing the use of environmentally friendly pasture management practices by horse farm operators in Maryland. J. Soil Water Conserv. 68:34-40.
  4. Henning J, Lacefield G, Rasnake M, Burris R, Johns J, et al. Rotational grazing. University of Kentucky, Cooperative Extension Service 2000; (IS-143).
  5. Hubert, M., Bott, R.C., Gates, R.N., Nester, P.L., May 2013. Development and Branding of Educational Programs to Meet the Needs of Small Acreage Owners in South Dakota, J. of NACAA. 6:1, 2158-9429.
  6. McIntosh, B. and S. Hawkins, Trends in Equine Farm Management and Conservation Practices ASAS, Phoenix, AZ. 2/13/12.
  7. Swinker, A., S. Worobey, H. McKernan, R. Meinen, D. Kniffen, D. Foulk, M. Hall, J. Weld, F. Schneider, A. Burk, M. Brubaker, 2013, Profile of the Equine Industry’s Environmental, Best Management Practices and Variations in Pennsylvania, J. of NACAA. 6:1, 2158-9429.
  8. USDA: Aphis” VS, (1998). National Animal Health System, Highlights of Equine: part III, p. 4.
  9. Westendorf, M. L., T. Joshua, S. J. Komar, C. Williams, and R. Govindasamy. 2010. Manure Management Practices on New Jersey Equine Farms. Prof. Anim. Sci. 26:123-129.
  10. Westendorf, M. L., P. Venkata, C. Williams, J. Trpu and R. Govindasamy. 2012. Dietary and Manure Management Practices on Equine Farms in Two New Jersey Watersheds, Eq. Vet. Sci. 33:8,601-606.

Acknowledgements

The State University Extension Equine Specialist that make up the NE-1441: Environmental Impacts of Equine Operations, Multi-State Program. USDA, NRCS-CIG grant for funding the Pennsylvania project.

The authors are solely responsible for the content of these proceedings. The technical information does not necessarily reflect the official position of the sponsoring agencies or institutions represented by planning committee members, and inclusion and distribution herein does not constitute an endorsement of views expressed by the same. Printed materials included herein are not refereed publications. Citations should appear as follows. EXAMPLE: Authors. 2015. Title of presentation. Waste to Worth: Spreading Science and Solutions. Seattle, WA. March 31-April 3, 2015. URL of this page. Accessed on: today’s date.

Environmental Management on Equine Farms or the Good, the Bad, and the Ugly

Why Look at Environmental Practices of Horse Farms?

Equine farms are often small acreages that may not have ready access to technologies and information appropriate to their farms. Westendorf et al. (2010a) found that many equine farmers use extension services less than other sources of information, but they may use feed stores or neighbors for information (Table 1); Marriott et al. (2012) also found a limited understanding of available conservation resources among equine farmers. Best Management Practice (BMP) adoption on equine farms is the focus of this paper.

Related: Managing Manure on Horse Farms

Table 1. Manure management information sources on equine farms (Total Respondents – 442)

Another Horse Farmer Trade Magazines Cooperative Extension Other Feed Dealer Internet Other Retailer
221 183 229 116 97 89 26

Westendorf et al. (2010a,b)

What did we do?

Equine farms generally dry stack their waste; in a NJ survey (Westendorf, et al. 2010b) over 70% of farms indicate storing manure on farm, many of these sites may lack BMP’s appropriate for a storage (Table 2, 3). Eighty-three percent in this survey had manure storages located greater than 61m from water or wetlands, and 86% had storages located greater than 61m from neighbors; this might indicate their storage does not pose a significant water quality or nuisance risk. Fiorellino et al. (2010) found that even with low levels of BMP adoption, most equine farms had a reduced water quality risk. Over 50% of NJ farmers indicate that they compost manure, but it is my observation that few actually do; the definition of compost may vary from mature compost to rotting decomposition. Seventy-five percent of farms bed with wood shavings, 25% with straw and the remainder with a combination of wood chips, wood pellets, and paper.

Table 2.  Percentage of New Jersey equine survey farms implementing various management practices (%)

Spread manure on farm
Manure storage area
Compost horse manure
Off-farm manure disposal
Maintain and use dry lot areas
Credit manure as a fertilizer
Regular soil tests
Drag pastures regularly
Clean stalls daily
Manure storage <50 ft. from water
Manure storage >200 ft. from water
Manure storage <50gt. from neighbor
Manure storage >200 ft. from neighbor
54
74
47
58
47
39
32
75
70
1.1
83.2
1.1
86.4

Westendorf, et al. (2010b)


Table 3. Percentage of equine survey farms spreading or storing manure (%)

No. of horses Spread Manure (n = 442) Manure Storage (n = 434)
1 to 2 55.2 65.3
3 to 5 59.2 62.9
6 to 10 55.3 80.7
11 to 20 50.0 87.9
21 to 40 37.8 94.4
> 40 37.5 93.3

Westendorf, et al. (2010b)

Nearly 60% of horse farms dispose of some manure off the farm; for use as fertilizer, to a centralized composter, on-farm compost for sale, or to be given away are the prime means of disposal; unfortunately some is removed by dumpster. Fifty-four percent spread some manure on-farm, of these only 39% account for any fertilizer value. If we trust the survey, then probably only 20-25% of the farms have an understanding of the fertilizer value of manure; this survey did find a positive correlation between manure spreading and soil testing (P<.05), suggesting some understanding of soil fertility basics.

Fifty-three percent of farms had a sacrifice or exercise lot that provides horses an area for eating, drinking, shelter, and relaxing if needed. A sacrifice area can help to protect pasture and grazing areas. Many farms only have a turnout lot for both exercise and grazing; this can result in greater mud accumulation and other possible water quality concerns.

A feed management survey (Westendorf, et al. 2013) was sent to 500 NJ equine farmers (see Table 4). Forty-five percent received feeding and nutrition information from a feed store, 20% from a veterinarian, only 3% from a professional consultant and 2% from extension. Most farmers had no concept of feeding to reduce excretion of nutrients such as phosphorus. Monitoring intake, cleaning feed bunks and contaminated lots regularly, and disposing all waste feed in the manure storage are good recommendations for all producers. Please see the Williams et al. (2015) abstract in the poster session for more information about an on-farm feeding project.

Table 4. Description of how feeding decisions are made (%)

Balance diets on your own Veterinarian advice No plan at all Feed store advice Consulting nutritionist Extension advice
45 20.5 15 14.5 3 2

Westendorf, et al. 2013

What have we learned?

In summary: 1. Many horse farms dispose some or all manure off-site; 2. Between 50 and 75% spread manure on crop or grazing land; 3. Most have at least a designated location for manure storage; 4. Larger farms are more likely to store manure. 5. Many farms have a low non-point source (NPS) pollution risk, but little understanding of BMP’s; and 6. Pasture management BMP’s are seldom applied.

Future Plans

Outreach should focus on the implementation of low-cost management practices that equine farmers are likely to adopt.

Author

Michael L. Westendorf, Extension Specialist in Animal Science, Rutgers, the State University of New Jersey westendorf@aesop.rutgers.edu

Reference

Fiorellino, N. M., J. M. McGrath, B. Momen, S. K. Kariuki, M. J. Calkins and A. O. Burk. 2014. Use of Best Management Practices and Pasture and Soil Quality on Maryland Horse Farms. J. Equine Vet. Sci. 34:257-264.

Marriot, J. M., A. Shober, P. Monaghan and C. Wiese. 2012. Equine Owner Knowledge and Implementations of Conservation Practices. J. of Extension. 50: Issue 5. https://archives.joe.org/joe/2012october/pdf/JOE_v50_5rb4.pdf

Westendorf, M. L., T. Joshua, S. J. Komar, C. Williams, and R. Govindasamy. 2010a. Effectiveness of Cooperative Extension Manure Management Programs. J. Equine Vet. Sci. 30:322-325.

Westendorf, M. L., T. Joshua, S. J. Komar, C. Williams, and R. Govindasamy. 2010b. Manure Management Practices on New Jersey Equine Farms. Prof. Anim. Sci. 26:123-129.

Westendorf, M. L., V. Puduri, C. Williams, T. Joshua, and R. Govindasamy. 2013. Dietary and Manure Management Practices on Equine Farms in Two New Jersey Watersheds. J. Equine Vet. Sci. 33:601-606.b

Acknowledgements

This work supported by the New Jersey State Equine Initiative, the Rutgers Equine Science Center, and the New Jersey State Department of Agriculture.

Special thanks to Troy Joshua, USDA-NASS, New Jersey for help in setting up some of the surveys.

The authors are solely responsible for the content of these proceedings. The technical information does not necessarily reflect the official position of the sponsoring agencies or institutions represented by planning committee members, and inclusion and distribution herein does not constitute an endorsement of views expressed by the same. Printed materials included herein are not refereed publications. Citations should appear as follows. EXAMPLE: Authors. 2015. Title of presentation. Waste to Worth: Spreading Science and Solutions. Seattle, WA. March 31-April 3, 2015. URL of this page. Accessed on: today’s date.

Extension Recognizes Pennsylvania Farms that Adopt Sound Management Practices Protecting Water Quality and the Environment

penn state extension environmental friendly farm signPurpose

The Environmentally Friendly Farm program was developed by Penn State Equine Extension and is designed to recognize farms that adopt environmentally sound management practices that protect water quality and the environment. The program is supported by funds from the USDA Natural Resource Conservation Service (NRCS), Conservation Innovation Grant. Strategies are employed on Environmentally Friendly Farms to maintain productive pastures, reduce soil erosion, limit nutrient runoff from animal facilities and barnyards, safely store manure, recycle nutrients, and control animal access to surface waters. Excess sediment and nutrient runoff from manure poses health threats not only to the environment, but also to animals and people. Farm managers who practice environmental stewardship maintain healthy environments for their animals, their families, and their community.

What did we do?

Farm managers can apply for the program by request a copy of the application from Penn State Equine Extension by visiting us online at http://www.extension.psu.edu/equine, emailing or calling our extension office. Second, complete the Environmentally Friendly Farm application requesting background information about the farm operation.

Next, complete the Environmentally Friendly Farm Self-Assessment Checklist. Each statement is checked “yes” if the practice is in place on the farm, “no” if the practice is not in place or “non-applicable if the statement does not pertain to the farm operation. The checklist consists of a series of statements that identify potential on-farm practices in the following areas: Environmentally Sensitive Areas, Pastures, Animal Concentration Areas, Manure Storage, and Mechanical Manure Application.

Once the paperwork has been received, a farm site visit will be scheduled. Personnel from Penn State Extension, the County Conservation District, or the Natural Resource Conservation District (NRCS) will visit farms to verify that statements made in the application and checklists are accurate. At the same time, additional information and assistance will be provided to help improve farm management and develop any necessary plans for the farm.

The farm will be recognized by the public, conservation and agricultural agencies, and other farm managers as an operation that is committed to clean water and a healthy environment. Each farm manager will receive an Environmentally Friendly Farm sign that can be displayed on the farmstead. Farms that qualify will also be given permission to use the Environmentally Friendly Farm artwork on their website, brochure, and other marketing materials. Approved farms will be listed on the Penn State Equine Extension website.

This recognition will reflect the commitment of the farm manager to environmental stewardship and can serve as a marketing tool for the farm.

What have we learned?

After personnel visited farms to verify that statements made in the application and checklists are accurate. At the same time, additional information and assistance is provided to help improve farm management and develop any necessary plans for the farm. In addition, agency personal developed a personal relationship with the farm manager. The farm managers who practice environmental stewardship maintain healthy environments for their animals, their families, and their community.

Future Plans

This program will be continued through 2016. We hope to provide additional information and assistance to help improve farm management.

Authors

Ann Swinker, Extension Horse Specialist aswinker@psu.edu

Donna Foulk, Helene McKernan, Pennsylvania State University, University Park, PA 16802

Additional information

Farms can request a copy of the application from the Penn State Extension Equine Team by visiting us online at http://www.extension.psu.edu/equine

Acknowledgements

This program was funded partly by a USDA NRCS-CIG grant.

The authors are solely responsible for the content of these proceedings. The technical information does not necessarily reflect the official position of the sponsoring agencies or institutions represented by planning committee members, and inclusion and distribution herein does not constitute an endorsement of views expressed by the same. Printed materials included herein are not refereed publications. Citations should appear as follows. EXAMPLE: Authors. 2015. Title of presentation. Waste to Worth: Spreading Science and Solutions. Seattle, WA. March 31-April 3, 2015. URL of this page. Accessed on: today’s date.

Factors Affecting Nitrous Oxide Emissions Following Subsurface Manure Application

[Abstract] Subsurface manure application is theoretically susceptible to greater denitrification losses and nitrous oxide (N2O) emissions compared to surface application methods – primarily attributed to manure being placed in a more anaerobic environment. A review of field studies suggest N2O emissions typically range from 0.1% to 3% of total applied N from subsurface application methods, but there is considerable variation in emissions depending on pre- and post-application soil moisture conditions, readily-available carbon content in manure compared to background levels in soil, localized nitrogen form and oxygen concentration at the application site, and application depth. This paper will summarize peer-reviewed literature of field studies that quantify N2O emissions subsequent to subsurface manure application and identify the most prominent determining factors cited by authors.

Why Study Nitrous Oxide Emissions of Manure?

Ammonia abatement efficiencies of up to 90 percent have been documented with subsurface application and incorporation of animal manures compared to conventional surface application methods. While reducing ammonia emissions has positive implications for air and water quality, a portion of the nitrogen conserved may come at the expense of increased nitrous oxide emissions produced during denitrification and nitrification processes in the soil. As a greenhouse gas 300 times more potent than carbon dioxide at trapping heat, nitrous oxide has been linked to anthropogenic climate change and depletion of stratospheric ozone. Release of nitrous oxide from agriculturally-productive soils into the atmosphere also represents a loss of crop nutrients. Understanding the circumstances and manageable factors that contribute to nitrous oxide formation in soils subsequent to manure application is important for retaining crop nutrients and preventing greenhouse gas emissions.

What did we do?

A literature review was performed to investigate the factors that contribute to nitrous oxide emissions following subsurface application of animal manure to both grassland and arable land, compare results from different application techniques, and examine the conditions and circumstances that lead to nitrous oxide emissions.

What have we learned?

Several studies demonstrate significant increases in nitrous oxide emissions (from 0.1 to 3 percent) attributable to factors including increasing soil moisture content, high concentrations of readily-available carbon in manure substrate, increased nitrate concentration in soil, shallow application depth, high soil temperature, and ambient conditions during and immediately following application (table 1). Other studies show no difference in nitrous oxide emissions as compared to surface application methods. Reasons that subsurface application techniques will not necessarily result in greater nitrous oxide emissions were: 1) the length of the diffusion path from the site of denitrification to the soil surface may lead to a greater portion of denitrified nitrogen being emitted as nitrogen gas; 2) the soil moisture conditions and aeration level at the time of application may not be suitable for increased nitrous oxide production; 3) prior to manur e application, soils may already contain readily-metabolizable carbon and mineral nitrogen, thus any increase in nitrous oxide emission following application may not have a significant impact; and 4) weather events subsequent to manure application may effect soil moisture content and water-filled-pore-space, thereby affecting nitrous oxide emissions. Several studies document nitrous oxide emissions due to subsurface application methods (including manure incorporation and shallow injection) but research comparing nitrous oxide emissions from different subsurface application techniques and application depth is limited. Lack or absence of data in literature about manure chemistry, nitrogen application rates, application technique or method, as well as soil and atmospheric conditions during and after application made it more difficult to draw specific conclusions on factors affecting nitrous oxide emissions from subsurface-applied manure.

Further research is needed to determine the environmental and economic tradeoffs of implementing subsurface manure application methods for abatement of NH3 considering different future greenhouse gas emissions and market scenarios. Recent work suggests a link between denitrifier community density, organic C, and N2O emissions. Characterization of these biological mechanisms and identification of genetic markers for key enzymes should continue, particularly with respect to various subsurface manure application techniques, different manure types and N application rates, soil types, environmental conditions, and soil chemistry. Subsurface application depth plays an important role in determining the proportion of N2O to N2 emitted during denitrification; however, the number of field studies that examine the impact of application depth is limited. More research is needed to determine optimal manure application depth as influenced by soil type, soil chemistry, timing of application, and vegetative cover. Finally, future research on subsurface manure application will allow existing and future prediction models to improve estimation of annual N2O emissions at landscape scale and airshed levels. Refinement of greenhouse gas inventories, including N2O emissions from agricultural production systems, will assist agriculture producers, scientists, and policy makers in making informed decisions on greenhouse gas emission mitigation.

research articles reporting factors of Nitrous Oxide

Future Plans

Future agricultural greenhouse gas regulations and/or carbon market incentives have potential implications for agricultural producers, including the method and timing of manure application. Controlled, replicated, and well-documented research on subsurface manure application and subsequent nitrous oxide release is critical for estimating the costs and benefits of different manure application techniques.

Authors

David W. Smith, Extension Program Specialist, Texas A&M AgriLife Extension DWSmith@ag.tamu.edu

Dr. Saqib Mukhtar, Professor and Associate Department Head for Extension, Texas A&M AgriLife Extension

Additional information

The publication ‘Estimation and Attribution of Nitrous Oxide Emissions Following Subsurface Application of Animal Manure: A Review’ has been accepted for publication in Transactions of the ASABE.

Acknowledgements

Funding for this effort provided by USDA-NIFA grant No. 2011-67003-30206.

The authors are solely responsible for the content of these proceedings. The technical information does not necessarily reflect the official position of the sponsoring agencies or institutions represented by planning committee members, and inclusion and distribution herein does not constitute an endorsement of views expressed by the same. Printed materials included herein are not refereed publications. Citations should appear as follows. EXAMPLE: Authors. 2015. Title of presentation. Waste to Worth: Spreading Science and Solutions. Seattle, WA. March 31-April 3, 2015. URL of this page. Accessed on: today’s date.

Measuring Pasture Dry Matter Intake of Horses


Why Is It Important to Accurately Measure Horse Dry Matter Intake?*

The ability to predict a horse’s rate of pasture dry matter intake (DMI) assists horse owners/managers in accounting for pasture’s contribution toward a horse’s daily nutrient requirements. Accounting for nutrients obtained from pasture improves the ability to accurately balance rations thereby preventing inefficiencies associated with over- or under- feeding nutrients. This presentation will review pasture DMI estimates for horses reported in scientific literature, sources of variation associated with the measurements, and methods used to measure pasture DMI.

Pasture dry matter intake varies considerably. Estimates for continuously grazing horses range from 1.5 to 2.5% of body weight in dry matter (DM). Factors contributing to variability in pasture DMI include herbage mass available for grazing, sward height, plant maturity, plant chemical composition, plant palatability, horse physiological status and time allowed for grazing. Dry matter intake tends to increase as pasture herbage mass increases, provided forage does not become over-mature. Sward height may also play a role in dry matter intake as it can influence harvest efficiency (e.g., bit size and rate of chewing necessary to swallow ingested forage). Level of plant maturity and sward height are also related to plant chemical composition. As plants reach maturity acid detergent fiber (ADF) and neutral detergent fiber (NDF) increase. Both ADF and NDF concentration are negatively correlated to a horse’s preference for forage. Plant nonstructural carbohydrate (NSC) has been reported to be positively correlated with horse pasture plant preference. Therefore plant chemical composition (ADF, NDF, NSC) influences horse preference and likely influences pasture DM intake. Dry matter intake is also influenced by horse physiological status. Horses having physiological states with nutrient requirements above maintenance may also have greater pasture dry matter intakes (e.g., lactating mares). Dry matter intake is also influenced by the amount of time a horse is allowed to graze. As the amount of time allowed for grazing is restricted a horse’s rate of dry matter intake increases. Therefore it is possible in some cases for horses to have restricted pasture access yet still consume a significant amount of forage DM due to an increased rate of DMI.

What Did We Do?

Several methods exist to measure pasture intake among grazing horses, yet none are perfect and all face challenges in their application. The primary methods are herbage mass difference, difference in BW pre- versus post-grazing, and marker techniques (e.g., alkanes, acid-insoluble ash etc…). Herbage mass difference measures the herbage mass prior to grazing and again following grazing. This is accomplished by harvesting multiple small forage sub-samples each having the same area (e.g., a sub-sample is harvested within a .25 m x .25 m frame at a height of 2.5 cm above the ground). The difference between pre- and post-grazing herbage mass reflects the amount of forage consumed by the horse. However, as the time between pre- and post-grazing increases, pasture re-growth contributes to error in this measurement. An additional source of error in this measurement results from variability in sub-samples used to predict pre- and post-grazing herbage mass. Therefore this met hod tends to work best in small areas where grazing takes place less than 12 h. Change in body weight during a grazing bout, corrected for fecal, urine and other water loss, is another method used to predict dry matter intake. However, this method requires an efficient means of collecting feces and urine (e.g., collection harness apparatus) and requires a livestock scale having a relatively high sensitivity. The sensitivity of many livestock scales is ± 1 kg, which can represent considerable variation for smaller intakes. Chemical markers, either inherent to the plant or provided externally, provide a means of measuring DMI in a natural grazing setting. Markers rely on the following principle: Intake = fecal output/indigestibility. Fecal output is determined by feeding a known amount of an external marker, not present in pasture plants (e.g., even-chained alkanes) and then measuring its dilution in the feces. Indigestibility is calculated as 1 – digestibility. Digestibility is determined by the ratio of a marker concentration within the plant to that in the feces. Internal markers used for estimating digestibility in horses include odd-chained alkanes and acid-insoluble ash. Marker methods provide accurate measures but are relatively expensive and require considerable care when sampling forage (e.g., the composition of forage sampled must reflect the composition of the forage consumed).

What Did We Learn?

Although each of these methods has their short comings they can provide a starting point to estimate dry matter intake. Coupling these estimates with horse performance measures (change in BW or body condition, average daily gain for growing horses) should be used in conjunction with these estimates in order to validate them and correct for their sources of error. Ultimately, these methods can be used to develop models that incorporate factors responsible for variation in DMI among horses to more accurately predict pasture intake thereby facilitating efficient use of pasture derived nutrients in feeding horses.

Author

Paul D. Siciliano is a Professor of Equine Management and Nutrition in the Department of Animal Science, North Carolina State University. He teaches classes in equine management and conducts research in the area of equine grazing management. Paul_Siciliano@ncsu.edu

Additional Information

Chavez, S.J., P.D. Siciliano and G.B. Huntington. 2014. Intake estimation of horses grazing tall fescue (Lolium arundinaceum) or fed tall fescue hay. Journal of Animal Science. 92:p.2304–2308.

Siciliano, P.D. 2012. Estimation of pasture dry matter intake and its practical application in grazing management for horses. Page 9-12 in Proc. 10th Mid-Atlantic Nutrition Conference. N.G. Zimmermann ed., Timonium, MA, March 2012.

The authors are solely responsible for the content of these proceedings. The technical information does not necessarily reflect the official position of the sponsoring agencies or institutions represented by planning committee members, and inclusion and distribution herein does not constitute an endorsement of views expressed by the same. Printed materials included herein are not refereed publications. Citations should appear as follows. EXAMPLE: Authors. 2015. Title of presentation. Waste to Worth: Spreading Science and Solutions. Seattle, WA. March 31-April 3, 2015. URL of this page. Accessed on: today’s date.