Adventure Dairy: Educational and Technical Tools for Carbon Cycle Modeling on a Virtual Dairy Farm

Conceptualizing, modeling, and controlling carbon flows at the farm scale can improve efficiency in production, reduce costs, and promote beneficial products and byproducts of agricultural processes through best management practices. On dairy farms, opportunities exist for farmers to control factors affecting greenhouse gas (GHG) emissions and diversions from production and operations. Complex programs to model the effects of different carbon management strategies on net emissions are very useful to farmers, but lack visualization of flows through a user interface to show effects of different management choices in real time.

Previously, a collaborative research team at Penn State University and the University of Wisconsin-Madison has developed a Virtual Dairy Farm website to share information about how dairy farms incorporate best management practices and other on-farm production choices to reduce environmental impacts. The website is organized in two model farm configurations, a 150-cow and a 1500-cow modern dairy farm. Website users can find information on different components of the farm by exploring locations on the farm. Links to information about farm operations are structured in multiple levels such that information is understandable to the general public but also supported by technical factsheets for agriculture professionals.

What did we do?

Building on the strengths of the Penn State Virtual Dairy Farm interactive website, the Team has developed a concept for an “Adventure Dairy” package for users to explore how management choices affect total on-farm GHG emissions for a model Pennsylvania dairy farm (Figure 1). Five main categories serve as management portals superimposed on the Virtual Dairy interface, including Cow Life Cycle, Manure Management, Crop Production, Energy Use on Farm, and Feed on Farm.

Figure 1. Example landing page for the proposed Adventure Dairy website. Different regions to explore to access the GHG emissions calculator are highlighted in different colors.

For each category, users can select from multiple options to see how these decisions increase or decrease emissions. Along the bottom of the webpage, a calculator displays the net carbon balance for the model system and change emissions estimates as users choose feed composition, land use strategies, and other important components (Figure 2). Under each category, users can make choices about different management practices that affect on-farm carbon cycling. For example, different choices for feed additives change total net GHG emissions, and, in turn, can affect total manure production. A change in management and operational choices, such as storage, is visually communicated through interactions and on the interface (Figure 3). These management portals can be seamlessly integrated with the Virtual Dairy Farm as an addition to the right sidebar. The click-through factsheets currently a part of the interface can be preserved through new informational “fast facts” overlays with accompanying infographics and charts. Pathways to optimizing carbon flows to ensure maximum production and minimum environmental impact will be featured as “demo” examples for users.

Figure 2. Example Adventure Dairy user interface for manure management. User choices to increase and decrease total GHG emissions are included in the right sidebar. Along the bottom of the page, a ribbon shows the total emissions from each category.
Figure 3. A different user choice for manure storage type on the Adventure Dairy interface. Total GHG emissions decrease by 14% because of the switch from an uncovered to a covered anaerobic lagoon because of reduced volatilization of methane.

What have we learned?

This model offers a novel platform for more interactive software programs and websites for on-farm modeling of carbon emissions and will inform future farm management visualizations and data analysis program interfaces. The Team envisions the Adventure Dairy platform as an important tool for Extension specialists to share information with dairy professionals about managing carbon flows on-farm. Simultaneously, consumers increasingly seek information on the environmental impacts of agriculture. This interactive website is a valuable educational and technical tool for a variety of audiences.

Uniquely, a multidisciplinary team of agriculture and engineering graduate students from multiple institutions are leading this project, as facilitated by faculty. This Cohort Challenge model allows for graduate students to engage with complex food-energy-water nexus problems at the level of faculty investigators in a virtual educational resource center. Future INFEWS-ER teams and “wicked problems” challenge projects will continue to develop this model of learning and producing novel research products.

Future plans

The Cohort Challenge Team is entering a peer/faculty review process of the simplified carbon model for the Virtual Dairy Farm website. The user interface for the Adventure Dairy calculator is not currently a part of the Penn State Virtual Dairy Farm. The Team will be working with software developers to integrate our model in the existing interface. Additional components under consideration for inclusion in the Adventure Dairy calculator include cost comparisons for different best management practices, an expanded crop production best management calculator, and incorporation of

Authors

Student Team: Margaret Carolan,1 Joseph Burke,2 Kirby Krogstad,3 Joslyn Mendez,4 Anna Naranjo,4 and Breanna Roque4

Project Leads: Deanne Meyer,4 Richard Koelsch,3 Eileen Fabian,5 and Rebecca Larson6


  1. Department of Civil and Environmental Engineering, University of Iowa, Iowa City, IA crln@uiowa.edu
  2. Texas A&M University
  3. University of Nebraska-Lincoln
  4. University of California-Davis
  5. Penn State University
  6. University of Wisconsin-Madison

Acknowledgements

Funding for the INFEWS-ER was provided by the National Science Foundation #1639340. Additional support was provided by the National Institute for Food and Agriculture’s Sustainable Dairy CAP and the National Center for Supercomputing Applications at the University of Illinois at Urbana-Champaign.

Useful resources

  1. Penn State Virtual Dairy Farm: http://virtualfarm.psu.edu/
  2. INFEWS-ER: http://infews-er.net/
  3. Sustainable Dairy CAP: http://www.sustainabledairy.org/Pages/home.aspx


The authors are solely responsible for the content of these proceedings. The technical information does not necessarily reflect the official position of the sponsoring agencies or institutions represented by planning committee members, and inclusion and distribution herein does not constitute an endorsement of views expressed by the same. Printed materials included herein are not refereed publications. Citations should appear as follows. EXAMPLE: Authors. 2019. Title of presentation. Waste to Worth. Minneapolis, MN. April 22-26, 2019. URL of this page. Accessed on: today’s date.

A National Assessment of the Environmental Impacts of Beef Cattle Production

Environmental effects of cattle production and the overall sustainability of beef have become national and international concerns. Our objective was to quantify important environmental impacts of beef cattle production throughout the United States. This provides baseline information for evaluating potential benefits of alternative management practices and mitigation strategies for improving the sustainability of beef.

What did we do?

Surveys and visits of farms, ranches and feedlots were conducted throughout seven regions of the United States (Northeast, Southeast, Midwest, Northern Plains, Southern Plains, Northwest and Southwest) to determine common practices and characteristics of cattle production. These data along with other information sources were used to create about 150 representative production systems throughout the country, which were simulated with the Integrated Farm System Model using local soil and climate data. The simulations quantified the performance and environmental impacts of beef cattle production systems within each region. A farm-to-gate life cycle assessment was used to determine resource use and emissions for all production systems including traditional beef breeds and cull animals from the dairy industry. Regional and national totals were determined as the sum of the production system outputs multiplied by the number of cattle represented by each simulated system.

What we have learned?

Average annual greenhouse gas emission related to beef cattle production was determined as 268 ± 29 million tons of carbon dioxide equivalent, which is approximately 3.3% of the reported total U.S. emission. Fossil energy use was 539 ± 50 trillion BTU, which is less than 1% of total U.S. consumption. Non-precipitation water use was 6.2 ± 0.9 trillion gallons, which is on the order of 5% of estimated total fresh water use for the country. Finally, reactive N loss was 1.9 ± 0.15 million ton, which indicates about 15% of the gaseous emissions of reactive N for the nation are related to beef cattle production. Expressed per lb of carcass weight produced, these impacts were 21.3 ± 2.3 lb CO2,e, 21.6 ± 2.0 BTU, 0.155 ± 0.012 lb N and 244 ± 37 gal for carbon, energy, reactive N and water footprints, respectively. Many sources throughout the production system contributed to these footprints (Figure 1). The majority of most environmental impacts was associated with the cow-calf phase of production (Figure 2).

Distribution of the major sources for each environmental footprint.
Figure 1. Distribution of the major sources for each environmental footprint.
Figure 2. Distribution of the sources of each environmental impact across the three major phases in the life cycle of beef cattle production.

Take-home message: This study is the most detailed, yet comprehensive, study conducted to date that provides baseline measures for the sustainability of U.S. beef.

Future plans

These farm-to-gate values are being combined with sources in packing, processing, distribution, retail, consumption and waste handling to produce a full life cycle assessment of U.S. beef considering additional metrics of environmental and economic impact. Further work is ongoing to complete this full LCA and to more fully assess opportunities for mitigating environmental impacts and improving the sustainability of beef.

Authors

Alan Rotz, USDA-ARS; Senorpe Asem-Hiablie, USDA-ARS; Sara Place, National Cattlemen’s Beef Association; Greg Thoma, University of Arkansas.

Additional information

Information on the Integrated Farm System Model is available in the reference manual:

Rotz, C., Corson, M., Chianese, D., Montes, F., Hafner, S., Bonifacio, H., Coiner, C., 2018. The Integrated Farm System Model, Reference Manual Version 4.4. Agricultural Research Service, USDA. https://www.ars.usda.gov/ARSUserFiles/80700500/Reference%20Manual.pdf.

Further information on the national assessment of the environmental impacts of U.S. cattle production is available in:

Rotz, C. A., S. Asem-Hiablie, S. Place and G. Thoma. 2019. Environmental footprints of beef cattle production in the United States. Agric. Systems 169:1-13.

Acknowledgements

This work was funded in part by The Beef Checkoff and the USDA’s Agricultural Research Service. USDA is an equal opportunity provider and employer.

The authors are solely responsible for the content of these proceedings. The technical information does not necessarily reflect the official position of the sponsoring agencies or institutions represented by planning committee members, and inclusion and distribution herein does not constitute an endorsement of views expressed by the same. Printed materials included herein are not refereed publications. Citations should appear as follows. EXAMPLE: Authors. 2019. Title of presentation. Waste to Worth. Minneapolis, MN. April 22-26, 2019. URL of this page. Accessed on: today’s date.

Environmental Impacts of Dairy Production Systems in the Changing Climate of the Northeast

To meet the nutritional needs of a growing population, dairy producers must increase milk production while minimizing farm environmental impacts. As we look to the future, management practices must also be adapted to maintain production under projected climate change. To plan for the future, better information is needed on practices that can reduce emissions from the farm and adapt to changes in the climate while maintaining or improving production and profitability.

What did we do?

We conducted a comprehensive assessment of the effects of climate change on both the productivity and environmental performance of farms as influenced by strategies to reduce emissions and adapt to the changing climate. Production systems were evaluated using three representative northeastern dairy farms: a 1500-cow farm in New York, a 150-cow farm in Wisconsin and a 50-cow farm in southern Pennsylvania. A cradle-to-farm gate life cycle assessment was conducted using farm-scale process-based modeling and climate projections for high and low emission scenarios. Environmental considerations included the carbon footprint of the milk produced and reactive N and P losses from the farms.

What we have learned?

We found that the environmental impact of the three representative dairy farms generally increased in the near future (2050) climate if no mitigation measures were taken. Overall, feed production was maintained as decreases in corn grain yield were compensated by increases in forage yields. Adaptation of the cropping system through changes in planting and harvest dates and corn variety led to a smaller reduction in corn grain yield, but the detrimental effects of climate change could not be fully negated. Considering the increased forage yield, total feed production increased except for the most severe projected climate change. Adoption of farm-specific beneficial management practices substantially reduced the greenhouse gas emissions and nutrient losses of the farms in current climate conditions and stabilized the environmental impact in future climate conditions, while maintaining feed and milk production (See Figure 1 for example results).

Figure 1. Carbon footprint, reactive nitrogen footprint and P loss in recent (2000) and future (2050) climate conditions (RCP4.5 and RCP8.5) for a 1500-cow farm in New York with baseline and Best Management Practice (BMP) scenarios, with and without crop system adaptions in 2050. Error bars represent the standard deviation of IFSM simulations for 3 climate scenarios per RCP. Unadapt = not adapted cropping system. Adapt = adapted cropping system.

The take-home message is that with appropriate management changes, our dairy farms can become more sustainable under current climate and better prepared to adapt to future climate variability.

Future plans

A more comprehensive life cycle assessment is being done by linking the output of the farm model with life cycle assessment software. The process level simulation of the farm provides inventory information for an inclusive life cycle assessment with multiple environmental considerations. This integrated software will provide a more complete sustainability assessment of the potential benefits of alternative management strategies for both now and the future.

Authors

Karin Veltman, University of Michigan; C. Alan Rotz, USDA-ARS; Larry Chase, Cornell University; Joyce Cooper, Washington State University; Chris Forest, Penn State University; Pete Ingraham, Applied GeoSolutions; R. César Izaurralde, University of Maryland; Curtis D. Jones, University of Maryland; Robert Nicholas, Penn State University; Matt Ruark, University of Wisconsin; William Salas, Applied GeoSolutions; Greg Thoma, University of Arkansas; Olivier Jolliet, University of Michigan.

Additional information

Information on the Integrated Farm System Model is available in the reference manual:

Rotz, C., Corson, M., Chianese, D., Montes, F., Hafner, S., Bonifacio, H., Coiner, C., 2018. The Integrated Farm System Model, Reference Manual Version 4.4. Agricultural Research Service, USDA. Available at: https://www.ars.usda.gov/northeast-area/up-pa/pswmru/docs/integrated-farm-system-model/#Reference.

Information on the analysis of Best Management Practices on northeastern dairy farms is available in:

Veltman, K., C. A. Rotz, L. Chase, J. Cooper, P. Ingraham, R. C. Izaurralde, C. D. Jones, R. Gaillard, R. A. Larsson, M. Ruark, W. Salas, G. Thoma, and O. Jolliet. 2017. A quantitative assessment of beneficial management practices to reduce carbon and reactive nitrogen footprints and phosphorus losses of dairy farms in the Great Lakes region of the United States. Agric. Systems 166:10-25.

Acknowledgements

This work was supported by the National Institute of Food and Agriculture, U.S. Department of Agriculture, under award number 2013-68002-20525. Any opinions, findings, conclusions, or recommendations expressed in this publication are those of the authors and do not necessarily reflect the view of the U.S. Department of Agriculture. USDA is an equal opportunity provider and employer.

The authors are solely responsible for the content of these proceedings. The technical information does not necessarily reflect the official position of the sponsoring agencies or institutions represented by planning committee members, and inclusion and distribution herein does not constitute an endorsement of views expressed by the same. Printed materials included herein are not refereed publications. Citations should appear as follows. EXAMPLE: Authors. 2019. Title of presentation. Waste to Worth. Minneapolis, MN. April 22-26, 2019. URL of this page. Accessed on: today’s date.

Inclusion of the Environment Bottom Line in Waste to Worth: The Interaction Between Economics, Environmental effects, and Farm Productivity in Assessment of Manure Management Technology and Policy

Proceedings Home | W2W Home waste to worth 2017 logo

Purpose

In a global context, the pork industry constitutes a huge economic sector but many producers operate on very thin margins. In addition, pork is one of the largest and most important agricultural industries in North Carolina and the United States but faces a number of challenges in regards to waste management and environmental impacts.On more local scales, swine producers face a number of additional constraints including land availability, waste management options (technical and regulatory), nutrient management costs, profits, risk, and return on investment. In the face of increasingly stringent environmental regulations, decreasing land availability, and higher costs for fertilizer, it is necessary to consider alternative technologies with the potential for improving environmental conditions and creating value added products. Technology assessments generally focus on technical performance as the measure of “utility” or usefulness. Primary physical performance measures such as efficiency, production rate, and capacity, while necessary may not be sufficient for capturing the overall value of a technology. A significant amount of research has evaluated the feasibility of technology adoption based on traditional economic measures but far less research has attempted to “value” environmental performance either at farm-scale or in the larger context (e.g. supply chain response to changes in technology or policy and regulation). Considering response over time, the extent to which environmental and economic policies and regulations positively or negatively affect technology innovation, emission and nutrient management, competitiveness, and productivity, remains largely unknown.

The purpose of this study is to evaluate the environmental and economic tradeoffs between current swine waste management practices in North Carolina and alternative scenarios for future on-farm decision making that include new technologies for waste removal, treatment, and nitrogen recovery. In addition, we begin to understand these economic and environmental tradeoffs in the context of various environmental policy and regulation scenarios for markets of carbon, electricity, and mineral fertilizer.

What did we do?

Using waste samples from swine finishing farms in southeastern NC, laboratory and bench scale experiments were conducted to determine the quantity and quality of biogas generation from anaerobic digestion and nitrogen recovery from an ammonia air stripping column. Based on these data as well as information from literature, six trial life cycle assessment scenarios were created to simulate alternatives for annual manure waste management for one finishing barn (3080 head) on the farm. Materials, energy, and emissions were included as available for all system components and processes including but not limited to waste removal from barns (flushing or scraping), treatment (open air lagoon or covered lagoon digester), nitrogen recovery (ammonia air stripping column), and land application (irrigation). A description of the scenarios as well as processes that are included/excluded for each can be found in Table 1. All scenarios were modeled over a one year operational period using a “gate to gate” approach where the mass and energy balance begins and ends on the farm (i.e. production of feed is not included and manure is fully utilized on the farm). It was assumed that each scenario included an existing anaerobic treatment lagoon with manure flushing system (baseline, representative of NC swine farms). In the remaining scenarios, the farm had an option of covering the lagoon and using it as a digester to produce biogas (offsetting natural gas); covering the digester and ammonia air stripping column for nitrogen recovery (offsetting mineral ammonium sulfate); installing a mechanical scraper system in the barn (replaces flushing); and/or different combinations of these. Open LCA, an open source life cycle and sustainability assessment software, was used for inventory analysis and the Tool for Reduction and Assessment of Chemicals and Other Environmental Impacts (TRACI 2.0) was used to characterize environmental impacts to air, water, and land. From Table 2 preliminary results indicate that all scenarios had a similar pattern in terms of impact for the assessed categories. The open air lagoon had the highest overall environmental impact followed by scraping manure with digestion and recovery and scraped slurry digestion with no nutrient recovery. Flushed manure to the digester with nutrient recovery had the lowest overall environmental impact, followed closely by scraped whole slurry to the digester with nutrient recovery.

Table 1. Life cycle assessment scenarios with waste management processes included in evaluation

Table 2. Relative impact of scenarios for selected environmental indicators

Using energy and emissions data from the initial life cycle assessment on alternative scenarios for swine waste management systems we have started to characterize the environmental and economic outcomes arising from selected on farm technologies. More specifically we began to examine the regulatory, institutional, and market barriers associated with technology adoption within the swine industry. We provide a theoretical model to support quantification of the change in revenues and expenses that result from changes in three major markets connected to swine production – carbon, electricity, and fertilizer. We examine some of the economic characteristics of environmental benefits associated with changes to farm practices. Finally, we discuss implications for innovation in technology and policy.

What have we learned?

Preliminary results are somewhat mixed and further research is needed to see how sensitive the life cycle assessment inputs and outputs are to system components. While there is a clear indication that covering lagoons, with or without additional nutrient recovery, reduces environmental impact – farm scale systems can be quite expensive and no further determination can be made until a full economic analysis has been conducted. Modeling secondary effects, such as increased ammonia emissions in barns from flush water recirculated from digesters, remains to be included. Besides farm level cost and returns, review of literature has pointed to additional barriers to adoption of reduced environmental impact technologies. Examples of barriers include deficient or non-existent markets for environmental benefits, and various state and federal regulations and policies related to renewable energy, carbon offsets, new farm waste management technology, etc. Solutions such as better cooperation between energy firms, regulatory agencies, and farmers as well as increased financial incentives such as carbon credits, renewable energy credits, net metering options, and enabling delivery of biogas to natural gas pipelines can greatly increase the profitability and implementation of this technology on NC hog farms.

Future Plans

As this is an ongoing multi-disciplinary project, future plans include the expansion of existing data to form a more comprehensive life cycle inventory with options for both new and existing swine farms, which include additional options for waste treatment, nutrient recovery, and land application/fertilizer methods, etc. Energy and emissions data from the life cycle model will continue to be utilized as inputs into a more fully integrated model capable of reflecting the true “cost” and “values” associated with waste management treatment systems. In addition, it is expected that the integrated model will include the flexibility to simulate overall costs and returns for various sizes of operations within the county, region, and if possible state-wide.

Corresponding author, title, and affiliation

Shannon Banner, Graduate Student, North Carolina State University

Corresponding author email

sbcreaso@ncsu.edu

Other authors

Dr. John Classen, Dr. Prince Dugba, Mr. Mark Rice, Dr. Kelly Zering

Acknowledgements

Funding for this project was provided by a grant from Smithfield Swine Production Group

The authors are solely responsible for the content of these proceedings. The technical information does not necessarily reflect the official position of the sponsoring agencies or institutions represented by planning committee members, and inclusion and distribution herein does not constitute an endorsement of views expressed by the same. Printed materials included herein are not refereed publications. Citations should appear as follows. EXAMPLE: Authors. 2017. Title of presentation. Waste to Worth: Spreading Science and Solutions. Cary, NC. April 18-21, 2017. URL of this page. Accessed on: today’s date.

Are Models Useful for Evaluating or Improving the Environmental Impact of Pork Production?

green stylized pig logo

Models are basically equations that are based on real-world measurements. Measurements are made in different situations and/or different times. Models are used to make comparisons between different choices or look at “what if” scenarios without having to implement each possible option.

Generally, models that are created with large, diverse (but still compatible) data sets containing relevant information are going to be more reliable than models with smaller data sets with smaller data sets. Models can then be used to predict performance or evaluate changes in a system.

There are very good reasons to use models when looking at the environmental footprint of pork production:

  1. Efficiency. It is expensive and impractical to measure actual emissions from every farm or barn.
  2. Decision-making. Models allow farmers and their advisers to look at “what if?”. Prior to making an expensive decision, farmers can evaluate the location, type of building, manure storage, manure treatment, feed ration, etc. and select the best option.
  3. Measure progress trends. Models can be applied at different points in time to see if a farm or industry is making progress in reducing their impacts.

Are there limitations to models?

Yes. By their very nature, models are a simplified representation of a complex system. Modeling is a balance between complexity (how much information does the user need and how much time will it take?) and accuracy (how much is gained by including additional variables?).  The results must be evaluated in their appropriate context. As an example, many TV weather forecasters look at several sources of information, including models when formulating their forecast. While on a given day the forecast may be off (either due to inaccurate analysis or results) it is safe to say that overall, weather forecasting is greatly enhanced by the use of models.

Do you have an example of a model used on pig farms?

One example of a model that is currently looking at the environmental footprint of pork production is the Pork Production Environmental Footprint Calculator.  It currently estimates greenhouse gas (GHG) emissions and the day to day costs of the activities that generate those emissions, but research is underway to expand the model to include land,  and water footprints–leading to a more comprehensive “environmental footprint” model.

The model referenced above can be used for estimating the GHG emissions from the various operations on a pig farm in order to calculate the farm’s cumulative emissions. It shows where the major contributions arise, and provides a test bed for identifying strategies that reduce emissions at least cost. The model requires input information that most producers will know about their operation such as the type of barn, animal throughput, type and quantity of feed ration used, a physical description of the facilities (size of barn, insulation, fans etc.), the time in the barn, temperature profile for that area, type of manure management system (lagoon, dry lot, pit, etc.).  Sample costs for day to day farm activities are provided in the model, but can be updated by the user. The model output includes a summary of feed and energy usage for the simulation, including energy estimates for temperature control (both heating and ventilation) as well as costs.

Authors: Jill Heemstra, University of Nebraska jheemstra@unl.edu and Rick Fields, University of Arkansas rfields@uaex.edu

Reviewers: Dr. Jennie Sheerin Popp, University of Arkansas, Dr. Karl Vandevender, University of Arkansas

For More Information:

Acknowledgements

This information is part of the program “Integrated Resource Management Tool to Mitigate the Carbon Footprint of Swine Produced In the U.S.,” and is supported by Agriculture and Food Research Initiative Competitive Grant no. 2011-68002-30208 from the USDA National Institute of Food and Agriculture. Project website.

From Waste to Energy: Life Cycle Assessment of Anaerobic Digestion Systems

Waste to Worth: Spreading science and solutions logoWaste to Worth home | More proceedings….

Abstract

In recent years, processing agricultural by-products to produce energy has become increasingly attractive due to several reasons: centralized availability of low cost by-products, avoiding the fuel vs. food debate, reduction of some associated environmental impacts, and added value that has the potential to generate additional income for producers. Anaerobic digestion systems are one waste-to-energy technology that has been proven to achieve these objectives.  However, investigation on the impacts of anaerobic digestion has focused on defined segments, leaving little known about the impacts that take place across the lifecycle. Current systems within the U.S. are dairy centric with dairy manure as the most widely used substrate and electricity production as the almost sole source for biogas end use.  Recently, there is more interest in exploring alternative feedstocks, co-digestion pathways, digestate processing, and biogas end uses.  Different operational and design practices raise additional questions about the wide reaching impacts of these decisions in terms of economics, environment, and operational aspects, which cannot be answered with the current state of knowledge.

Why Study the Life Cycle of Anaerobic Digestion?

Waste management is a critical component for the economic and environmental sustainability of the agricultural sector. Common disposal methods include land application, which consumes large amounts of land resources, fossil energy, and produces significant atmospheric GHG emissions. Proof of this is that agriculture accounts for approximately 50% of the methane (CH4) and 60% of the nitrous oxide (N2O) global anthropogenic emissions, being livestock manure one of the major sources of these emissions (Smith et al., 2007). In the last decades, the development of anaerobic digestion (AD) systems has contributed to achieve both climate change mitigation and energy independence by utilizing agricultural wastes, such as livestock manure, to produce biogas. In addition, it has been claimed that these systems contribute to nutrient management strategies by adding flexibility to the final use and disposal of the remaining digestate. Despite these advantages, the implementation of AD systems has been slow, due to the high investment and maintenance costs. In addition, little is still known about the lifecycle impacts and fate and form of nutrients of specific AD systems, which would be useful to validate their advantages and identify strategic and feasible areas for improvement.

The main goal of this study is to quantify the lifecycle GHG emissions, ammonia emissions, net energy, and fate and form of nutrients of alternative dairy manure management systems including land-spread, solid-liquid separation, and anaerobic digestion. As cow manure is gaining an important role within the biofuel research in the pursuit for new and less controversial feedstocks, such as corn grain, the results of this study will provide useful information to researchers, dairy operators, and policy makers.

What Did We Do?

Lifecycle sustainability assessment (LCSA) methods were used to conduct this research, which is focused in Wisconsin. The state has nearly 1.3 million dairy cows that produce approximately 4.7 million dry tons of manure annually and is the leading state for implemented agricultural based AD systems. Manure from a 1,000 milking cow farm (and related maintenance heifers and dry cows) was taken as the base-case scenario. Four main processes were analyzed using the software GaBi 5 (PE, 2012) for the base case: manure production and collection, bedding sand-separation, storage, and land application. Three different manure treatment pathways were compared to the base-case scenario: including a solid-liquid mechanical separator, including a plug-flow anaerobic digester, and including both the separator and the digester. The functional unit was defined as one kilogram of excreted manure since the function of the system is to dispose the waste generated by the herd. A cradle-to-farm-gate approach was defined, but since manure is considered waste, animal husbandry and cultivation processes were not included in the analysis (Fig. 1). Embedded and cumulative energy and GHG emissions associated with the production of material and energy inputs (i.e. sand bedding, diesel, electricity, etc.) were included in the system boundaries; however, the production of capital goods (i.e. machinery and buildings) were excluded.

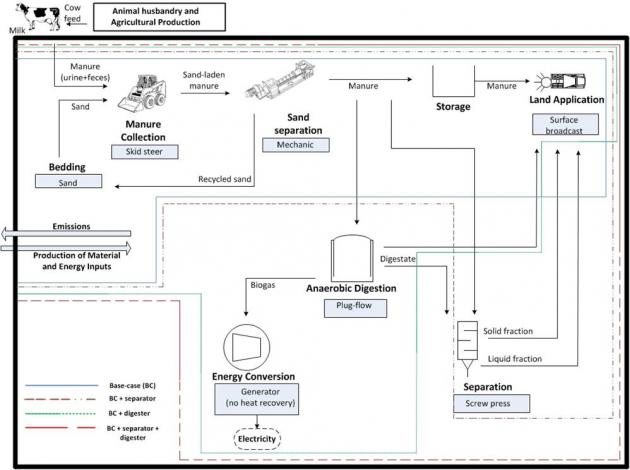
Figure 1. System boundaries of the base case scenario (land-spread manure) and the three manure treatment pathways: 1) solid-liquid separation, 2) anaerobic digestion, 3) anaerobic digestion and solid-liquid separation.

Global warming potential (GWP) was characterized for a 100-year time horizon and measured in kg of carbon dioxide equivalents (CO2-eq). Characterization factors used for gases other than CO2 were 298 kg CO2-eq for N2O, 25 kg CO2-eq for abiotic CH4 based on the CML 2001 method, and 24 kg CO2-eq for biotic CH4. CO2 emissions from biomass are considered to be different from fossil fuel CO2 emissions in this study; the former recycles existing carbon in the system, while the latter introduces new carbon into the atmosphere. In this context, it will be assumed that CO2 emissions from biomass sources were already captured by the plant and will not be characterized towards GWP[1]. This logic was applied when characterizing biogenic methane as one CO2 was already captured by the plant, therefore, reducing the characterization factor from 25 kg CO2-eq to 24 kg CO2-eq. Even though ammonia (NH3) does not contribute directly to global warming potential, it is considered to be an indirect contributor to this impact category (IPCC, 2006).

Data was collected from different sources to develop lifecycle inventory (LCI) as specific to Wisconsin as possible, in order to maximize the reliability, completeness, and representativeness of the model. The following points summarize some of the data sources and assumptions used to construct the LCI:

  • Related research (Reinemann et al., 2010): This model provided data about animal husbandry and crop production for dairy diet in Wisconsin.
  • Manure management survey: The survey, sent to dairy farms in Wisconsin, has the objective of providing information related to manure management practices and their associated energy consumption.
  • In house experiments: laboratory experiments, conducted at the University of Wisconsin-Madison, provided characterization data about manure flows before and after anaerobic digestion and solid-liquid separation and manure density in relation to total solids (Ozkaynak and Larson, 2012).
  • Material and energy databases: National Renewable Energy Laboratory U.S. LCI dataset (NREL, 2008), PE International Professional database (PE, 2012), and EcoInvent (EcoInvent Center, 2007), which are built into GaBi 5. The electricity matrix used in this LCA represents the mix of fuels that are part of the electric grid of Wisconsin.
  • Representative literature review.

Biotic emissions from manure have been cited to be very site specific (IPCC, 2006) and even though the Intergovernmental Panel on Climate Change (IPCC) provides regional emission factors, they are only for CH4 and N2O. Specific GHG emission factors were developed for Wisconsin based on the Integrated Farm System Model (IFSM) (Rotz et al., 2011), and by using key parameters that affect emissions (e.g. temperature, volatile solids, manure management practices) for each stage of the manure management lifecycle.

What Have We Learned?

Emissions are produced from consumed energy and from manure during each stage of the manure management lifecycle. In the base-case scenario, manure storage is the major contributor to GHG emissions. In this scenario, a crust tends to form on top of stored manure due to the higher total solids content when compared to digested manure and the liquid fraction of the separated manure. The formation of this crust affects overall GHG emissions (e.g. crust formation will increase N2O emissions but reduce CH4 emissions). The installation of a digester reduces CH4 emissions during storage due to the destruction of volatile solids that takes place during the digestion process. However, some of the organic nitrogen changes form to ammoniacal nitrogen, increasing ammonia and N2O emissions posterior to storage and land application. Energy consumption increases with both anaerobic digester and separation, but net energy is higher with anaerobic digestion due to the production of on-farm electricity. The nutrient balance is mostly affected by the solid-liquid separation process rather than the anaerobic digestion process.

Future Plans

A comprehensive and accurate evaluation of the lifecycle environmental impacts of AD systems requires assessing the multiple pathways that are possible for the production of biogas, which are defined based on local resources, technology, and final uses of the resulting products.  A second goal of this research is to quantify the net GHG and ammonia emissions, net energy gains, and fate of nutrients of multiple and potential biogas pathways that consider different: i) biomass feedstocks (e.g miscanthus and corn stover), ii) management practices and technology choices, and iii) uses of the produced biogas (e.g. compressed biogas for transportation and upgraded biogas for pipeline injection) and digestate (e.g. bedding). This comprehensive analysis is important to identify the most desirable pathways based on established priorities and to propose improvements to the currently available pathways.

Authors

Aguirre-Villegas Horacio Andres. Ph.D. candidate. Department of Biological Systems Engineering, University of Wisconsin-Madison.  aguirreville@wisc.edu

Larson Rebecca. Ph.D. Assistant Professor. Department of Biological Systems Engineering, University of Wisconsin-Madison.

Additional Information

    • Ozkaynak, A. and R.A. Larson.  2012.  Nutrient Fate and Pathogen Assessment of Solid Liquid Separators Following Digestion.  2012 ASABE International Meeting, Dallas, Texas, August 2012

References

De Klein C., R. S.A. Novoa, S. Ogle, K. A. Smith, P. Rochette, T. C. Wirth,  B. G. McConkey, A. Mosier, and K. Rypdal. 2006. Chapter 11: N2O emissions from managed soils, and CO2 emissions from lime and urea application. In Volume 4: Agriculture, Forestry and Other Land Use. IPCC 2006, 2006 IPCC Guidelines for National Greenhouse Gas Inventories, Prepared by the National Greenhouse Gas Inventories Programme, Eggleston H.S., Buendia L., Miwa K., Ngara T. and Tanabe K. (eds). Published: IGES, Japan.

Ecoinvent Centre.2007. Ecoinvent Eata. v2.0. Ecoinvent Reports No.1-25. Swiss Centre for Life Cycle Inventories. Dübendorf.

National Renewable Energy Laboratory (NREL). 2008. U.S. Life-Cycle Inventory (LCI) Database.

Ozkaynak, A. and R.A. Larson.  2012.  Nutrient Fate and Pathogen Assessment of Solid Liquid Separators Following Digestion.  2012 ASABE International Meeting, Dallas, Texas, August 2012

PE International. 2012. Software-systems and databases for lifecycle engineering.

Reinemann D. J., T.H. Passos-Fonseca, H.A. Aguirre-Villegas, S. Kraatz, F. Milani, L.E. Armentano, V. Cabrera, M. Watteau, and J. Norman. 2011. Energy intensity and environmental impact of integrated dairy and bio-energy systems in Wisconsin, The Greencheese Model.

Rotz, C. A., M. S. Corson, D. S. Chianese, F. Montes, S.D. Hafner, R. Jarvis, and C. U. Coiner. 2011. The Integrated Farm System Model (IFSM). Reference Manual Version 3.4. Accessed on Nov, 2012. Available at: http://www.ars.usda.gov/Main/docs.htm?docid=8519

Smith, P., D. Martino, Z. Cai, D. Gwary, H. Janzen, P. Kumar, B. McCarl, S. Ogle, F. O’Mara, C. Rice, B. Scholes, O. Sirotenko. 2007: Agriculture. In Climate Change 2007: Mitigation. Contribution of Working Group III to the Fourth Assessment Report of the Intergovernmental Panel on Climate Change [B. Metz, O.R. Davidson, P.R. Bosch, R. Dave, L.A. Meyer (eds)], Cambridge University Press, Cambridge, United Kingdom and New York, NY, USA.

Acknowledgements

This work was funded by the Wisconsin Institute for Sustainable Agriculture (WISA-Hatch)

The authors are solely responsible for the content of these proceedings. The technical information does not necessarily reflect the official position of the sponsoring agencies or institutions represented by planning committee members, and inclusion and distribution herein does not constitute an endorsement of views expressed by the same. Printed materials included herein are not refereed publications. Citations should appear as follows. EXAMPLE: Authors. 2013. Title of presentation. Waste to Worth: Spreading Science and Solutions. Denver, CO. April 1-5, 2013. URL of this page. Accessed on: today’s date.

Carbon Footprints

A carbon footprint is the total greenhouse gas emissions for a given person, place, event or product.

Carbon footprints are created using a process called life cycle assessment. Life cycle assessment or LCA is a method of resource accounting where quantitative measures of inputs, outputs and impacts of a product are determined.

Life cycle assessment is commonly used to:

  • find process or production improvements
  • compare different systems or products
  • find the ‘hot spots’ in a product’s life cycle where the most environmental impacts are made
  • help businesses or consumers make informed sourcing decisions

LCA Methods

There are several standard approaches for developing a life cycle assessment including the International Dairy Federation, the U.S. EPA, and two European standards: ISO 14040, and PSA 2050.  While this can be completed with a simple spreadsheet, there are several software packages available to help complete the LCA

Steps to a Life Cycle Analysis:

  1. Define the goal & scope of the LCA. This includes determining the purpose for the analysis.
  2. Set the boundaries of the system: each higher tier provides a more complete picture of the product’s impacts, however requires more time and resources to complete.
    1. Gate to Gate (LCA Tier I) – inventories the direct emissions for a single product of process
    2. Cradle to Gate (Tier II) – inputs are taken back to the initial extraction as natural resources up to a certain point in the product’s life such as its sale from the farm, i.e. farm gate.  This will include both direct  and indirect emissions from the product.
    3. Cradle To Grave (Tier III) – the product is followed through the consumer to its eventual recycling or disposal.
  3. Determine how the impacts will be measured, also known as the functional unit. This can be expressed as the net sum of all impacts per unit of product, or the opposite: for a given amount of product, the amount of impact e.g. pounds of greenhouse gas emissions produced per pound of energy corrected milk.
    • Example impacts: greenhouse gas emissions, water use, land use, health impact
    • Example livestock products: Pound of meat, dozen eggs, energy corrected milk production, nutritional content.
  4. Inventory the needed data. Information is gathered to identify and quantify energy, water and materials usage and the environmental releases associated with each step of the process. These data are collected through research and modeling for many different inputs, from coal mining to equipment manufacturing, and are available through worldwide databases. However, some of the needed data may not yet be available so research articles, models and assumptions must be used to fill in the final informaion.
  5. Allocate resources and impacts to co-products. For example in dairy production, feeder cattle for meat production are also grown. The impacts of dairy feeder production can be included in the milk LCA, because calves are necessary for milk production, or a portion of the impacts can be allocated to beef production. This allocation can be made several ways, with the most common being economic, i.e. the calves are 10% of the value of dairy enterprise, or mass, i.e. the calves are 1% of the mass leaving the farm.
  6. Impact assessment. This is where all the impacts are totaled and summarized. If the purpose of the LCA was to produce a carbon footprint, then only greenhouse gas impacts need totaled. However, multiple impacts can be compared and given different weighting if an overall score for a product is part of the purpose for the LCA.

Sources of variation

Different researchers may get different results when performing a LCA on the same product. This can happen for many reasons:

  • System boundary definition
  • Inclusion/exclusion of secondary/ indirect sources
  • Inclusion/exclusion of biogenic carbon (stored in organisims)
  • Inclusion/exclusion of carbon dioxide from fuel combustion
  • Functional relationships used
  • Global warming potential indexes
  • Inclusion/exclusion of carbon sequestration

Additional Resources

Additional Animal Agriculture and Climate Change Resources

Climate Science Resources

Basic Climate Science (Texas A&M AgriLife Extension, 2012)

2007 IPCC Fourth Assessment Report (AR4) on Climate Change

Global Climate Change Impacts in the United States (Karl, T. et al., 2009)

Carbon, Climate Change and Controversy (Shepherd, J. M., 2011)

Global Climate Change Causes – web site (NASA, 2012)

Center for Climate and Energy Solutions

The Modern Temperature Record (American Institute of Physics)


Author: Crystal A. Powers – UNL
Reviewers: J. Harrison – WSU, J. Heemstra – UNL, S Mukhtar – TAMU, D. Smith – TAMU

Carbon Footprint of Animal Agriculture Webcast

Many people are concerned about greenhouse gases and climate change. The carbon footprint of animal agriculture is an issue being used by many to encourage people to eat less meat. What is the true footprint of US animal production? How does production efficiency impact the numbers? This presentation was originally broadcast on July 31, 2009. More… Continue reading “Carbon Footprint of Animal Agriculture Webcast”