Evaluation of a Continuously-Mixed Farm-Based Anaerobic Co-Digestion System Following the U.S. EPA Protocol for Quantifying and Reporting on the Performance of Anaerobic Digestion Systems for Livestock Manures – Final Project Results

This paper compliments another paper proposed for this conference “Lifecycle analysis of greenhouse gas (GHG) emissions from a New York State dairy farm anaerobically co-digesting manure and food waste.”

Purpose 

New York State’s largest manure-based anaerobic co-digestion facility was evaluated continuously for a 2-year period following the U.S. EPA Protocol for quantifying and reporting on the performance of anaerobic digestion systems for livestock manures. Overall, we assessed and determined the system’s performance with respect to the: 1) conversion of biomass to biogas, 2) conversion of biogas to useful energy, and 3) system’s economics. The information developed by this project can be used to compare performance information developed from other manure-based anaerobic digestion systems. Related: Treatment Technologies for Livestock Manure

What did we do? 

After initial system evaluation and monitoring plan development, the farm was visited monthly for 24 months to collect data. In addition to the digester influent and effluent samples taken during each monthly sampling date, on-site measurements were taken and data were manually recorded from equipment and plant logs. A particularly important log, were the imported feedstocks brought on-site for inclusion to the AD. This log recorded the date and time feedstock was delivered, the type of feedstock, and the volume delivered. The specific data collected/measured are shown in Table 1.

Table 1. Data collected/measured on-site at each sampling date.

Item
1. Date and time of readings
2. Methane (CH4), Carbon dioxide (CO2), Oxygen (O2), and Hydrogen sulfide (H2S) concentrations in biogas after digester
3. CH4, CO2, O2, and H2S concentrations in biogas after bio-scrubber
4. Engine-generator set run time
5. Cumulative electricity purchased and sold
6. Daily animal populations since previous sampling event
7. Logs of imported feedstocks
8. Problems occurred during period

Further, data (Table 2) from the system’s supervisory, control, and data acquisition (SCADA) unit were downloaded, compiled and analyzed for each period. SCADA data were generated from an array of sensors and meters originally installed by the company that designed and built the digester, i.e., Bigadan A/S.

Table 2. Data obtained from the SCADA system for each period.

Parameter

1. Total influent to pasteurization
2. Food waste to pasteurization
3. Manure to pasteurization
4. Biomass from pasteurization to digester
5. Effluent digester to storage tank
6. Biogas production digester
7. Biogas to generator
8. Generator electrical energy output
9. Generator thermal energy recovered
10. Digester vessel upper temperature
11. Digester vessel lower temperature

Overall, digester influent and effluent samples were collected with the goal of obtaining representative samples. To do this, grab samples were collected directly from both the digester influent and effluent lines over a period of approximately 30 min during a pumping sequence, to develop a 5-gallon composite, master-sample. The entire volume of this sample was then agitated using a paint mixer powered by a portable electric drill until visibly determined to be homogenized. A 1-liter composite sample was immediately taken and stored on ice, and subsequently frozen before being sent for laboratory analysis. Samples were taken in this fashion approximately every 30 days over the 24-month monitoring period. Additionally, samples coming from the raw manure receiving tank and from the combined imported feedstocks tank were also obtained for two sampling dates at the beginning of the monitoring project to characterize the individual influent streams to the digester.

All samples collected during the 24-month monitoring period were sent for analysis to Certified Environmental Services’ (CES) laboratory in Syracuse, NY, approved by the New York State Department of Health, Environmental Laboratory Approval Program (NYSDOH-ELAP #11246). All samples were analyzed in triplicate for: total solids (TS), total volatile solids (VS), chemical oxygen demand (COD), pH, and total volatile acids as acetic acid (TVFA). In addition, the following nutrients were determined in triplicate: total phosphorus (TP), ortho-phosphorus (OP), total Kjeldahl nitrogen (TKN), ammonia-nitrogen (NH3-N) and potassium (K). CES followed the appropriate testing methods outlined in Table 3 for each parameter measured.

Table 3. Standard analytical methods used by CES laboratory for sample analyses.

Parameter Standard
Total Solids (TS) EPA 160.3
Total Volatile Solids (VS) EPA 160.4
Fixed Solids (FS) EPA 160.4
Volatile Acid as Acetic Acid (TVFA) SM18 5560C
Chemical Oxygen Demand (COD) SM18 5220B
pH SW846 9045
Total Kjeldahl Nitrogen (TKN) EPA 351.4
Ammonia-Nitrogen (NH3-N) SM18 4500F
Organic-Nitrogen (ON) By subtraction: TKN – NH3-N
Total Phosphorous (TP) EPA 365.3
Ortho Phosphorous (OP) EPA 365.3
Total Potassium (K) EPA SW 846 6010

Methane (CH4), carbon dioxide (CO2), hydrogen sulfide (H2S), and oxygen (O2) concentration in biogas, were measured on-site during monthly visits using a Multitec 540 (Sewerin GmbH, Germany), a portable hand-held gas measuring device equipped with infra-red/electrochemical sensors.

What have we learned? 

For the entire monitoring project, an average of 1,891±62 lactating cows per day from Synergy Dairy contributed manure to the digester. The average daily loading rate of the digester was 80,408±19,266 gal, where the average percent of imported waste (mostly food-grade residues) co-digested with manure was 25±6% on a volume-to-volume (v/v) basis. The average reduction of organic matter thru the monitoring project was 42% with respect to the influent, while 75% of the odor-causing volatile fatty acids were reduced. In comparison, a previous monitoring study reported by the authors in five manure-based co-digestion operations showed a reduction in organic matter and volatile acids between 36% and 53% and 85% and 91%, respectively. The average daily digester biogas production for the entire monitoring project was 495±78 ft3 per 1,000 lbs of total influent added to the digester, or 173±34 ft3 per cow contribut ing to the digester. The engine-generator set produced an average of 23±7 MWh of electricity per day, from which the average daily parasitic load of the AD system was 3±1 MWh, accounting for approximately 14% of the electricity generated by the plant. Overall, the average capacity factor and online efficiency of the anaerobic digester system during the entire monitoring project were 0.66±0.22 and 80±23%, respectively. The electrical energy generated translated into an overall thermal conversion efficiency of 42±4%. Also, an additional 13±5% of the total energy in the biogas was recovered by the engine as hot water. Thus, an overall 55% (electrical + thermal) of the total energy contained in the input biogas was recovered by the engine-generator set during the monitoring project.

The majority of the challenges experienced by the Synergy AD system were of mechanical origin, whereas 20% were related to the biological process; only 8% of the downtime was due to scheduled systems maintenance. Some of the problems were related to the extreme cold conditions experienced in the Northeast during the period from December 2013 to February 2014. According to NOAA’s National Climatic Data Center, this period was the 34th coldest for the contiguous 48 states since modern records began in 1895, with an average temperature of 31.3F, 1.0F below the 20th century average (NOAA, 2014).

Future Plans 

This manure-based anaerobic digester is the 8th New York State digester we have extensively monitored and reported on. Near-term future planned work includes monitoring a lower cost horizontal plug flow digester on a 2,000-cow farm. This digester uses high density polyethylene (HDPE) material heat welded together as the digester vessel.

Authors

Curt Gooch, Senior Extension Associate, Cornell PRO-DAIRY Program cag26@cornell.edu

Rodrigo Labatut

Additional information 

A full report, written for the project sponsor, can be found on the Cornell PRO-DAIRY dairy environmental systems website, https://prodairy.cals.cornell.edu/environmental-systems/.

Acknowledgements

First and foremost, we wish to thank the Synergy Dairy Farm, Synergy Biogas, and CH4 Biogas for their collaborative efforts that made this project possible. We also like to thank the project sponsor, the Wyoming County (New York) Industrial Development Agency.

The authors are solely responsible for the content of these proceedings. The technical information does not necessarily reflect the official position of the sponsoring agencies or institutions represented by planning committee members, and inclusion and distribution herein does not constitute an endorsement of views expressed by the same. Printed materials included herein are not refereed publications. Citations should appear as follows. EXAMPLE: Authors. 2015. Title of presentation. Waste to Worth: Spreading Science and Solutions. Seattle, WA. March 31-April 3, 2015. URL of this page. Accessed on: today’s date.

Renewable Natural Gas – Biogas Cleaning and Upgrading 101

With depressed electrical prices for produced biogas, many projects are now moving towards business models predicated on production of renewable natural gas (RNG). In order to produce RNG, projects must first clean and upgrade raw biogas to pipeline and/or transportation fuel quality through the use of various engineering approaches. In this presentation, an overview of available and emerging biogas cleaning and upgrading technologies are discussed, highlighting positives, negatives and costs.  

Who Should Consider Biogas Cleaning?

The aim of this fact sheet is to provide farmers, third party project developers, regulatory agencies, and other stakeholders with a basic understanding of the chemical composition of renewable natural gas, the most appropriate end use options for dairy digesters, and some of the more common techniques used to clean biogas to RNG quality at dairy digesters.

What did we do? 

The authors utilized years of research and industry expertise as well as thorough literature search describe the concept of renewable natural gas and the technologies to clean the biogas. The authors aimed to provide information based on the current literature, but not to favor one technology over another.

What have we learned? 

When CHP is the end-use of biogas, the most common biogas purification approach for dairy digesters in the US is to remove water vapor and hydrogen sulfide. Existing projects use a variety of approaches, ranging from biological processes (both post digestion and via oxygen injection into the digester) to physical-chemical absorption processes such as iron type-sponge or activated carbon.

However, if RNG is the end-use a higher degree of purity is required. Often times a dedicated water vapor removal unit and hydrogen sulfide scrubbing unit is still required for removal of the bulk of the hydrogen sulfide mass. Thereafter, water scrubbing or PSA are often used to remove carbon dioxide from biogas, producing an RNG fuel that can be utilized in a variety of different ways. Other technologies exist, however their application on dairy digesters has been rather limited due to concerns related to maturity, cost, and complexity. The best technique is also situation-specific, and therefore, it is critical to understand the mechanics of each purification process, its limitations, and its economics before making a decision.

As electrical rates continue to drop throughout the PNW and US, current and new AD project developers are strongly considering a shift from CHP towards higher value end-uses for biogas, particularly RNG. Interest is increasing due to a growing CNG industry in the US, the decoupling of CNG and diesel prices, and the potential for competitive pricing and high revenues in comparison to fossil-CNG, given existing government incentives. Projects are presently limited and business models must still be proven before wide-scale adoption of biogas upgrading technologies within a dairy digester platform. In addition, concerns historically plaguing CHP projects, related to power purchase agreement pricing, interconnection fees, and scaling are still potentially present within a pipeline fuel model. Nonetheless, the potential exists for a new business model approach to AD projects on US farms.

Future Plans 

No future plans.

Authors

Craig Frear, Assistant Professor, Washington State University cfrear@wsu.edu

Nick Kennedy, Associate in Research WSU; Georgine Yorgey, Associate in Research WSU; Dan Evans, President Promus Energy; Jim Jensen, Associate in Research, WSU Energy; Chad Kruger, DIrector WSU CSANR

Additional information 

For those seeking additional detail, or information about other technologies, more comprehensive reports and reviews are available (Jensen, 2011; Krich et al., 2005; Ryckebosch et al., 2011). This publication is part of the Anaerobic Digestion Systems Series, which aims to provide information that improves decision-making for anaerobic digestion systems.

Acknowledgements

This research was supported by funding from USDA National Institute of Food and Agriculture, Contract #2012-6800219814; National Resources Conservation Service, Conservation Innovation Grants #69-3A75-10-152; Biomass Research Funds from the WSU Agricultural Research Center; and the Washington State Department of Ecology, Waste 2 Resources Program.

The authors are solely responsible for the content of these proceedings. The technical information does not necessarily reflect the official position of the sponsoring agencies or institutions represented by planning committee members, and inclusion and distribution herein does not constitute an endorsement of views expressed by the same. Printed materials included herein are not refereed publications. Citations should appear as follows. EXAMPLE: Authors. 2015. Title of presentation. Waste to Worth: Spreading Science and Solutions. Seattle, WA. March 31-April 3, 2015. URL of this page. Accessed on: today’s date.

Making Dairy Manure More Valuable Than Milk

Can Anaerobic Digestion Lead to Additional Revenue Streams On a Dairy Farm?

CowPots are the invention of necessity. Brothers Matt and Ben Freund are second generation dairy farmers in the northwest hills of Connecticut. In dairy farming, the most challenging job is to manage the nutrient stream in an environmentally sound manner. In 1997 the brothers installed a methane digester to heat the manure coming out of a cold barn to be able to separate the liquid year round for field application with a drag line system. This made the farm much more efficient and timely while at the same time reducing soil compaction and improving crop yields. The solids which are composted were first used for bedding the herd and are now used to mold the CowPots, whose value far exceeded bedding value. Farmers and gardeners have always considered cow manure a wholesome organic soil amendment for their crops. The challenge was to find a new and better way to get manure to these soils while maintaining value to consumers.

CowPots are a patented, environmentally friendly product made from the nutrient rich manure and are a vehicle for exporting the farm’s excess nutrients. Through production and sales of CowPots the Freunds have reduced the nutrient load on their farm by approximately 11% and have added a significant 2nd income to the dairy operation.

Examples of CowPots    Root Example

Emblems of sound stewardship, CowPots are the ideal product for farmers, growers, gardeners — and for the planet.

What did we do?

The idea for using manure solids to fashion a horticultural pot occurred in the mid 1990’s. The dairy farmer’s wife, Theresa owns a seasonal farm market and garden center adjacent to the dairy farm. Matt noticed that when his wife was tilling the soil each spring, the supposed biodegradable pots were still fully intact.

Confronting stricter regulations on nutrient management through state and federal rules, he needed an alternative to the status quo of storing and spreading manure on their 260+ cow dairy farm. Comparing the fibers found in the peat pots to the fibers of the manure solids, he brought his idea to the kitchen. In Matt’s spare time he began forming, pressing, pasting and molding manure fibers into pots (initially working in the greenhouse and using equipment from his wife’s kitchen and not wanting to get divorced, he moved outside to the farm shop). Nearly a decade was spent experimenting through trial and error.

In the mid 2000’s a production prototype was constructed in one bay of the farm shop where 4” pots were formed and placed by hand onto a drying oven. In 2006, CowPots worked with a local company to shrink wrap stacks of pots and sold them for resale at local garden centers and hardware stores in the tri-state area. That same year Freunds received an SBIR grant to further investigate the horticultural benefits of growing in CowPots. Concurrently, UConn and Cornell University conducted trials in greenhouse settings. In 2009, a standalone manufacturing facility was built and the lineup of sizes offered grew. Today the Freunds manufacture 12 size pots for horticultural uses as well as custom shapes for customers.

What have we learned?

Freunds have learned not all dairy fibers are the same. There are numerous activities on any farm which affect the characteristics of this material. Changes in feed, added minerals, digester upsets,composting temperatures, duration in the in-vessel composer and pasturing the herd have been the most influential on Freund’s farm.

Matt Freund with Product   CowPots

Future Plans

The Freunds had many goals one of which was not to have CowPots dictate the management of the dairy. Every bucket of manure fiber needs to be tested before it is used for production of CowPots. The equipment is adjusted in response to any changes.

Another goal was to design a production facility with no waste stream. Dry matter of the fiber is very important to achieve this goal. By having nothing but water vapor and finished product exiting the facility, permitting becomes much less difficult and our footprint becomes much smaller.

The CowPots manufacturing facility is fast approaching their production capacity with shifts that run 24/6. New automation in the packaging system will be installed in the coming months for a total of three robots in the facility. Currently, Freunds are putting together an expansion plan to include an additional production line. They are also working with a company in a similar business to look for synergies. Freunds are investigating other waste streams which could be blended with CowPots products to make the end product even better and at a reduced cost. Recently an engineer came on board to identify production inefficiencies within the manufacturing system to help reduce costs. As the market builds, Freunds will be looking for partners to work with in different areas of the country.

Author

Matt Freund, Owner/Inventor matt@cowpots.com

Additional information

http://cowpots.com/

https://www.youtube.com/user/CowPots

Acknowledgements

Northeast SARE, SBIR, USDA NRCS and Rural Development, CT Dept of Agriculture and CT Dept of Energy and Environmental Protection

The authors are solely responsible for the content of these proceedings. The technical information does not necessarily reflect the official position of the sponsoring agencies or institutions represented by planning committee members, and inclusion and distribution herein does not constitute an endorsement of views expressed by the same. Printed materials included herein are not refereed publications. Citations should appear as follows. EXAMPLE: Authors. 2015. Title of presentation. Waste to Worth: Spreading Science and Solutions. Seattle, WA. March 31-April 3, 2015. URL of this page. Accessed on: today’s date.

Composting of Dairy Manure and Grape Vine Prunings as a Tool to Better Manage Both Industries Waste and Reduce Their Environmental Impact


Why Look at Grapevine Prunings As a Compost Feedstock?

The objectives of this research and Extension project were:

  • To determine the impact of mixing grape vine prunings with dairy manure in a compost mix on the composting process and final product.
  • In particular, we were interested in determining if nitrogen gets fixated into the compost mix with increased carbon content.
  • To evaluate if composting is a workable alternative to annual grape vine prunings burning. Stopping this annual burning will reduce vineyards environmental footprint.
  • To demonstrate three different on-farm composting techniques. Mechanically turned (MT), passive aerated (PA), and forced aerated composting (FA).

What did we do?

field day at compost piles
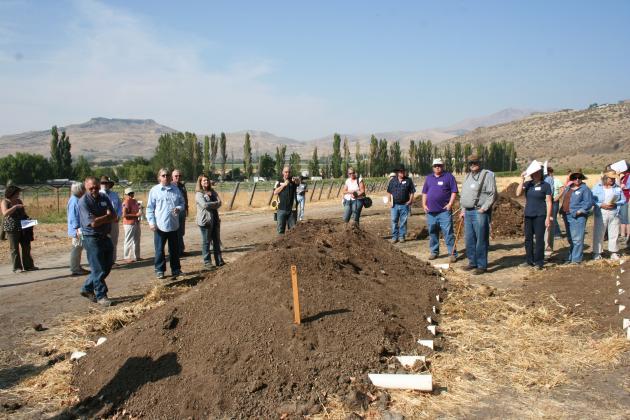
We teamed up with a grape and a dairy producer and we built a series of windrows to showcase the three different composting techniques and to research the effects of mixing both waste streams. Grape vine prunings were grounded and mixed with open lot dairy manure. Carbon content of the mix was adjusted to meet organic production standards since the vineyard hosting the project was certified organic. Since the carbon to nitrogen ratio (C:N) of the grounded grape vine prunings was on the low side (80:1), horse stable sawdust and straw from the local county fairgrounds were also used to help increase the C:N. Three replications of each system (MT, PA, and FA) were built with the enhanced carbon mix. A third set of three replications with dairy manure as received (some straw but no added carbon) were built using the mechanically turned system (MTMA) to serve as a control and comparison for that system. In addition to collecting data to evaluate th e effects of the added carbon, the project included two field days where all the systems, how to construct them, and their advantages and challenges were showcased.

What have we learned?

carbon to nitrogen ration
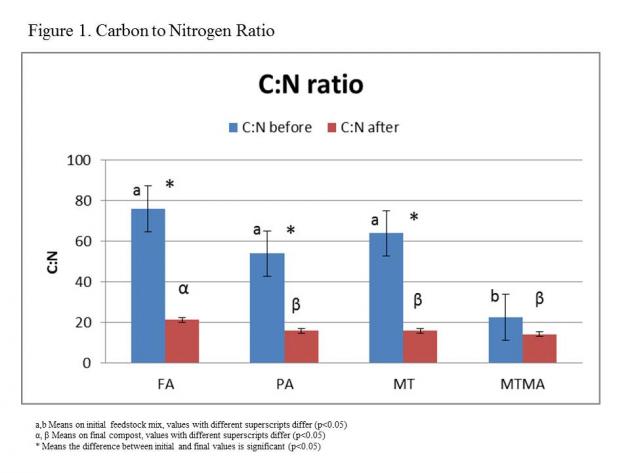
The initial feedstock mix C:N was significantly higher in the carbon enhanced windrows as expected, but the final C:N ratio of the compost was not significantly different among most systems and between the enhanced mix and the just manure mix (Figure 1). The C:N reduction between the initial mix and the final compost was significant in all systems of the carbon enhanced windrows, but not significant in the just manure mix (MTMA).

total nitrogenAs expected, the initial mix total nitrogen (TN) was significantly lower in the carbon (C) enhanced windrows compared to the just manure windrows (Figure 2). TN in the finished compost had no significant difference among all the systems. The difference between the initial mix and final compost TN wasn’t significant among C enhanced windrows, but highly significant in net values (10.08 Lb/T of N on dry weight basis; p<0.0001) on the just manure windrows. This difference in TN, coupled with the no significant difference in C:N, suggests the loss of nitrogen as ammonia during the composting process in the windrows made of just manure. Net nitrogen loss was significantly lower in the C enhanced windrows (1.45 Lb/Ton).

salts
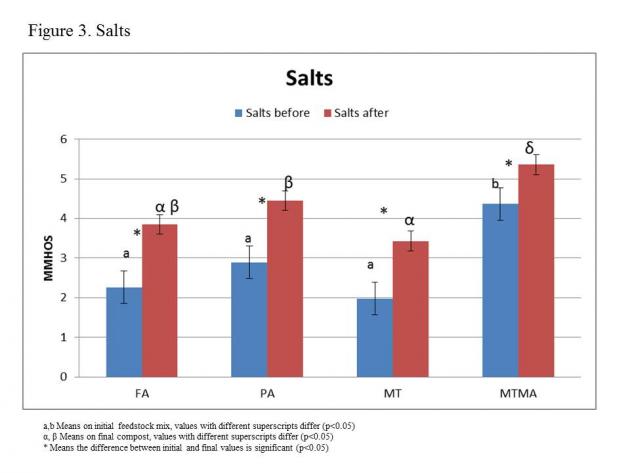
Salts concentrations (mmhos) difference between initial mixes and final compost was significant in all windrows, with higher values in the final compost as expected due to the concentration effect that composting volume reduction has (Figure 3). Salt concentrations in the just manure windrows were significantly higher compared to the carbon enhanced mix. There is a dilution effect when carbon is added in the initial mix (lower manure mass per initial mix unit). Similar dilution trends were observed for phosphorous (P), potassium (K), and micronutrients. Carrying this dilution effect in the final compost can be beneficial when land applying compost since application rates can be increased, increasing the nitrogen and carbon content of the application (desirable conditions) by the time the limiting components in our soils (usually P, K, or salts) are reached.

Screening of the carbon enhanced windrows generated a refuse (bigger size particles) containing pieces of grape prunings that can be used as mulch to control weeds in the vineyard or other production units. When PFRP is achieved, plant pathogens in the mulch can be considered absent or inhibited, and the mulch will be usable on the same or similar plant species.

The PA and MT windrows with enhanced carbon mix reached USEPA-PFRP. FA system didn’t reach PFRP and had an incomplete composting process because of the lack of moisture in the initial mix due to problems with water supply during their construction. Other studies conducted by the authors using FA with similar feedstock had reached PFRP. MTMA windrows didn’t reach PFRP, a common event in the region due to the low carbon content of dairy manure.

Future Plans

This project demonstrated that composting of dairy and potentially other livestock manures mixed with woody wastes from the grape industry or similar agricultural products is not only feasible but beneficial for both industries. Further research is necessary to determine how different carbon and animal manures sources, especially harder woods, will affect the composting process and the final product.

Authors

Mario E. de Haro-Martí. Extension Educator. University of Idaho. mdeharo@uidaho.edu

Mireille Chahine, Extension Dairy Specialist
Tony McCammon, Extension Educator
Ariel Agenbroad, Extension Educator. University of Idaho

Additional information

Unpublished data. Please contact the author, Mario E. de Haro-Martí at mdeharo@uidaho.edu or 208-934-4417.

Acknowledgements

The authors want to thank the participating grape and dairy producers for their collaboration. This project was funded by an Idaho USDA-NRCS Conservation Innovation Grant (CIG).

The authors are solely responsible for the content of these proceedings. The technical information does not necessarily reflect the official position of the sponsoring agencies or institutions represented by planning committee members, and inclusion and distribution herein does not constitute an endorsement of views expressed by the same. Printed materials included herein are not refereed publications. Citations should appear as follows. EXAMPLE: Authors. 2015. Title of presentation. Waste to Worth: Spreading Science and Solutions. Seattle, WA. March 31-April 3, 2015. URL of this page. Accessed on: today’s date.

Manure Technology Video Series


Can Video Be Used as a ‘Virtual’ Tour?

Producers are reluctant to adopt new technologies without firsthand experience with the technology. It is particularly difficult to get positive exposure for manure related issues in traditional media. Creative methods are needed to expose producers to useful technologies for handling and treating animal wastes. The OSU Waste Management Youtube channel was created to provide virtual tours of manure treatment and handling technologies.

What did we do?

Fourteen videos highlighting innovative manure handling and treatment technologies were filmed, edited, and produced by the Oklahoma Cooperative Extension Service. We specifically sought out producers who successfully adopted technologies to the particular conditions of their farms.

What have we learned?

In its five years of existence, the OSU Waste Management Youtube channel has been viewed more than 53,000 times (120,000 minutes viewed) from 183 countries and all fifty states – plus Guam, Puerto Rico and the District of Columbia.

Future Plans

We will continue to add new videos to the channel.

Authors

Douglas W. Hamilton, Associate Professor Oklahoma State University dhamilt@okstate.edu

Craig A. Woods, Video Producer/Director Ag Communication Services, Oklahoma State University

Additional information

https://www.youtube.com/user/OSUWasteManagement

The authors are solely responsible for the content of these proceedings. The technical information does not necessarily reflect the official position of the sponsoring agencies or institutions represented by planning committee members, and inclusion and distribution herein does not constitute an endorsement of views expressed by the same. Printed materials included herein are not refereed publications. Citations should appear as follows. EXAMPLE: Authors. 2015. Title of presentation. Waste to Worth: Spreading Science and Solutions. Seattle, WA. March 31-April 3, 2015. URL of this page. Accessed on: today’s date.

Technologies for Anaerobic Digestion of Flushed Swine Manure

Hog farmers face a unique challenge to implement digestion — namely the low volumetric methane yield of wet swine manure.  The most common digester used on hog farms using flushing systems is the covered lagoon.  This presentation explores the technical feasibility of high rate reactors for low solids swine manure.  Systems compared are Contact Stabilization Reactors, Upflow Anaerobic Sludge Blanket Reactors (UASB), Fixed Filmed Reactors, and Anaerobic Sequencing Batch Reactors (ASBR).  Contact Stabilization and UASB technology have been available since the 1970s, but are mostly found in industrial settings. Their main drawback for swine manure treatment is the required operator skill level.  UASB digesters also have difficulty handling the uneven solids flow from flushed or pull-plug barns.  Fixed film reactors have been successfully used in agriculture, but require solids separation before digestion.  The separator creates two waste streams and removes organic matter that could potentially be available for digestion.  ASBR technology was developed in the 1990s.  An ASBR digester was successfully operated at the Oklahoma Swine Research and Education Center in the 2000s.  Hydraulic retention time for this farm scale ASBR ranged between 5 and 20 days.  Maximum methane yield was 0.55 m3 CH4 kg-1 VS day-1.  Organic matter reduction efficiency was 50 to 75 % measured as Chemical Oxygen Demand (COD).  Current work on solids settling and retention will allow ASBR digesters to reach their full potential in swine production systems. Related: Treatment Technologies for Livestock Manure

Why Consider Anaerobic Digestion on Pig Farms?

Anaerobic digestion can reduce the carbon footprint of swine production, while substantially lowering the fossil fuel energy required to feed and raise hogs. However, economic analyses show that anaerobic digestion on swine farms using complete mix digesters to produce electrical energy have a net negative present value unless carbon credits in the price range of $10 to $12 per metric ton of CO2eq are given for methane emissions reduced (Cowley, 2015). The two factors negatively affecting the economic viability of complete mix digesters are high capital cost and relatively low biogas output of reactors. Capital cost of digesters is directly related to the hydraulic retention time (HRT) of reactors. Farm-scale complete-mix digesters treating swine manure have retention times ranging from 18 to 30 days (Fisher, et al., 1979; Schulte, et al., 1985; Zhang, et al., 1990). Methane yields of these digesters was between 0.22 to 0.25 m3 CH4 kg-1 V S, and reactor volumetric efficiencies ranged between 0.35 to 0.40 m3 CH4 m-3 reactor day-1.

What did we do?

High rate digesters are reactors that separate solids retention time (SRT) from HRT. High rate reactors shorten HRT, which results in smaller, less costly digesters. High rate digesters also have higher methane yields than complete mix reactors. Several high rate systems have successfully treated swine manure at the laboratory and pilot scale. Systems tested include fixed film, suspended particle attached growth (SPAG), and upflow anaerobic sludge blanket (UASB) reactors treating the liquid portion of swine manure after solid-liquid separation; and contact stabilization, anaerobic sequencing batch (ASBR), and anaerobic baffled (ABR) reactors treating whole, diluted swine manure. ASBR systems have used both single reactor and multiple reactors in series. Despite the success of laboratory studies, few farm-scale high rate reactors exist on the farm scale.you

What have we learned?

A 400 m3, single vessel ASBR was operated for two years on a 128 sow farrow-to-finish hog farm at the Oklahoma State University Swine Research and Extension Center. (Hamilton and Steele, 2014) . Methane yield was 0.55 m3 CH4 kg-1 VS, and COD removal efficiency was 73% when operated at a 20 day HRT with operating temperature ranging between 22 and 32oC. Methane yield was 0.38 m3 CH4 kg-1 VS and COD removal efficiency was 57% when operated at a 5 day HRT with operating temperature between 22 and 24oC. The digester, as built, was 4 times larger than it needed to be. Using microbial kinetic modeling, the volumetric efficiency of a 100 m3 digester operating at 5 day HRT was estimated to be 0.73 m3 CH4 m3 reactor day-1.

Future Plans

Further work with ASBR digesters is underway. We are working to improve the mixing, settling, and solids trapping efficiency of the ASBR. ASBR reactors are also highly adaptable to receive high energy low solids digestion co-products. Pilot testing has shown volumetric efficiency of swine manure ASBR can be increased 4 to 6 fold with augmentation with waste glycerol from biodiesel production.

Author

Douglas W. Hamilton, Associate Professor at Oklahoma State University

dhamilt@okstate.edu

Additional information

Cowley, C. 2015. Economic Feasibility of Anaerobic Digesters with Swine Operations. Unpublished Thesis. Stillwater, OK: Oklahoma State University.

Fisher, J.R., N.F. Meador, D.M. Sievers, C.D. Fulhage, and E.L. Iannotti. 1979. Design and operation of a farm anaerobic digester for swine manure. Trans ASABE 22(5):1129.

Hamilton, D.W. and M.T. Steele. 2014. Operation and performance of a farm-scale anaerobic sequencing batch reactor treating dilute swine manure. Trans ASABE. 57(5):1473.

Schulte, D.D., Kottwitz, T.J. Siebenmorgen. 1985. Design and operation of a flexible cover, precast concrete anaerobic digester for swine manure. Pp 509-515, in Agricultural Waste Utilization and Management, Proceedings of the 5th International Symposium on Agricultural Wastes. St Joseph, MI: ASABE.

Zhang, R.H., J.R. North, and D.L. Day. 1990. Operation of a field-scale anaerobic digester on a swine farm. Applied Engineering in Agriculture. 6(6):771.

The authors are solely responsible for the content of these proceedings. The technical information does not necessarily reflect the official position of the sponsoring agencies or institutions represented by planning committee members, and inclusion and distribution herein does not constitute an endorsement of views expressed by the same. Printed materials included herein are not refereed publications. Citations should appear as follows. EXAMPLE: Authors. 2015. Title of presentation. Waste to Worth: Spreading Science and Solutions. Seattle, WA. March 31-April 3, 2015. URL of this page. Accessed on: today’s date.

Field Scale Management of Separated Dairy Manure Fractions


Why Look at Separated Manure for Crops?

Research at Pacific Agriculture Research Centre (PARC) by Agriculture and Agri-Food Canada (AAFC) in Agassiz, B.C. has shown that targeted application of separated liquid and thicker sludge fractions from dairy manure slurry on grass and corn, respectively, can improve crop nutrient efficiencies, reduce the requirement for commercial fertilizer, and reduce nutrient losses to the environment. These benefits are in comparison to the traditional practice of surface broadcast application of agitated raw slurry manure. More specifically, the liquid fraction, applied via surface banding to grass fields, helps to improve infiltration, reduces ammonia emissions, and improves grass yield and nitrogen recovery. The thicker sludge fraction, which contains more phosphorus, is precision deep injected, then planted with corn near or over the injection furrows. This replaces the need for commercial phosphorus fertilizer normally applied as a starter during corn planting. The sludge fraction is obtained from sedimented slurry.

precision manure injector and tractorThe overall objective of our two year project is to assess these improved manure application practices at the farm scale through various sub-objectives. First, sedimentation efficiency is being evaluated on farms with contrasting manure management by sampling liquid storages at various depths prior to agitation. The goal is to assess natural stratification of nutrients under different bedding and water management, and to assess the practicality of sequentially pumping the thin supernatant (late Mar- early Apr) and thicker sludge (late Apr- early May). Second, improved equipment is being developed to precision deep inject slurry sludge (6 – 11% dry matter) prior to corn planting. Third, on-farm field scale trials using improved manure application equipment are assessing the agronomic and economic benefits of managing separated dairy manure fractions, compared to the traditional practice of surface broadcasted agitated raw manure.
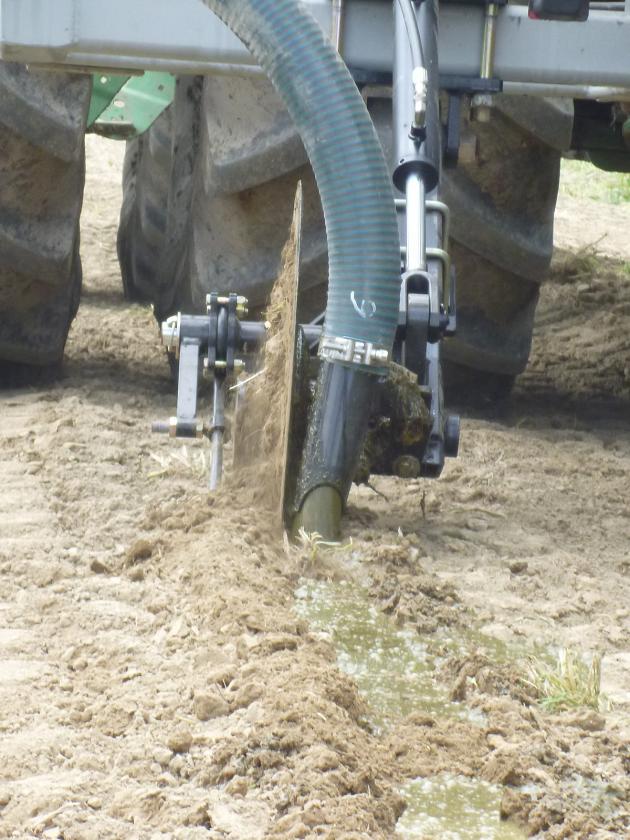
precision maure injector in useWhat did we do?

We have completed one year of this two year project. Progress has been made on all three sub-objectives, but most notably on the first. Under the first sub-objective we have sampled manure at various depths for 18 liquid manure storages, and collected management information on bedding management and water inputs into these storages.

We also utilized a custom manure operator to mount a farm scale 4 row deep manure injector onto a dragline system. This was used to precision deep inject thicker dairy sludge and compare with traditional surface broadcast application and incorporation, prior to corn planting on a farm field near Agassiz, B.C. On this same farm a different custom manure operator applied thinner dairy slurry on a grass field using first a shallow disc injector and then a trailing hose. These two treatments were compared with the farmer’s surface broadcast application.

These manure applications on grass occurred two times, once in March and once in May. While it would have been preferable to use agitated raw manure for the farmer’s surface broadcast application on both grass and corn, this is not feasible when managing a farm’s manure supply from a single storage system. Rather the same manure sources, ie. thin slurry on grass and thicker sludge on corn, were used for all application treatments, including the farmer’s broadcast application.

the plots where the precision manure injector study was performedWhat have we learned?

Average nutrient content of liquid manure in storages varied greatly between farms, ranging from 0.58 to 2.80 kg/m3 for total nitrogen and 0.17 to 1.51 kg/m3 for total phosphorus (expressed as P2O5). These nutrient values were closely correlated with dry matter content, which ranged from 0.58 to 10.02%. Variation in dry matter content is determined primarily by the amount of water inputs into the manure storage, the amount of organic bedding imported onto the farm, and whether the raw manure undergoes a mechanical solid/liquid separation process prior to the liquid manure entering the storage.

Seven out of 18 storages had little or no sedimentation of solids or nutrients. Four storages showed slight stratification and the remaining seven storages had considerable settling of solids and nutrient concentration increasing with depth. For storages with considerable stratification average dry matter content ranged from 1.5% for the shallowest depths to 7.7% for the deepest depths. For these same depth positions average total nitrogen increased from 0.090% to 0.193%, and average total phosphorus from 0.015% to 0.041%. Preliminary assessment of manure sample analysis compared to manure management practices suggests that sedimentation of solids and nutrient stratification is minimal or reduced when coarse solids are mechanically separated from liquid manure prior to entering storage, and/or there is considerable disturbance of manure when transferring it from the barn into the manure storage. For example, manure pumping involves more disturbance than scraping.

Preliminary results from land applied manure suggest small but likely insignificant increases in dry matter yield for trailing hose and shallow injection on grass compared to surface broadcast manure. On corn land there was no difference in yield between deep injected and surface broadcast/incorporated dairy sludge. Part of the reason for little or no difference is due to using the same manure source and application rate for all treatments. Also, the corn land result may be due to the majority of nutrients for both treatments being supplied by another source, surface broadcast poultry manure.

Future Plans

In the winter of 2015 most liquid manure storages will be resampled. An additional 5 liquid manure storages have been chosen for sampling in 2015, to include some manure management systems not accounted for in 2014. Our 4 row deep manure injector is being modified to a 6 row unit. This will enable easier alignment of the manure furrow with subsequent 6 row corn planter. We plan to add two more farm sites to land apply separated manure fractions on grass and corn, for the 2015 growing season.

Authors    

Dennis Haak, Senior Soil Resource Specialist, Agriculture and Agri-Food Canada dennis.haak@agr.gc.ca

Shabtai Bittman, Research Scientist, Agriculture and Agri-Food Canada; Derek Hunt, Biologist, Agriculture and Agri-Food Canada

Additional information             

1. Precision Placement of Separated Dairy Sludge Improves Early Phosphorus Nutrition and Growth in Corn (Zea mays L.), https://dl.sciencesocieties.org/publications/jeq/abstracts/41/2/582

2. Removing Solids Improves Response of Grass to Surface-Banded Dairy Manure Slurry: A Multiyear Study, https://dl.sciencesocieties.org/publications/jeq/abstracts/40/2/393

The authors are solely responsible for the content of these proceedings. The technical information does not necessarily reflect the official position of the sponsoring agencies or institutions represented by planning committee members, and inclusion and distribution herein does not constitute an endorsement of views expressed by the same. Printed materials included herein are not refereed publications. Citations should appear as follows. EXAMPLE: Authors. 2015. Title of presentation. Waste to Worth: Spreading Science and Solutions. Seattle, WA. March 31-April 3, 2015. URL of this page. Accessed on: today’s date.

Economics of Nitrogen Sources and Rates in a Long Term Cropping System

Purpose

The main goal of the study is to determine the singular or combined effects of crop rotation, tillage system, N fertility levels and sources on crop grain and biomass production, crop diseases, and soil attributes (nitrogen, phosphorus, organic matter and pH). Secondly, our goal is to assess the economics of some of the crops grown in the experimental area during the period of time from 2008-2014. The results presented in this summary show that composted manure can replace commercial fertilizer applications in a crop rotation system, maintaining the same level of yields and increasing profits during a 7-year period. Related: Manure value & economics

What did we do?

In 1987, a long-term cropping system study was initiated at the North Dakota State University (NDSU) Carrington Research Extension Center (CREC). The study takes place on approximately 40 acres and consists of cycles of three, 4-year crop rotations with three replicates. The base rotation is hard red spring wheat (HRSW) – sunflower – barley – soybean. Other rotations are composed of HRSW – field pea – corn – soybean and HRSW – corn – soybean – canola. Each crop within each rotation is planted every year. Tillage treatments (conventional tillage-CT, minimum tillage-MT and no-tillage-NT) are imposed along the north-south direction and fertility treatments (nitrogen rates and sources) are imposed along the east-west direction. Nitrogen sources are urea (applied each spring to non-leguminous crop plots at 0, 50, or 100 lbs of N/ac) and composted beef feedlot manure (applied once in the spring at a rate of 200 lbs of N/ac on the first year of each cycle).

The crops (barley, corn, field peas, soybean and HRSW) and period of time (from 2008 to 2014) were selected based on data available to compute production costs (tillage, fertilizer, seeds, chemicals, seeding, combining, overhead and land) and gross return (crop yields and prices). Due to a lack of protein data, barley and HRSW from 2008 were not included in the calculations. The economics were calculated based on two scenarios for the composted manure treatment: Scenario 1 (CompSCN 1) – the producer owns the compost and the only cost associated with it is the application cost; Scenario 2 (CompSCN 2) – the producer pays for each unit of N in the compost the same price paid per unit of N as commercial fertilizer. Barley was graded according to its protein content as feed (protein >12%) or malting barley (protein ≤12%). For HRSW, we used an average discount of $0.08/bu for each 1/5% of protein lower than 14% across all years.

What have we learned?

Figure 1. Average (2008-2014; 2009-2014 for barley and HRSW) yield3 (left) and net income (right) for crops in a long term cropping system at the NDSU Carrington REC, Carrington, ND. 0,50, and 100 N represent, respectively, 0, 50 and 100 lbs of N/ac. COMP

Figure 1. Average (2008-2014; 2009-2014 for barley and HRSW) yield3 (left) and net income (right) for crops in a long term cropping system at the NDSU Carrington REC, Carrington, ND. 0,50, and 100 N represent, respectively, 0, 50 and 100 lbs of N/ac. COMP/MAN= composted manure. MT= minimum tillage; NT= no tillage; CT= conventional tillage. CompSC1 and CompSC2 are compost manure scenarios 1 and 2, respectively. Averages followed by the same letter are not significantly different (Tukey Test, p=0.05). 1 Protein content: >12%= feed barley, <=12%= malting barley. 2 Wheat protein discount= $0.08/bu per 1/5 below 14%. 3 Provisional data.

Barley and corn yields were increased by nitrogen application, but there was no response to either N rates or source across the tillage systems (Figure 1). The field pea and soybean yield differences between the sources of N (Figure 1) was likely due to composted manure application every four years (2007 and 2011) regardless of the crop growing on those plots, while N fertilizer is applied only to non-leguminous crops. The composted manure (COMP/MAN) treatment produced similar HRSW yields to the highest N rate (100 lbs N/ac) treatment under no-till and conventional tillage and it was out yielded by the same treatment under minimum tillage.

The CompSC1 was the most profitable treatment across the tillage systems for the majority of the crops, except for HRSW. Similar results were seen even when the compost was paid for based on its N content (CompSC2). The lower income for barley with 100 lbs N/ac was due to the high protein in the kernel (feed barley=lower selling price). For HRSW, the CompSC1 treatment showed lower net income than the highest N rate under minimum tillage and higher net income under the other two tillage systems, while the CompSC2 treatment showed much lower income than the other N treatments. The higher income when using composted manure is due to both similar yields and lower production cost when using that product in comparison with the other N treatments. Protein content in HRSW was lower when using composted manure, which resulted in large protein discounts, which were over $50/ac in some cases.

Future Plans

In the future, we would like to investigate strategies for N application during the wheat growing season to boost protein content and net income per acre in areas fertilized with fresh feedlot manure.

Authors

Paulo Flores, Nutrient Management Specialist at NDSU Carrington Research Extension Center, paulo.flores@ndsu.edu.

Ezra Aberle, Research Specialist – Crop Systems at NDSU Carrington Research Extension Center

Additional information

For more information about the field research conducted on the long term cropping system, described on this summary, you are welcomed to contact Ezra Aberle (ezra.aberle@ndsu.edu) at the Carrington Research Extension Center (CREC, Phone: 701.652.2951). For more information about this summary please contact Paulo Flores (paulo.flores@ndsu.edu) at the CREC.

The authors are solely responsible for the content of these proceedings. The technical information does not necessarily reflect the official position of the sponsoring agencies or institutions represented by planning committee members, and inclusion and distribution herein does not constitute an endorsement of views expressed by the same. Printed materials included herein are not refereed publications. Citations should appear as follows. EXAMPLE: Authors. 2015. Title of presentation. Waste to Worth: Spreading Science and Solutions. Seattle, WA. March 31-April 3, 2015. URL of this page. Accessed on: today’s date.


Wisconsin Professional Manure Applicator Education

Why Look at Manure Applicator Educational Programs?

Based on 2013 statistics, Wisconsin has a dairy herd of 1.2 million cows that produce 12,000,000,000 gallons of manure and waste water. Custom manure haulers in Wisconsin handle an estimated fifty percent of the dairy manure and forty per cent of all livestock manure generated in Wisconsin. Because custom manure applicators are a critical component of nutrient management plan (NMP) implementation, University of Wisconsin Extension initiated manure hauler education across the state in the early 1990’s. In 2000, the applicators sought UW – Extension advisory support in forming the Professional Nutrient Applicators Association of Wisconsin (PNAAW). This began a long term relationship between UW – Extension and the professional applicators in Wisconsin and across the upper Midwest.

Following a needs assessment of the industry, the board of directors of PNAAW expressed an interest in a voluntary training and certification program. The overall goal of the training was to educate the custom manure haulers and their employees in safe handling and application practices, spill response, regulations and nutrient management. Road safety, neighbor relations, and confined space safety education modules were added later.

What did we do?

In March of 2002, the board of directors of the PNAAW and a group of Michigan manure applicators independently approached Extension in each state to initiate a voluntary certification and training program. Over the next 5 months, applicators and Extension staff examined the 5 existing manure applicator certification programs and created the program currently in use in Wisconsin, Illinois and Michigan.

Field photo 2012

Manure expo 2012, checking out a new dragline applicator.

The UW – Extension Nutrient Management Team’s Custom Manure Hauler Workgroup joined with Extension faculty in Illinois and Michigan to develop a three-state certification program with three levels of training/certification. The certification includes a partnership with the insurance industry to provide a market-based incentive to participate. Business and employee management issues are addressed during an annual multi-state regional symposium coordinated by UW-Extension.

Certification: The program is segmented into three certification levels. Firms must meet level 1 requirement to gain level 2, and meet level 2 requirements to achieve level 3.

  • Level 1: Requires each employee to be trained and tested on spill response techniques, state specific regulations (including CAFO regulations) and common sense application techniques. Firms that document compliance are eligible for a 10% vehicle liability premium reduction. Training is ~3 hours in length and is completed annually.
  • Level 2: Requires crew supervisors and business owners to attend 6 hours of continuing education over a 2 year period. Classes are offered at field days and the annual conference. Once a firm has achieved Level 2, they may conduct Level 1 training in-house.
  • Level 3: Develop and implement an EMS (Environmental Management System). The EMS requires the firm to document their process and ensure all employees know their job responsibilities. Insurance auditors will evaluate each firm’s EMS annually to insure compliance. Premium reductions include 10-40% on vehicle liability and 50% on environmental liability.

Not your typical Wisconsin “boat” show. PNAAW 2014 manure boat agitation demonstration, organized with UW-Extension.

All certification levels also require that the firm complete the PNAAW Performance Standards Checklist at least once per year.

Membership in the state’s applicator association is required for certification, as certification is granted by the association and not by Extension. Each state association may also require additional performance standards, such as documentation of equipment calibration, to grant certification.

One area of continuing education began in 2002, when UW – Extension with permission from Wisconsin Department of Natural Resources (WDNR), conducted manure spill response training using actual manure. The basic educational focus was containing, controlling, cleaning up, and then meeting reporting requirements of a spill. Since 2002, 20 live action demonstrations have occurred. Training has expanded to include calibrating of manure equipment and determining manure application rate per acre.

What have we learned?

PNAAW requested that Extension assist in filling an educational need not met by current farm shows – being able to compare different manure agitation and application equipment side by side in the field (using actual manure) to help determine which best meets individual needs. The result was the first Manure Expo in August 2001, which drew 432 people from 5 states and Canada.

The Manure Expo has grown to an annual 2-day educational and demonstration event. 2015 is the 13th Expo; the event has been hosted by Extension and custom applicators in Wisconsin, Michigan, Minnesota, Ohio, Iowa, Missouri, Nebraska, and Pennsylvania in the US and Guelph, Ontario, Canada. An average Expo will draw over 1,000 people from industry, university, farm, and application professionals.

PNAAW 2014

PNAAW 2014

The pit before the boat demonstration begins 2014.

The voluntary certification program has saved Wisconsin and Michigan over $100,000 annually because regulatory mandates require state finances for staff and office to run mandated programs. In addition to the sharing of curriculum in multiple Midwestern universities the training and educational sessions are a success in the formation/enhancement of three state associations in Michigan (now inactive), Pennsylvania, and Indiana/Ohio.

Applicator and industry partnerships contributed to a multi – state agriculture weight study based at the Minnesota DOT/University of Minnesota, MN Road Research Center. Over $640,000 was pooled from applicators and Applicator Associations (WI, MI, MN, IA, and OH), industry and agencies to fund research on the impact of larger manure hauling and agriculture equipment on pavement.

Custom manure applicators are a key component in the environmental application of manure. The Wisconsin Department of Agriculture, Trade, and Consumer Protection (DATCP) has tracked crop acres managed with a NMP. In 2004, 0.7 million crop acres were managed using a NMP; in 2014 the NMP managed acres increased to 2.58 million acres in Wisconsin.

Future Plans

Each year a new need will arise. Education will be provided for employee relations, business planning, family/work balance and the need to review new technology. A few projects that began in 2014: manure boat agitation field day and precision manure application. Education will be developed in the future as a need arises from the manure application industry.

Authors

Richard Halopka, CCA, Clark County UW-Extension Crops & Soils Agent richard.halopka@ces.uwex.edu

George Koepp, Columbia County UWEX Agriculture Agent, Jerry Clark,Chippewa County UWEX Crops/Soils Educator, Ted Bay, Grant County UWEX Crops/Farm Management Agent, Kevin Erb, UWEX Conservation Professional Devp. & Training Cord., Becky Larsen, UW Biowaste Specialist, Jim Leverich, UW On Farm Research, Kim Meyer, UW Arlington ARS, Cheryl Skjolaas, UW Agriculture Safety Specialist

Additional information

In 2014, over 400 custom manure applicators in Wisconsin were certified in at least one level of the program. Eight PNAAW member application firms revised their level 3 status in 2013 and are saving $44,000 annually on pollution insurance policies, while PNAAW firms achieving level 1 and level 2 certification reduced pollution insurance policies premiums by an additional $78,000 per year.

The collaboration of PNAAW, University of Wisconsin Extension, University of Wisconsin Specialists, WDNR, DATCP and UW – Extension County Agents has provided the foundation of a proactive approach to education and training, leading to problem solving results from a knowledgeable application industry.

https://www.facebook.com/pages/category/Nonprofit-Organization/Professional-Nutrient-Applicators-Association-of-Wisconsin-2223955430983054/  

2009 U.S.A. water quality poster, manure spills

2009 U.S.A. water quality poster, manure spills

Bulletin for manure spill response developed by UW-Extension nutrient management team PNAAW workgroup.

The authors are solely responsible for the content of these proceedings. The technical information does not necessarily reflect the official position of the sponsoring agencies or institutions represented by planning committee members, and inclusion and distribution herein does not constitute an endorsement of views expressed by the same. Printed materials included herein are not refereed publications. Citations should appear as follows. EXAMPLE: Authors. 2015. Title of presentation. Waste to Worth: Spreading Science and Solutions. Seattle, WA. March 31-April 3, 2015. URL of this page. Accessed on: today’s date.

Fertilizer Value of Swine Manure: A Comparison of a Lagoon and a Deep Pit Slurry System

Why Compare Liquid and Slurry Systems for Pig Production?

Since 2000 the cost of fertilizer has more than doubled. According to information provided by the USDA Economic Research Service (2013), the national average price per pound of N has increased between 2000 and 2012 by a factor of 2.6. Over the same time period, phosphate price increased by a factor of 2.8, and potassium price increased by a factor of 4.0. As a result, fertilizer costs now contribute 30% to 40% of the annual variable costs to grow many cereal grains. Table 1. Fertilizer price
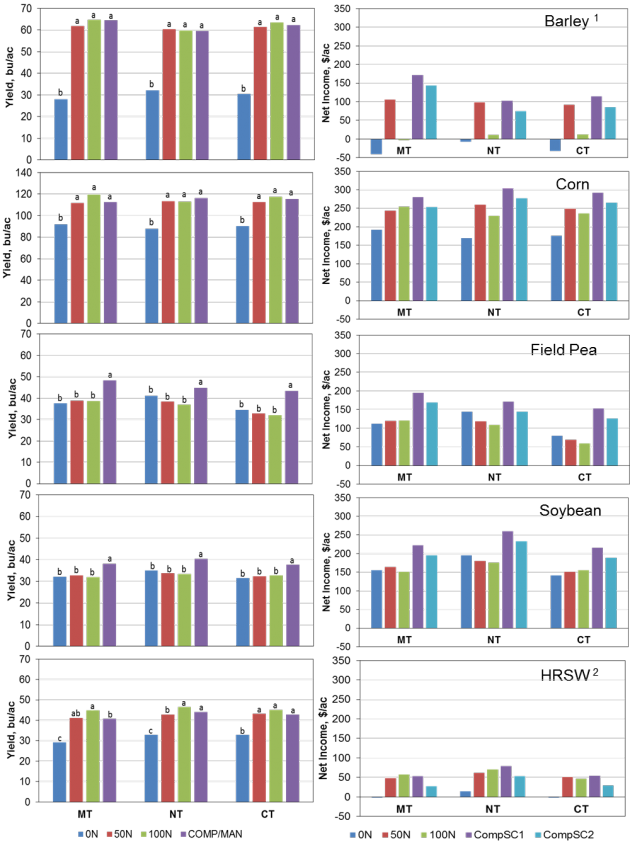
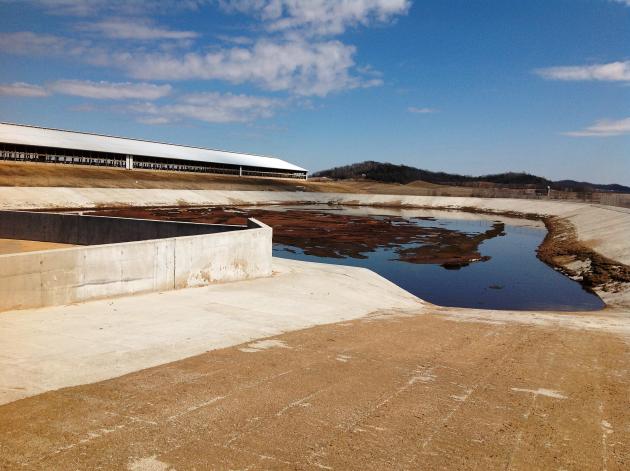
During the same time period environmental regulations have greatly decreased the construction of swine finishing facilities that use liquid manure handling systems that require the use of a lagoon or storage pond. In response to these economic and regulatory realities, some swine production companies are considering the use of deep pit slurry systems instead of an outdoor lagoon or storage. Benefits of the deep pit slurry system include the exclusion of rainfall, reduction in storage visibility, and conservation of valuable major plant nutrients (N, P, K) for the purpose of reducing production costs for feed grains. The objective of this presentation is to compare the fertilizer value of the manure produced from swine finishing barns that use a liquid manure handling with a treatment lagoon, and swine finishing barns that store manure below slotted floors in pits.
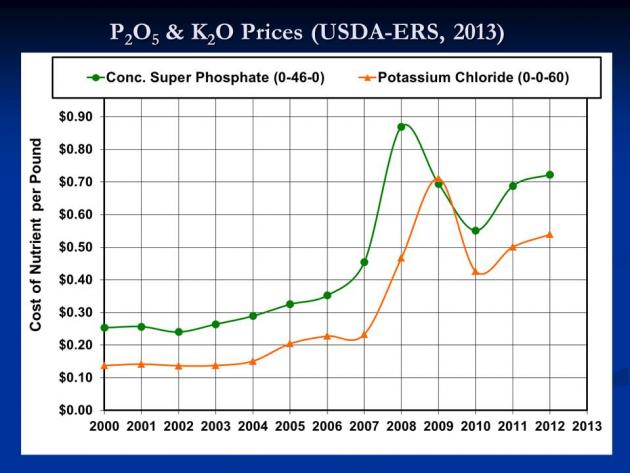
Table 2. Fertilizer priceWhat did we do?

Plant nutrient content and volume data were collected from a swine finishing farm that used a lagoon treatment system. The system was designed to provide storage of manure, anaerobic treatment of volatile solids, and storage for sludge for 3520 pigs. Treated lagoon surface water (total solids = 0.5%) was recycled through the four buildings to provide water to remove manure from the building using a pull-plug, pit-recharge design. Lagoon surface water was applied to nearby cropland annually to provide all major plant nutrients using traveling gun irrigation. Data were also collected concerning the plant nutrient content of lagoon sludge, and sludge volumes were estimated using the ASABE Standard (2011).

Image of barn
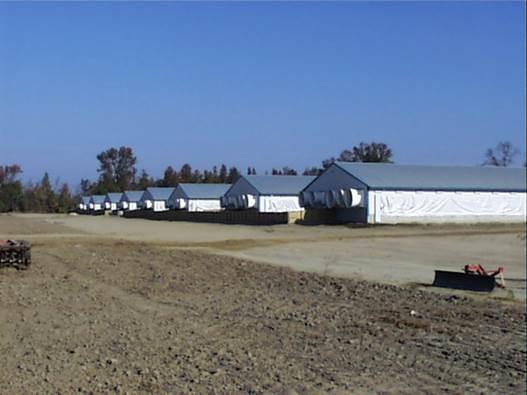
The realized value of swine manure was calculated for using lagoon water, and sludge to provide all or a portion of the N, P2O5, K2O used by corn based on typical crop needs. Only the portion of plant nutrients that met the recommendations was assigned value. No value was assigned to major plant nutrients applied in excess of plant uptake. The value was assigned based on price data obtained from USDA-ERS (2013). The prices used were $0.71/lb of N, $0.69/lb of P2O5, and $0.50/lb of K2O.

Two application rates were calculated for lagoon water. The first rate was to provide the N needs for corn and the second was to provide the P2O5 needs of the crop. The pounds of N, P2O5, and K2O applied per acre were determined and the value of the nutrients that met the fertilization rates was calculated.

Lagoon sludge (total solids = 10%) contained 4 times as much P2O5 as plant available N (PAN) per 1000 gallons (47.3 lb P2O5/1,000 gal vs 11.7 lb PAN/1,000 gal). Therefore, the only sludge application rate used was the rate needed to meet the fertilizer recommendation for P2O5. The realized value of the sludge was determined in the same way as for lagoon water.

Diagram lagoon system for finishing swineWhen lagoon water was applied to supply the N needs of one field, and sludge was applied to meet the P2O5 needs of another field the realized value of swine manure was $5.69 per hog-space per year. Application of lagoon water and sludge to meet the P2O5 needs of corn increased the annual value of manure to $6.64 per hog-space.

The analysis was repeated for the same size farm using volume and nutrient data for deep pit barns that provided 1 year of storage for swine slurry (total solids = 7.5%). The realized economic value of deep pit slurry was also calculated based on application of slurry, using direct injection, to meet the N and P2O5 needs of corn with the same price assumptions as for the lagoon system. The results indicated that spreading deep pit slurry based on the agronomic rate for N provided a realized manure value of $24.35/hog-space/yr. Application of slurry based on the agronomic rate for P2O5 yielded a manure value of $28.95/hog-space/year.

What have we learned?

Treatment lagoons were originally designed to provide treated water used to remove manure from flush or pit-recharge swine buildings. However, little consideration was given to the value of the N lost or the value of P and K. Essentially, lagoons provided the treatment needed for recycled flush or pit-recharge systems, but they wasted nitrogen that could be used to off-set fertilizer costs.

Over the last decade, fertilizer prices have increased greatly, and continue to fluctuate. As a result, the nutrients lost by manure treatment are now viewed as a valuable input for production of feed grains.

Using a deep pit barn eliminated the need for manure treatment and allowed plant nutrients to be stored until needed. It was estimated that a deep pit slurry system would allow a producer to increase nutrient value per hog-space by a factor of 4.3 from $6.68 to $28.95/hog-space per year. On a 4-house farm that provided housing for 3520 hogs the annual manure value may be as high as $101,920 per year.

Future Plans

The results from this study are being used to develop extension programs for swine producers. Information is being used to help plan farms and to encourage integration of swine and feed grain production.

Author

John P. Chastain, Ph.D., Professor and Extension Agricultural Engineer, Clemson University jchstn@clemson.edu

Additional information

Reference Cited

ASABE (2011). ANSI/ASAE EP403.4 FEB2011 Design of Anaerobic Lagooons for Animal Waste Management. In ASABE STANDARDS. ASABE, 2950 Niles Rd., St. Joseph, MI 49085-9659.

USDA-ERS (2013). Fertilizer Use and Price. United States Department of Agriculture, Economic Research Service. Available at: http://www.ers.usda.gov/data-products/fertilizer-use-and-price.aspx.

Acknowledgements

Support for this work was provided by the Confined Animal Manure Management Program of Clemson Extension, Clemson University, Clemson, SC.

The authors are solely responsible for the content of these proceedings. The technical information does not necessarily reflect the official position of the sponsoring agencies or institutions represented by planning committee members, and inclusion and distribution herein does not constitute an endorsement of views expressed by the same. Printed materials included herein are not refereed publications. Citations should appear as follows. EXAMPLE: Authors. 2015. Title of presentation. Waste to Worth: Spreading Science and Solutions. Seattle, WA. March 31-April 3, 2015. URL of this page. Accessed on: today’s date.