Gypsum products created from construction industry waste streams provide low-input cost bedding. Some dairies report decreased somatic cell counts in milk with its use.
Recently, several incidents involving human and livestock death or injury have highlighted the possible creation of dangerous gases at farms using gypsum bedding. Human lives were lost at two separate events. In a third incident, a 2-year old and 4-year old were found unconscious adjacent to a manure storage where gypsum was present. In the European Union (EU) several agencies have forbade the use of gypsum as bedding based on losses of livestock as well as previous policies that restricted gypsum from landfill disposal.
Gypsum is a common term for hydrated calcium sulfate (CaSO4¬-2H2O). It is suspected that under the right manure storage conditions anaerobic bacteria convert the sulfur (S) in gypsum to hydrogen sulfide (H2S), a gas that can be deadly. Movement such as agitation of manure can lead to large H2S fluxes and localized dangerous levels of the gas.
While this is concerning, there remain many farms that utilize gypsum without incident. Data on this subject are lacking.
The goal of this symposium presentation is to update attendees on this ‘current event’ in manure management. Some laboratory studies are expected to complete between the time of this abstract composition (October 2012) and the symposium date. A general outline of the presentation includes:
Recap of cases leading to concern with this product
Policies of the EU and US
Industrial standards for dangerous H2S levels (OSHA and other)
Biological and chemical avenues of H2S production
Research review of gypsum use in manure
Recommendations for safety, management and education.
Why Are We Concerned About Gypsum Bedding on Dairies?
The goal of this ‘current event’ presentation is to increase national awareness of several deaths and severe injuries that have occurred recently in the Mid-Atlantic area involving manure gases. Several dairies where incidents occurred use gypsum from recycled drywall as low cost bedding material. There is great concern that gypsum increases dangerous hydrogen sulfide emissions from manure storages at these farms.
What Did We Do?
Recent deaths and severe injuries near manure storages highlight the importance of understanding and outreach needs. An overview of incidents involving manure gases at dairies that bed with gypsum will be given. Concerns and risks will be discussed, followed by recommendations on how to prevent incidents.
What Have We Learned?
In a true first step to determine gas productions associated with gypsum in manure preliminary bench-top scaled comparisons of manures with and without gypsum are ongoing in Pennsylvania and Wisconsin. A status update on progress on this early work will be discussed.
Future Plans
Literature and base knowledge on this subject are lacking. More work is needed to assess the actual risk to workers around manure storages where gypsum is present. There are countless factors that can contribute to gas production from manure storages. Identification of key factors that may lead to production of hydrogen sulfide when gypsum is present is needed. Further outreach to manure handling industries is warranted.
Authors
Robert Meinen – Senior Extension Associate, Penn State University Dept. of Animal Science rjm134@psu.edu
Davis Hill – Senior Extension Associate, Agricultural Safety and Health, Penn State University Dept. of Agricultural and Biological Engineering.
Rebecca Larson – Assistant Professor: Bio-waste, University of Wisconsin Dept. of Biological Systems Engineering.
Asli Ozkaynak – Post Doc Researcher, University of Wisconsin Dept. of Biological Systems Engineering.
Dennis Murphy – Distinguished Professor, Agricultural Safety and Health, Penn State University Dept. of Agricultural and Biological Engineering.
Eileen Fabian Wheeler – Professor, Animal Welfare and Agricultural Emissions, Penn State University Dept. of Agricultural and Biological Engineering.
Robin Brandt – Lecturer, Land-based treatment/recycling systems, Penn State University Dept. of Agricultural and Biological Engineering.
Herschel Elliot – Professor, Fate and Control of Pollutants in Soils and Water, Penn State University Dept. of Agricultural and Biological Engineering
The authors are solely responsible for the content of these proceedings. The technical information does not necessarily reflect the official position of the sponsoring agencies or institutions represented by planning committee members, and inclusion and distribution herein does not constitute an endorsement of views expressed by the same. Printed materials included herein are not refereed publications. Citations should appear as follows. EXAMPLE: Authors. 2013. Title of presentation. Waste to Worth: Spreading Science and Solutions. Denver, CO. April 1-5, 2013. URL of this page. Accessed on: today’s date.
* Presentation slides are available at the bottom of the page.
Abstract
The 2010 USDA Agricultural Resource Management Survey (ARMS) Corn data will be used to examine the price paid for manure as a function of type of manure (i.e. species), form of manure, distance, size of farm, location, yield goal and whether the application rates of manure were influenced by Federal, State or local policies. Based on economic theory and the few empirical studies on manure use, it is hypothesized that swine manure will command a lower price than manure from cattle or poultry operations, all else equal. Liquid manure, due to dilution and volatilization of nutrients, will have a negative effect on price received. Due to transportation costs, which are included in the ARMS manure cost question, distance is hypothesized to have a positive effect on price. Farms in areas with high nutrient demand, such as the Corn Belt, are hypothesized to pay higher prices for manure while those in areas with excess manure nutrients, such as the Chesapeake Bay area, will pay lower prices or even be compensated to accept manure. Similarly, if policy affects application of manure, it is an indication that there are problems of excess manure in the area so prices are expected to be lower. Higher yield goals are expected to be positively associated with the price paid for manure since nutrient requirements will be higher.
Why Are the Economics of Manure Management Important?
Increasing fertilizer prices may affect demand for manure nutrients. If manure is viewed as a valuable resource it is more likely to be well-managed. Examining the factors affecting the price paid for manure can indicate to what extent it is viewed as a resource but also indicate what might be done to increase the real or perceived value of manure for crop production.
What Did We Do?
The USDA Agricultural Resource Management Survey (ARMS) is actually a set of surveys. Some are for the operation as a whole and some are for specific crops. The Corn Production Practices and Costs Report was conducted for the 2010 crop year by the National Agricultural Statistics Service. A specific, randomly selected field is identified and interviewers ask a variety of questions regarding management practices, yields, etc. on that field. The total size of the dataset was 2654, but this research focuses on the 919 farmers who indicated that manure was applied to the field in question. Summary statistics were calculated for this subset of the data.
The relationship between the price paid for the manure and various explanatory variables was examined using OLS regression as a first step. For the regression analysis, only farmers who indicated the manure came from off the farm were included, which reduced the number of observations to 206, 169 of which had no missing data. The cases of biosolids, sheep, and other were deleted since the numbers were too low once the farmers who applied their own manure were dropped. The dependent variable was calculated and represents the total cost of manure purchased for the field. This combined answers for the total cost for the field plus the product from answers to the amount per unit times number of units (e.g. $ per gallon times number of gallons) since farmers had a choice of how to answer the question.
What Have We Learned?
A few summary statistics on the full dataset are provided for comparison purposes. For the operation as a whole, an average of 345 acres of corn was planted in 2010. The size of the sample field was 48.5 acres. The value of corn production as a percentage of the total farm value of production was 38.4%. Only 0.34 % of farms indicated that this field was certified organic. For the initial subset of the data, 190 acres of corn was planted, the size of the sample field was 30.3 acres, the value of corn production was 18.4%, and 0.33% of farms indicated the field was certified organic. Therefore, the use of manure on the field does not seem to be associated with a higher rate of organic production. The farms that use manure were smaller than farms in the dataset as a whole and less specialized in corn production. As we see below, the majority of farmers who applied manure produced it themselves which also indicates these farms are more diversified.
The data for the subset of farmers who applied manure can be used to generally characterize manure use on farmers’ corn fields. The mean number of acres that manure was applied to in the field was 25.4, less than the average field size. The average expected corn production on the field was 5505 bu. The distance from the source of the manure to the field was on average 3.29 miles with a range from 0 to 320 miles. Of these farmers, 16% indicated that federal, state or local regulations had affected the manure application rate. The manure was applied by a custom applicator in 17% of cases. The mean custom application cost for purchased manure was $297 per field. Manure was tested in 22% of cases.
A number of categorical variables are also of interest. In the majority of cases (76.9%) farmers were applying their own manure. For manure that was sourced off the farm, 129 farmers purchased it, 79 received it for free, and 4 were compensated to accept it, showing that it is viewed as a valuable resource in most cases. The form of manure was primarily solid (635 farmers or 69%), followed by lagoon liquid (147) and slurry (136). For those who applied their own manure the percentage of solid manure was similar to all farmers applying manure (481/706 or 68%) and the lagoon form was only slightly higher (16.9% vs 16.0%). For those who applied manure from off the farm, there were slightly more cases of slurry than lagoon liquid (30 vs 28). The indicated units for manure application amounts are instructive; the majority (558) indicated tons, 232 indicated gallons, and the rest (129) indicated bushels. The number who indicated gallons is larger than the number who indicated the use of lagoon liquid so some slurry was also measured this way.
The most common animal source of the manure was dairy (453/919 or 49.3%), followed by beef (24.0%), poultry (16.4%), swine (7.6%), other (1.2%), equine (0.8%), sheep (0.3%), and there was one case of biosolids and zero cases of food waste. It should be noted that a separate set of questions related to compost, which was applied by about 2% of all the corn farmers surveyed.
The survey also indicated the ERS region for each farm. For farmers with corn who indicated that they used manure on the selected field, the majority (399 or 43.4%) were in the Northern Crescent (Lake States and Northeast). The next most common region was the Heartland (Corn Belt) with 38.7% of farmers, followed by Eastern Uplands (5.1%), Southern Seaboard (4.5%), Prairie Gateway and Northern Great Plains (each at 3.9%), and two cases each in the Basin and Range, and Fruitful Rim Regions.
For the regression analysis, only farmers who indicated the manure came from off the farm were included, which reduced the number of observations to 206, 169 of which had no missing data. The cases of biosolids, sheep, and other were deleted since the numbers were too low once the farmers who applied their own manure were dropped. The dependent variable was calculated and represents the total cost of manure purchased for the field. Farmers were given a choice as to how to answer the question, a total cost or answering two questions, number of units and price per unit. The dependent variable combined answers for the total cost for the field plus the product from answers to the amount per unit times number of units (e.g. $ per gallon times number of gallons).
The following results from the OLS regression are preliminary. The adjusted R2 for the model was 0.417. There was no effect of size of the corn operation overall as measured by total acres of corn planted. Total value of farm production would probably be a better measure of size but a fairly large number of farmers didn’t answer that question. Expected corn production on the field did not have a significant effect and the coefficient was negative. Whether the field was organic was excluded from the regression by SAS and may be partly due to the low number of observations. As one would expect, given the nature of the dependent variable, the area the manure was applied to had a positive and significant impact on the price paid. Distance between source and field was positive and significant (p=0.057). For the form of manure, the base was slurry and the price paid for lagoon liquid was higher (p=0.028), contrary to expectations. There was no price difference between solid manure and slurry. The value of beef, dairy and poultry manure was higher than that for swine manure, in line with expectations. There was no effect of government regulations. The value was significantly higher if the manure was custom applied. Contrary to expectations, there were no regional differences after controlling for the other factors.
Future Plans
Alternate specifications of the model, including alternative versions of the dependent variable, will be examined to check for robustness. A final paper will relate the findings to the small but growing literature in this area.
Ali, Sarah, Laura McCann, Jessica Allspach. “Manure Transfers in the Midwest and Factors Affecting Adoption of Manure Testing”. Journal of Agricultural and Applied Economics Vol. 4 (4), November 2012, pp. 533-548.
Nunez, Jennifer and Laura McCann. “Determinants of Manure Application by Crop Farmers” Journal of Soil and Water Conservation Vol. 63 (5) September/October 2008, pp. 312-321.
Acknowledgements
We acknowledge research funding by USDA-NIFA, Integrated Water Quality Grant Program, 110D.
The authors are solely responsible for the content of these proceedings. The technical information does not necessarily reflect the official position of the sponsoring agencies or institutions represented by planning committee members, and inclusion and distribution herein does not constitute an endorsement of views expressed by the same. Printed materials included herein are not refereed publications. Citations should appear as follows. EXAMPLE: Authors. 2013. Title of presentation. Waste to Worth: Spreading Science and Solutions. Denver, CO. April 1-5, 2013. URL of this page. Accessed on: today’s date.
The National Air Quality Site Assessment Tool (NAQSAT) has been developed for the voluntary use of livestock producers and their advisors or consultants. It is intended to provide assistance to livestock and poultry producers in determining the areas in their operations where there are opportunities to make changes that result in reduced air emissions. Air emissions research from livestock production systems is increasing every year. NAQSAT is based on the most accurate, credible data currently available regarding mitigation strategies for air emissions of ammonia, methane, volatile organic compounds, hydrogen sulfide, particulates, and odor.
From the NAQSAT home page users may watch a video explaining the tool, read an overview, study the user manual or select a species to start using the program.
Purpose
The National Air Quality Site Assessment Tool (NAQSAT) was developed for livestock producers who are interested in investigating opportunities to reduce air emissions from their livestock operation. The online tool is designed to provide farmers and their advisors air emissions information explicitly for their farm in a confidential setting. The tool may be run from any computer with internet access. All information entered into NAQSAT and the corresponding results remain confidential.
What Did We Do?
NAQSAT considers the air emissions from eight management categories; animal housing, feed and water, manure collection and transfer, manure storage, land application, mortality management, public perception and on-farm roads.
On the NAQSAT Effectiveness Results page the green area indicates the effectiveness of current management practices, the white area indicates the opportunity for improvement. At the end of each session users are encouraged to select “Print My Report” to receive a paper copy of all inputs that had been entered and a copy of the Effectiveness Results page for their records.
Users of the tool are asked a series of questions under each of the eight management categories. Based on the responses to previously answered questions the program determines what additional questions need to be answered such that only questions pertaining to the operation currently being evaluated are asked. Pop-up pictures assist the user in determining the relative rating to select when questions require a visual evaluation of the existing practices.
NAQSAT addresses seven emissions of concern; odor, particulate matter (dust), ammonia (NH3), hydrogen sulfide (H2S), methane (CH4), volatile organic compounds (VOCs) and nitrous oxide (N2O) under each of the eight management categories. Within the results page the green area in each rectangle indicates the effectiveness of current management practices, the white area indicates the opportunity for improvement.
NAQSAT allows users to save and run different scenarios providing the opportunity to compare the results of implementing new management practices.
It is easy to save NAQSAT sessions and return at a later date to make adjustments or consider additional alternatives. Each “saved” user session of NAQSAT is stored under its own URL available only to the person or persons with access to that URL. Individual URLs remain available for a minimum of 30 days before they are removed from the host computer.
The tool’s results page does not provide emissions data and/or regulatory guidance. It does identify opportunities for reducing air emissions and the ability to evaluate which practices might have the most impact. NAQSAT was developed for voluntary and educational use. The tool is designed to be used by livestock and poultry producers, however, the results may be more valuable when NAQSAT is used in cooperation with agency personnel or private consultants that can provide follow-up with suggestions for mitigation practices.
What Have We Learned?
NAQSAT has been used by members of the tool’s development committee to address odor conflicts in Colorado and in Michigan. In each case the tool confirmed the farm management teams were using acceptable management practices to limit odors from the livestock operation. In both states the local and state agencies involved in the conflict resolution were appreciative of the information provided by the tool.
Authors
Gerald May, Educator, Michigan State University Extension, mayg@msu.edu
Additional Information
The NAQSAT on-line tool is currently available at: http://naqsat.tamu.edu/. It is available at no cost from its host website (it does not download onto your computer). To assist first time users an overview of the tool, an informative video and a user’s manual are available on the NAQSAT home page.
Are there any organizations or individuals (besides the authors) that should be acknowledged?
Development of NAQSAT was partially funded by the USDA – NRCS Conservation Innovation Grant program. Over twenty partner organizations and universities contributed to the development of NAQSAT.
Partner universities:
Partner organizations:
Colorado State University
C.E. Meadows Endowment
Iowa State University
Colorado Livestock Association
Michigan State University
Iowa Turkey Federation
Oregon State University
Iowa Pork Producers
Penn State University
Iowa Pork Industry Center
Purdue University
Iowa State Univ. Experiment Station
Texas A&M University
Michigan Milk Producers Association
University of California, Davis
Michigan Pork Producers Association
University of Georgia
Michigan State Univ. Extension
University of Maryland
National Pork Board
University of Minnesota
Nebraska Environmental Trust
University of Nebraska
Western United Dairymen
The authors are solely responsible for the content of these proceedings. The technical information does not necessarily reflect the official position of the sponsoring agencies or institutions represented by planning committee members, and inclusion and distribution herein does not constitute an endorsement of views expressed by the same. Printed materials included herein are not refereed publications. Citations should appear as follows. EXAMPLE: Authors. 2013. Title of presentation. Waste to Worth: Spreading Science and Solutions. Denver, CO. April 1-5, 2013. URL of this page. Accessed on: today’s date.
In recent years, sharply rising costs of inorganic fertilizers have contributed to an increased demand for manure and compost in crop production acreage, transforming cattle manure from a valueless waste to a viable alternative to commercial fertilizer. If additional demand for manure as a bio-fuel were to arise manure could take on two distinct values, a fertilizer value and a fuel value. This potential “dual” value of manure begs several questions. What would the fertilizer and fuel markets of manure look like? Is there enough manure supply for the markets to operate independently? If not, which market would prevail? In essence, how, if at all, would manure’s potential value as a bio-fuel distort the traditional Panhandle manure market? A modeling framework was developed to assess the potential impacts of a manure-fired ethanol plant on the existing Texas Panhandle manure fertilizer market. Two manure-allocation runs were performed using a spreadsheet model. Run #1 allocated all available manure from dairies and feedlots to cropland as manure fertilizer; run #2 first allocated fuel manure to the ethanol plant and then allocated the remaining manure to cropland. Both model runs assumed a time horizon of one year and no antecedent nutrients in cropland soils. Other constraints included only irrigated acreages received manure and no supplemental fertilizer was used. The model revealed a 6.4% increase in cost per acre of fertilizing with manure for fields whose nutrient requirements were fully satisfied in both runs. The increase in cost per acre was likely due to an increase in hauling distances attributed to fewer CAFOs available for fertilizer manure. The model is not presented as a dynamic, systems model, but rather a static model with the potential to be incorporated into a more dynamic systems-based modeling environment. Suggestions for further model development and expansion including GAMS integration are presented.
Why Model Manure Transport and Use?
To demonstrate the potential for systems modeling to characterize manure flows in response to fertilizer prices, biofuel demand, and other externalities in the Texas Panhandle
Conceptual model diagram.
What Did We Do?
We develeloped a spreadsheet based modeling framework to evaluate how both manure use and transport might be affected by regional changes in fertilizer prices, crop composition, and biofuel demand. Specifically, we evaluated how traditional fertilizer valued manure flows might be affected by potential biofuel based flows stemming from a proposed manure-fired ethanol plant. Two model simulations representing manure flows with and without biofuel manure demand from the proposed plant were performed.
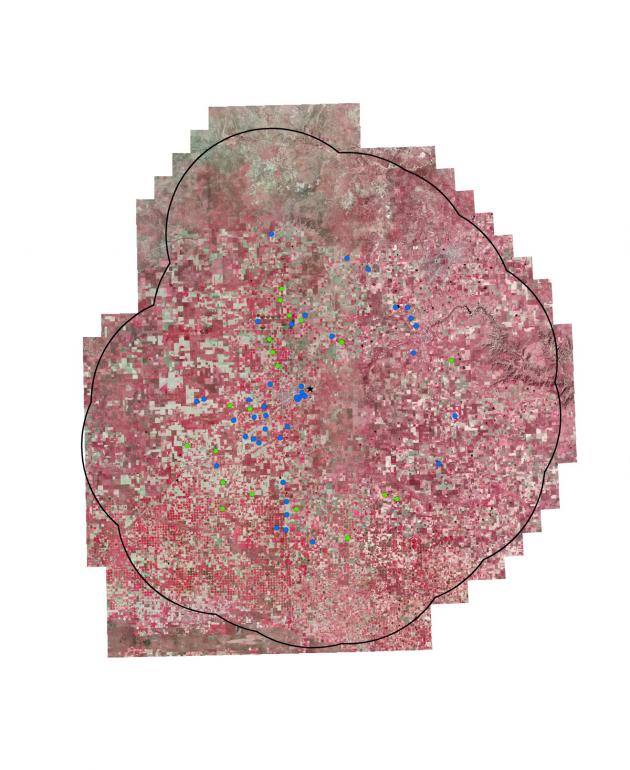
Explicit model boundary shown with TNRIS satellite imagery used to locate and identify center pivot irrigated fields.
What Have We Learned?
Although the cattle industry in Texas Panhandle generates a substantial volume of manure, almost all of it is land applied as fertilizer. However, the introduction of manure-fired facilities such as the proposed ethanol plant would undoubtedly change the dynamics of the existing manure market by introducing at least additional demand, if not a second value-based market. Assuming only transportation costs of acquiring manure for biofuel, our model simulations suggested a 6.4% increase in cost per acre for lands whose manure requirements were fully satisfied in both simulations. Assuming that manure for biofuel received an allocation preference for proximity to the plant, we propose that costs associated with having to transport manure over longer distances significantly contributes the the increased cost per acre for fertilized lands.
In terms of what we learned about systems modeling, we have experienced (although anticipated) that translating broad, systems based conceptual modeling ideas into an explicit, user friendly, and robust modeling interface can be extremely challenging. Although systems-based modeling efforts occur largely at a macro level, they often require extensive supplemental datasets. We have experienced difficulty in identifying software packages that are equipped to adequately handle both aspects of systems modeling.
Future Plans
We plan to continue to develop and expand the current modeling framework by incorporating a GIS-based water availability aquifer component, expanding the current crop-composition database, and providing logic algorithms for producer-based management decisions using GAMS (General Algebraic Modeling System) optimization modeling.
Manure allocation map for model run #1 (232 LMU cells allocated).
Authors
Brent Auvermann, Professor of Biological and Agricultural Engineering, Texas A&M AgriLife Research, b-auvermann@tamu.edu
Gary Marek, Postdoctoral Research Associate, Texas A&M AgriLife Research; Brent W. Auvermann, Professor of Biological and Agricultural Engineering, Texas A&M AgriLife Research; Kevin Heflin, Extension Associate, Texas A&M AgriLife Extension
Additional Information
Please contact Gary Marek, Postdoctoral Research Associate, Texas A&M AgriLife Research, 6500 Amarillo Boulevard West, Amarillo TX, 79106, Phone: 806-677-5600, Email: gwmarek@ag.tamu.edu or Brent W. Auvermann, Professor of Biological and Agricultural Engineering, Texas A&M AgriLife Research, 6500 Amarillo Boulevard West, Amarillo TX, 79106, Phone: 806-677-5600, Email: b-auvermann@tamu.edu.
Acknowledgements
Special thanks to Dr. Raghavan Srinivasan and David Shoemate of the Texas A&M University Department of Ecosystem Science and Management Spacial Sciences Laboratory for their help in GIS processing scripts.
The authors are solely responsible for the content of these proceedings. The technical information does not necessarily reflect the official position of the sponsoring agencies or institutions represented by planning committee members, and inclusion and distribution herein does not constitute an endorsement of views expressed by the same. Printed materials included herein are not refereed publications. Citations should appear as follows. EXAMPLE: Authors. 2013. Title of presentation. Waste to Worth: Spreading Science and Solutions. Denver, CO. April 1-5, 2013. URL of this page. Accessed on: today’s date.
Manure storage design and operation are influenced by climate and weather. The Northeast United States has been identified as likely to experience more frequent and larger precipitation events in climate change models. The Northeast Regional Climate Center (NRCC) predicts that particularly in New York and New England where the frequency of 2 inch rainfall events has increased since the 1950s and storms once considered a 1 in 100 year event have become more frequent. Such storms are now likely to occur almost twice as often. In consultation with Natural Resource Conservation Service (NRCS) the NRCC has put together a website www.precip.net that includes estimates of extreme rainfall for various durations (from 5 minutes to 10 days) and recurrence intervals (1 year to 500 years). Although the public website remains static, providing design criteria, updated data is continually collected. It is anticipated that this will show a continual shift in extreme rainfall amounts. Monthly and yearly rainfall also impact manure storage design. The impacts of both changing extreme rainfall and monthly rainfall amounts on manure storage design are explored. Higher freeboard amounts to protect from overtopping and more total storage to provide flexibility in abnormally wet weather are recommended to be incorporated in manure storage facility designs.
Why Are We Concerned About Climate Change Impacts on Manure Storage?
The need to increase the storage capacity of manure storages due to climate change is evaluated. Although the weather is variable, climate change appears to increase precipatation especially during the winter storage period. This increase in precipatation and the increased control of winter manure spreading puts farms with too little storage at greater risk. Although in general the 25 year 24 hour storm has not increased in NY, farms have experienced less storage than anticipated. The use of average precipitation amounts based on the full period of record doesn’t take into account above average precipitation during the storage period or recent increases in winter precipitation.
What Did We Do?
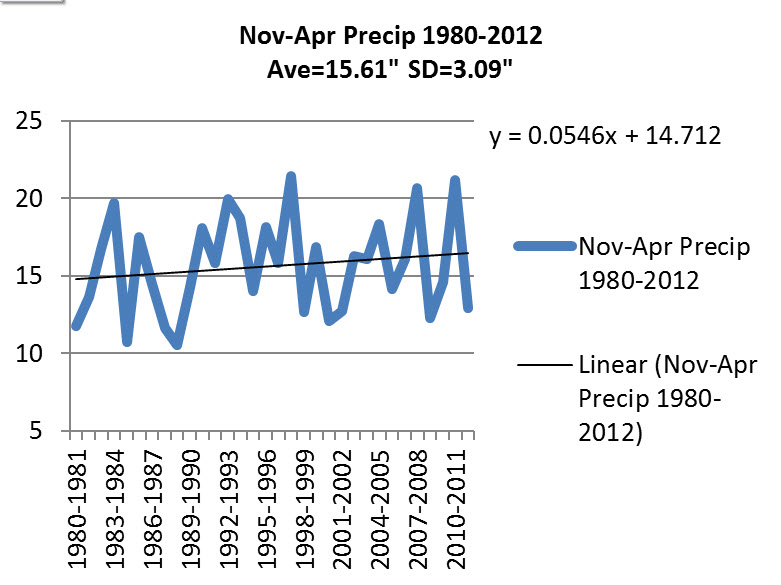
Increase in precipitation for the 8 month storage period at Ithaca NY from 1980 to 2011.
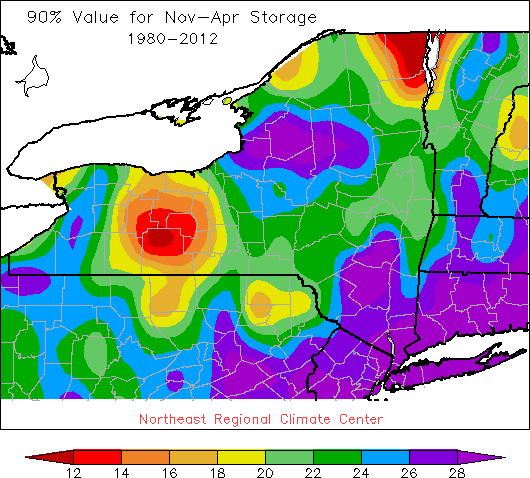
Average winter precipatiation was determined in 3 periods of record, prior to 1950, 1950 to 1980, and 1980 to 2012 at five locations in NYS. This showed that the more recent period had an increased precipitation. This matches climate model predictions for increased winter precipitation in the northeast. The amount of winter precipitation that would not be exceeded 90% of the time was determined. Present design proceedures use the average precipitation for each month of winter storage. This means that 50% of the time a storage may experience more precipitation than designed. Maps were prepared to show the precipitation amounts that would not be exceeded 90% of the time for both 6 months and 8 month storage periods.
Winter precipitation amounts for the 8 month storage period with a 90% chance of not being exceeded.
What Have We Learned?
There are many reasons for manure storages to fill faster than design including; increased animal numbers, increased manure production, increased bedding or wash water, additional drainage area, and failure to empty prior to the storage period. Wetter weather than average and wet weather in the spring puts farms with storage at risk. The winter precipitation amount is increasing.. NYS farms with storage are experiencing stress during some seasons that then cause them to try to reduce the stress by spreading manure at times that can potentially pollute. Prudent manure storagedesign whould take this into account. Using updated and conservative precipitation amounts would increase the designed storage. This would increase the cost of the storage structures but allow farms to follow their Nutrient management plans more closely.
Future Plans
NY NRCS will change the precipitation amount used in the design of manure storages.
Authors
Peter Wright PE, State Conservation Engineer Natural Resources Conservation Service , Syracuse NY, peter.wright@ny.usda.gov
Jessica L. Rennells, Climatologist, Northeast Regional Climate Center, Cornell University
Arthur T. DeGaetano, Director Northeast Regional Climate Center, Cornell University
Curt Gooch P.E. , Senior Extension Associate, PRO-Dairy, Cornell University
The authors are solely responsible for the content of these proceedings. The technical information does not necessarily reflect the official position of the sponsoring agencies or institutions represented by planning committee members, and inclusion and distribution herein does not constitute an endorsement of views expressed by the same. Printed materials included herein are not refereed publications. Citations should appear as follows. EXAMPLE: Authors. 2013. Title of presentation. Waste to Worth: Spreading Science and Solutions. Denver, CO. April 1-5, 2013. URL of this page. Accessed on: today’s date.
Little information is currently available concerning odor emissions following land application of beef cattle manure. This study was conducted to measure the effects of diet, tillage, and time following land application of beef cattle manure on the emission of volatile organic compounds (VOC).
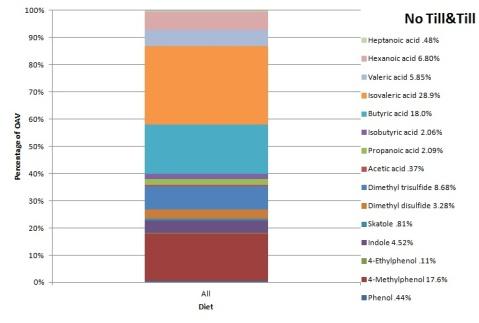
Each of the experimental treatments which included tillage (broadcast or disked) and diet (0, 10, or 30% wet distillers grain (WDGS)) were replicated twice. A 5-m tandem finishing disc was used to incorporate the manure to a depth of approximately 8 cm. Small plots (0.75 m x 2.0 m) were constructed using 20 cm-wide sheet metal frames. A flux chamber was used to obtain air samples within the small plots at 0, 1, 2, 6, and 23 hours following manure application. The flux of fifteen VOC including fatty acids, aromatic compounds, and sulfur containing compounds were measured. Based on odor threshold, isolavleric acid, butyric acid, and 4-methylphenol provided 28.9%, 18.0%, and 17.7%, respectively, of the total measured odor activity. Heptanic acid, acetic acid, skatole, 4-methyphenol, and phenol each contributed less than 1% of the total odor activity. Dimethy disulfide (DMDS) and dimethyl trisulfide were the only measured constituents that were significantly influenced by diet.
DMDS values were significantly greater for the manure derived from the 30% WDGS diet than the other manure sources. No significant differences in DMDS values were found for manure derived from diets containing 0% and 10% WDGS. Tillage did not significantly affect any of the measured VOC compounds. Each of the VOC was significantly influenced by the length of time that had expired following land application. In general, the smallest VOC measurements were obtained at the 23 hour sampling interval. Diet, tillage, and time following application should each be considered when estimating VOC emissions following land application of beef cattle manure.
Why Study Factors Affecting Manure Application Odors?
Measure the effects of diet, tillage and soil moisture on odor emissions follow land applied beef manure.
Figure 2. Relative contribution of odorant to the total odor activity.
What Did We Do?
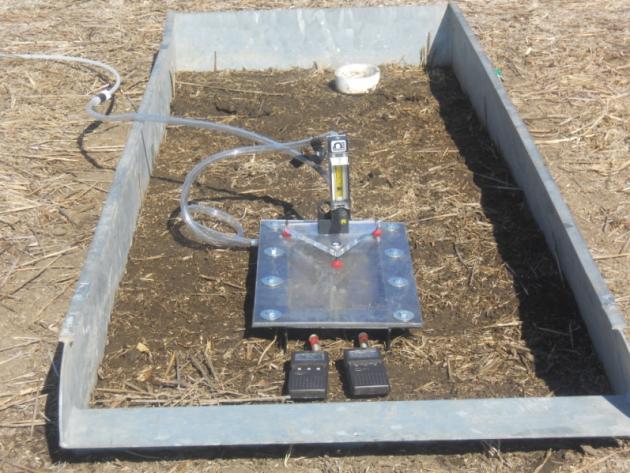
Twelve plots were established across a hill slope. Treatments were tillage (broadcast or disked) and diet (0%, 10%, or 30% WDGS). Beef manure was applied at 151 kg N ha-1 yr-1. Gas samples were collected using small wind tunnels and analyzed using a TD-GC-MS. (Fig. 1). VOC samples were collected at 0, 1, 2, 6, and 23 hours following manure application. A single application of water was applied and the gas measurement procedure was repeated. The effects of tillage, diet, test interval, and the sample collection time on VOC measurements were determined using ANOVA (SAS Institute, 2011).
What Have We Learned?
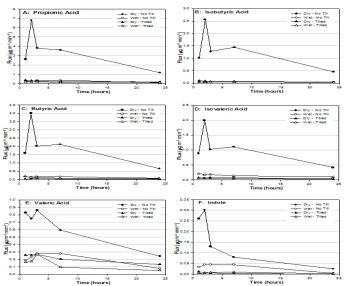
Isovaleric acid, butyric acid, and 4-methylphenol accounted for 28.9%, 18.0%, and 17.7%, respectively of the total odor activity (Fig. 2). Dimethyl disulfide (DMDS) and dimethyl trisulfide (DMTS) emissions were significantly increased by the 30 % WDGS diet. The flux increase for DMDS was over 4 times greater for the 30% WDGS diets. Tillage did not significantly affect any of the measured VOC compounds. The largest propionic, isobutric, butyric, isovaleric, and valeric acid measurements occurred with no-tillage under dry condition (Fig. 3A-E). Generally, measured values for these constituents were significantly greater at the 0, 1, 2, and 6 hour sampling intervals than at the 23 hour interval (Fig. 3A-E). The larger emissions for no-till, dry conditions may be due to the drying effect resulting when the manure was broadcast on the surface. As the manure begins to dry, the water soluble VOCs are released from solution. The tilled and wet conditions would reduce its release of VOC due to the increased moisture conditions.
Figure 3. Flux values for propionic, isobutyric, butyric, isovaleric , valeric acid and indole as affected by tillage, soil moisture, and time.
Future Plans
Additional studies are planned to quantify the moisture and temperature effect on odorous emissions.
We would like to thank Todd Boman, Sue Wise, Charlie Hinds and Zach Wacker for their invaluable help on making this project a success.
The authors are solely responsible for the content of these proceedings. The technical information does not necessarily reflect the official position of the sponsoring agencies or institutions represented by planning committee members, and inclusion and distribution herein does not constitute an endorsement of views expressed by the same. Printed materials included herein are not refereed publications. Citations should appear as follows. EXAMPLE: Authors. 2013. Title of presentation. Waste to Worth: Spreading Science and Solutions. Denver, CO. April 1-5, 2013. URL of this page. Accessed on: today’s date.
The Michigan Agriculture Environmental Assurance Program (MAEAP) is a holistic approach to environmental protection. It helps farmers evaluate their entire operation, regardless of size or commodity, and make sustainable management decisions balancing society’s needs, the environment, and economics. MAEAP is a partnership effort that aims to protect natural resources and build positive communities by working with farmers on environmentally responsible agricultural production practices.
To become MAEAP verified, farmers must complete three comprehensive steps: educational seminars, an on-farm risk assessment, and development and implementation of an action plan addressing potential environmental risks. The Michigan Department of Agriculture and Rural Development (MDARD) conducts an on-farm inspection to verify program requirements related to applicable state and federal environmental regulations, including the Generally Accepted Agricultural and Management Practices (GAAMPs). MAEAP benefits Michigan by helping to protect the Great Lakes by using proven scientific standards to improve air, water, and soil quality. Annual phosphorus reduction through MAEAP is over 340,451 pounds per year which is enough to grow almost 85,104 tons of algae in lakes and streams. Farming is an environmentally intense practice and the MAEAP-verification process ensures farmers are making choices that balance production and environmental demands. The measures aimed at protecting air, soil, water, and other environmental factors mean that MAEAP-verified farmers are committed to utilizing farming practices that protect Michigan’s natural resources.
Purpose
The Michigan Agriculture Environmental Assurance Program (MAEAP) is an innovative, proactive program that assists farms of all sizes and all commodities voluntarily prevent or minimize agricultural pollution risks. MAEAP is a collaborative effort of farmers, Michigan Department of Agriculture and Rural Development, Michigan Farm Bureau, commodity organizations, universities, conservation districts, conservation groups and state and federal agencies. MAEAP teaches farmers how to identify and prevent environmental risks and work to comply with state and federal environmental regulations. Farmers who successfully complete the three phases of a MAEAP system (Farmstead, Cropping or Livestock) are rewarded by becoming verified in that system.
What Did We Do?
To become MAEAP-verified, farmers must complete three comprehensive steps: educational seminars, a thorough on-farm risk assessment, and development and implementation of an action plan addressing potential environmental risks. The Michigan Department of Agriculture and Rural Development (MDARD) conducts an on-farm inspection to verify program requirements related to applicable state and federal environmental regulations, including the Generally Accepted Agricultural Management Practices. To retain MAEAP verification, a farm must repeat all three steps including MDARD inspection every three years.
Local MAEAP farm verified in the Cropping System
What Have We Learned?
The MAEAP program is positively influencing Michigan producers and the agriculture industry. Annually, an average of 5,000 Michigan farmers attend an educational session geared toward environmental stewardship and MAEAP verification. To date, over 10,000 farms are participating with over 1,500 MAEAP verifications. On a yearly basis, over $1.2 million is spent for practice implementation by producers working towards MAEAP verification. In 2012; the sediment reduced on MAEAP-verified farms could have filled 28,642 dump trucks (10 yards each), the phosphorus reduced on MAEAP farms could have grown 138,056 tons of algae in surface waters, and the nitrogen reduced on MAEAP farms could have grown 45,515 tons of algae in surface waters.
An example of the partnership between MAEAP and Michigan Farm Bureau
Future Plans
Michigan Governor Rick Snyder has taken a vested interest in the value of the MAEAP program. In March of 2011, Governor Snyder signed Public Acts 1 and 2 which codify MAEAP into law. This provides incentives and structure for the MAEAP program. It is a goal of Governor Snyder’s to have 5,000 farms MAEAP-verified by 2015. Most importantly, through forward thinking MAEAP strives to connect farms and communities, ensure emergency preparedness and protect natural resources.
Authors
Jan Wilford, Program Manager, Michigan Department of Agriculture & Rural Development – Environmental Stewardship Division, wilfordj9@michigan.gov
Shelby Bollwahn, MAEAP Technician – Hillsdale Conservation District
The authors are solely responsible for the content of these proceedings. The technical information does not necessarily reflect the official position of the sponsoring agencies or institutions represented by planning committee members, and inclusion and distribution herein does not constitute an endorsement of views expressed by the same. Printed materials included herein are not refereed publications. Citations should appear as follows. EXAMPLE: Authors. 2013. Title of presentation. Waste to Worth: Spreading Science and Solutions. Denver, CO. April 1-5, 2013. URL of this page. Accessed on: today’s date.
Management practices from large-scale swine production facilities have resulted in the increased collection and storage of manure for off-season fertilization use. Odor produced during storage has increased the tension among rural neighbors and among urban and rural residents, and greenhouse gas emissions may contribute to climate change. Production of these compounds from stored manure is the result of microbial activity of the anaerobic bacterial populations present during storage. We have been studying the bacterial populations of stored manure to develop methods to reduce bacterial metabolic activity and production of gaseous emissions, including the toxic odorant hydrogen sulfide produced by sulfate-reducing bacteria. Quebracho and other condensed tannins were tested for effects on total gas, hydrogen sulfide, and methane production and levels of sulfate-reducing bacteria in in vitro swine manure slurries. Quebracho condensed tannins were found to be most effective of tannins tested, and total gas, hydrogen sulfide, and methane production were all inhibited by greater than 90% from in vitro manure slurries. The inhibition was maintained for at least 28 days. Total bacterial numbers in the manure were reduced significantly following addition of quebracho tannins, as were sulfate-reducing bacteria. These results indicate that the condensed tannins are eliciting a collective effect on the bacterial population, and the addition of quebracho tannins to stored swine manure may reduce odorous and greenhouse gas emissions.
Why Would We Want to Inhibit Gas Production of Stored Manure?
Develop methods for reducing odor and emissions from stored swine manure.
What Did We Do?
Tested the effects of addition of condensed tannins to in vitro swine manure slurries on production of total gas, hydrogen sulfide, methane, and on the levels of hydrogen sulfide-producing sulfate reducing bacteria.
What Have We Learned?
Addition of condensed tannins to in vitro swine manure slurries reduces production of total gas, with quebracho condensed tannins being the most effective. 0.5% w/v Quebracho condensed tannins reduced total gas, hydrogen sulfide, and methane by at least 90% over a minimum of 28 days. Levels of sulfate reducing bacterial were also significantly reduced by addition of the tannns. This technique should assist swine producers in lowering emission and odors from stored manure.
Future Plans
We are interested in scaling up the testing to on-farm sites and also testing the tannins for reducing foaming from manure storage pits.
Authors
Terence R. Whitehead, Research Microbiologist, USDA-ARS-National Center for Agricultural Utilization Research, Peoria, IL 61604, terry.whitehead@ars.usda.gov
Cheryl Spence, USDA-ARS-National Center for Agricultural Utilization Research, Peoria, IL 61604
Michael A. Cotta, USDA-ARS-National Center for Agricultural Utilization Research, Peoria, IL 61604
Additional Information
Whitehead, T.R., Spence, C., and Cotta, M.A. Inhibition of Hydrogen Sulfide, Methane and Total Gas Production and Sulfate-Reducing Bacteria in In Vitro Swine Manure Slurries by Tannins, with Focus on Condensed Quebracho Tannins. (2012) Appl. Microbiol. Biotech. http://link.springer.com/article/10.1007/s00253-012-4562-6/fulltext.html
The authors are solely responsible for the content of these proceedings. The technical information does not necessarily reflect the official position of the sponsoring agencies or institutions represented by planning committee members, and inclusion and distribution herein does not constitute an endorsement of views expressed by the same. Printed materials included herein are not refereed publications. Citations should appear as follows. EXAMPLE: Authors. 2013. Title of presentation. Waste to Worth: Spreading Science and Solutions. Denver, CO. April 1-5, 2013. URL of this page. Accessed on: today’s date.
Livestock producers are acutely aware for the need to reduce gaseous emissions from stored livestock waste and have been trying to identify new technologies to address the chronic problem. Besides the malodor issue, toxic gases emitted from stored livestock manure, especially hydrogen sulfide (H2S) and ammonia (NH3) are environmental and health hazards for humans and animals and under scrutiny by the Environmental Protection Agency for regulatory control of concentrated animal farm operations (CAFOs).
These odorous and toxic gases are produced by bacteria during the fermentation of the stored manure. Sulfate reducing bacteria convert sulfate (SO4) to sulfide (H2S) during the fermentation. During storage of swine manure, about 60% of NH3 nitrogen is also loss. If NH3 loss can be prevented, the fertilizer value of swine manure would improve and reduce the need for additional commercial nitrogen fertilizer.
There are very few technologies available to reduce H2S, NH3 and greenhouse gas emissions from stored livestock manure, which meet the criteria of being: inexpensive, safe for farmers and animals, and environmentally sustainable. Previous research has shown that borax and quebracho condensed tannin are effective in inhibiting H2S production in stored swine manure. The present research demonstrates that a combination of borax and quebracho condensed tannin is highly effective in reducing all gaseous emissions (H2S, NH3, CO2, CO, N2O and CH4) and in retaining more nitrogen in swine manure. Lesser amounts of borax and quebracho condensed tannin are needed when combined to achieve a similar reduction in H2S production to using much larger amounts of either product alone.
Phytotoxicity studies show that the level of tolerance of crops to borax-tannin combination treated swine manure is: alfalfa > corn > wheat > soybean >> dry beans. Quebracho condensed tannin does not appear to be toxic to crops.
Why Study Tannins?
Develop methods for reducing emissions from stored swine manure.
What Did We Do?
Tested the effects of addition of combinantions of borax and quebracho condensed tannins to swine manure slurries on production of gaseous emissions and more retaining nitrogen in the manure.
What Have We Learned?
Addition of various combinations of borax and quebracho condensed tannins to swine manure slurries was highly effective in reducing all gaseous emissions (H2S, NH3, CO2, CO, N2O, and CH4) and in retaining more nitrogen in swine manure. Lesser amounts of borax and tannin are needed when combined to achieve a similar reduction in H2S production to using much larger amounts of either product alone. Phytotoxicity studies show that the level of tolerance of crops to borax-tannin combination treated swine manure is: alfalfa > corn > wheat > soybean >> dry beans.
Future Plans
We are interested in transferring this research to on-farm sites.
Authors
Melvin Yokoyama, Professor, Dept. of Animal Science, Michigan State University, E. Lansing, MI 48824, yokoyama@msu.edu
Terence R. Whitehead, Research Microbiologist, USDA-ARS-National Center for Agricultural Utilization Research, Peoria, IL 61604
Cheryl Spence, USDA-ARS-National Center for Agricultural Utilization Research, Peoria, IL 61604
Michael A. Cotta, USDA-ARS-National Center for Agricultural Utilization Research, Peoria, IL 61604
Donald Penner, Dept. of Crops and Soil Sciences, Michigan State University, E. Lansing, MI 48824
Susan Hengemuehle, Dept. of Animal Science, Michigan State University, E. Lansing, MI 48824
Janis Michael, Dept. of Crops and Soil Sciences, Michigan State University, E. Lansing, MI 48824
Additional Information
Whitehead, T.R., Spence, C., and Cotta, M.A. Inhibition of Hydrogen Sulfide, Methane and Total Gas Production and Sulfate-Reducing Bacteria in In Vitro Swine Manure Slurries by Tannins, with Focus on Condensed Quebracho Tannins. (2012) Appl. Microbiol. Biotech. http://link.springer.com/article/10.1007/s00253-012-4562-6/fulltext.html
The authors are solely responsible for the content of these proceedings. The technical information does not necessarily reflect the official position of the sponsoring agencies or institutions represented by planning committee members, and inclusion and distribution herein does not constitute an endorsement of views expressed by the same. Printed materials included herein are not refereed publications. Citations should appear as follows. EXAMPLE: Authors. 2013. Title of presentation. Waste to Worth: Spreading Science and Solutions. Denver, CO. April 1-5, 2013. URL of this page. Accessed on: today’s date.
To meet Chesapeake Bay Total Maximum Daily Load requirements for agricultural pollution, conservation districts and farmers are tasked with implementing best management practices (BMPs) that reduce farm losses of nutrients and sediment. The importance of the agricultural industry to the regional economy highlights the need for determining cost-effective BMP solutions given the geographical and operational characteristics of these farms. This study evaluated both the environmental risk and farm profitability of common farm-level management practices for three major farm types in the region: crop, tractor-based (“English”) dairy, and horse-drawn (“Amish”) dairy.
Whole-farm simulations were conducted with the Integrated Farm System Model, a multi-year, process-based simulation model, to facilitate a broader understanding of the challenges for the farmers in finding financially feasible and environmentally sustainable solutions. Strip cropping, conservation tillage, cover cropping, and nutrient management BMPs generally reduced nutrient and sediments losses from all three farm types. However, scenarios that reduced phosphorus and sediment losses generally promoted more leaching of nitrogen. Double cropping corn with winter wheat combined with improved nutrient management was the most profitable practice for the crop farm, increasing average farm profitability by 92% over the baseline condition, while reducing combined nitrogen and total phosphorus losses by 13% and 23%, respectively.
Net profitability of the dairy farm was increased only by decreasing manure storage or using improved nutrient management. For the horse-drawn dairy, cover-cropping and harvest of rye silage combined with increased nutrient management provided the greatest increase in farm profit (+8%) and also reduced phosphorus and nitrogen losses.
Horse-drawn machinery through puts and increased human labor hours were required to simulate a typical Lancaster Old Order Amish dairy operation in Southeastern Pennsylvania.
Why Study Farms As a System?
Because southeastern Pennsylvania is a significant environmental contributor of the Chesapeake Bay, agricultural land management is under intense scrutiny by restoration groups. It is imperative to improving water quality that economically and culturally acceptable nonpoint source control practices be explored, developed, and evaluated. This is true for “contemporary” crop and dairy farms in the region as well as those that are more conservative in their use of electrical- or gas-powered farming equipment, described in this study as “Lancaster Old Order Amish”. Evaluation from a whole-farm perspective enables practical assessments of tradeoffs among management practice combinations and is particularly relevant when effectiveness relies on the willingness and dedication of the farm operators.
What Did We Do?
The expertise of regional conservationists and pooled results from farmer surveys were used to determine three major farm types in southeastern Pennsylvania and design potentially acceptable management combinations for each type. Three baseline farms were described: 400 ha corn-soy-wheat crop farm; 100 cow, 120 ha contemporary dairy; and 24 ha Lancaster Old Order Amish dairy. Whole-farm impacts were assessed with the Integrated Farm System Model (IFSM), a multi-year, process-based simulation model. Environmental tradeoffs between nitrogen, phosphorus, and sediment losses were evaluated and financial cost-benefits through change in annual net return for the farmer were analyzed.
What Have We Learned?
Strip cropping, conservation tillage, cover cropping, and improved nutrient management generally reduced nutrient and sediment losses from all three farm types. However, scenarios that reduced phosphorus and sediment runoff losses generally increased nitrogen leaching to groundwater. Double cropping corn and winter wheat under improved nutrient management was the most profitable combination for the crop farm, increasing average farm profitability by 92% over the baseline while reducing combined nitrogen and total phosphorus losses by 13% and 23%, respectively. Net profitability of the contemporary dairy farm was increased only by decreasing manure storage or using improved nutrient management. For the Lancaster Old Order Amish dairy, cover-cropping and harvest of rye silage combined with increased nutrient management provided the greatest increase in farm profit (+8%) and also reduced phosphorus and nitrogen losses.
Future Plans
Cost-effective recommendations from a whole farm perspective that account for unique characteristics of particular farm types can aid officials in determining locally agreeable methods for efficiently addressing regional priority pollutants. As farms adopt and implement suggested management changes, additional management practices of interest can be evaluated. Also, IFSM is being expanded to consider air emissions and carbon sequestration effects of the management practices.
McLean, A. D., 2012. Modeling best management practices on representative farms in Southeastern Pennsylvania. Master’s thesis, PA State University, University Park, PA. https://etda.libraries.psu.edu/paper/14093/, available Dec. 05, 2012.
Acknowledgements
This work contributes to the Conservation Effects Assessment Project (CEAP), jointly funded, coordinated, and administered by United States Department of Agriculture’s Natural Resources Conservation Service, Agricultural Research Service, and National Institute for Food and Agriculture. We would like to thank Mike Hubler and Larry Baum from Dauphin County Conservation District and officials at Lancaster and Lebanon County Conservation Districts for their advice and guidance categorizing and characterizing farms of Dauphin County and southeastern Pennsylvania. Thanks also to Kristen Saacke-Blunk and Matt Royer from Conewago Creek Collaborative Conservation Initiative for their time and input. Mention of trade names or commercial products in this publication is solely for the purpose of providing specific information and does not imply recommendation or endorsement by the U.S. Department of Agriculture. USDA is an equal opportunity provider and employer.
The authors are solely responsible for the content of these proceedings. The technical information does not necessarily reflect the official position of the sponsoring agencies or institutions represented by planning committee members, and inclusion and distribution herein does not constitute an endorsement of views expressed by the same. Printed materials included herein are not refereed publications. Citations should appear as follows. EXAMPLE: Authors. 2013. Title of presentation. Waste to Worth: Spreading Science and Solutions. Denver, CO. April 1-5, 2013. URL of this page. Accessed on: today’s date.
To provide the best experiences, we use technologies like cookies to store and/or access device information. Consenting to these technologies will allow us to process data such as browsing behavior or unique IDs on this site. Not consenting or withdrawing consent, may adversely affect certain features and functions.
Functional
Always active
The technical storage or access is strictly necessary for the legitimate purpose of enabling the use of a specific service explicitly requested by the subscriber or user, or for the sole purpose of carrying out the transmission of a communication over an electronic communications network.
Preferences
The technical storage or access is necessary for the legitimate purpose of storing preferences that are not requested by the subscriber or user.
Statistics
The technical storage or access that is used exclusively for statistical purposes.The technical storage or access that is used exclusively for anonymous statistical purposes. Without a subpoena, voluntary compliance on the part of your Internet Service Provider, or additional records from a third party, information stored or retrieved for this purpose alone cannot usually be used to identify you.
Marketing
The technical storage or access is required to create user profiles to send advertising, or to track the user on a website or across several websites for similar marketing purposes.