
Have you heard or read about circularity and the circular economy? These buzzwords describe sustainability concepts that are being adopted in many sectors, including food animal production. This webinar shares definitions for these concepts and how they can inform thinking about changes to animal systems and manure management. This presentation was originally broadcast on June 21, 2024. Continue reading “Staying in the Loop: Circularity in Integrated Crop and Livestock Production”
Upcoming Models and Tools to Improve Manure Management
Responsible manure management uses multiple data types from a wide range of sources. This webinar highlights three new tools that aim to ease this burden while supporting effective decision-making. ManureDB aggregates U.S. manure analysis data and provides user-specified reports of manure characteristics. ManureTech synthesizes the environmental, economic and operational facets of manure treatment technologies. Manure Management Planner is a trusted tool but has also undergone recent updates for site-specific setback distances. Participants will be able to see these tools in action, and where further developments are headed. This presentation was originally broadcast on February 16, 2024. Continue reading “Upcoming Models and Tools to Improve Manure Management”
Models & Tools to Improve Manure Management: Part II
This webinar features the Oregon NMPT, an internet-based record keeping and planning tool, and the Ruminant Farm Systems (RuFaS) project, which aims to build an integrated, whole-farm model that simulates milk, meat, and crop production, and critical metrics of sustainability from ruminant farms. This presentation was originally broadcast on October 20, 2023. Continue reading “Models & Tools to Improve Manure Management: Part II”
Improving Air Quality In and Around Livestock Facilities
Air quality in and around barns can negatively impact animal and worker welfare. This webinar will discuss ways to overcome these challenges. This presentation originally broadcast on April 21, 2023. Continue reading “Improving Air Quality In and Around Livestock Facilities”
Moving Manure and Mortalities after Highly Pathogenic Avian Influenza
This webinar shares research and guidance on minimizing the risk of virus movement through manure and mortality management. This webinar also explains the roles technical advisors can play in response to an outbreak. This presentation originally broadcast on March 17, 2023. Continue reading “Moving Manure and Mortalities after Highly Pathogenic Avian Influenza”
Anaerobic Co-digestion of Agro-industrial Feedstocks to Supplement Biogas Produced from Livestock Manure
Purpose
Anaerobic digestion (AD) is commonly used in agriculture to break down livestock manure and produce a sustainable source of energy by producing biogas, which is predominantly methane. Digestion of livestock manure can be supplemented with additional agricultural or industrial organic waste, potentially adding sources of revenue to the farm or digestion facility through tipping fees and additional biogas production. However, quantifying the anticipated impact on digester performance and operation is challenging, particularly as some potential feedstocks have not been studied previously. Understanding how a feedstock might impact a digester’s performance is critical, as digester upsets can lead to loss of revenue or even digester failure.
What Did We Do?
We conducted a set of mono-digestion biomethane potential experiments of several feedstocks currently in use at an agricultural AD facility that accepts mixed industrial waste streams in addition to digesting beef manure. The mono-digestion studies used triplicate 1-L working volume batch digesters which ran for 30-38 days. We tested beef manure, off-spec starch from food manufacturing, slaughterhouse wastewater treatment sludge, waste activated sludge from a corn processing facility, soap stock from glycerin refining, filter press slurry from a food grade water treatment facility, and food waste dissolved air flotation sludge. We also included a treatment for the effluent from the digester’s ammonia recovery system and a mixture of all the feedstocks at the same time. A blank (inoculum only) and positive control (cellulose with inoculum) digester were included as controls. This set of studies is described here as Experiment 1 (E1).
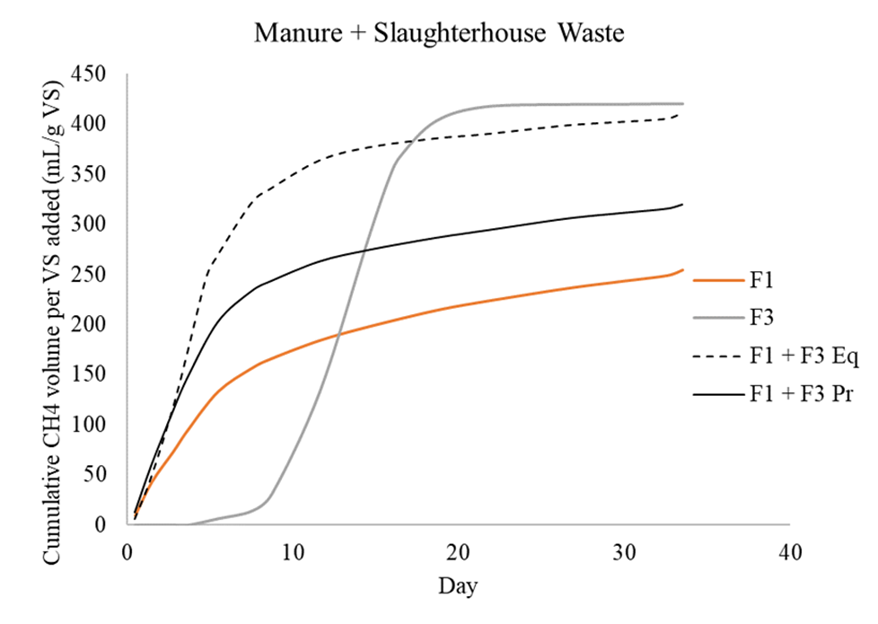
We then conducted a set of co-digestion biomethane potential tests combining the manure pairwise with some of the industrial feedstocks, specifically starch, slaughterhouse waste, soap stock, and filter press slurry (Experiment 2 or E2). These combinations were made at two different ratios of the two feedstocks. The first set of treatments combined the manure and an additional substrate at a 1:1 ratio on a volatile solids basis. The second set of treatments combined the feedstocks proportional to the amounts commonly used in the AD facility providing the materials. A final treatment pairing starch and soap stock at a 3:1 ratio was also included. These co-digestion treatments were conducted in triplicate alongside a single mono-digestion treatment of each feedstock for comparison. Finally, we examined the potential synergistic or antagonistic impacts of these combinations on methane yield and production rate. This was done by comparing the measured methane production at each time point compared to the expected methane production if the feedstocks each contributed additively to the methane production.
What Have We Learned?
Figure 1 shows the cumulative specific biogas production on a volatile solids basis for the mono-digestion experiment (E1). Some feedstocks, such as soap stock and slaughterhouse waste, experienced a substantial lag phase at the beginning of the experiment, which may have been due to the high levels of lipids and proteins.

During the co-digestion experiment (E2), we observed both total yield and kinetic synergy in all treatments. Only two digesters (one of the replicates from the starch and manure proportional treatment and one from the starch and soap stock treatment) produced substantially less (<30%) methane than would be expected for an additive effect for more than one day. This effect can be seen in Figure 2, which shows the cumulative methane curves (corrected for inoculum contribution and averaged over the three replicates) of the mono-digestion digesters for manure and starch individually and the curves for both co-digestion treatments using both manure and starch. Figure 3 shows the same curves for the co-digestion of manure and slaughterhouse waste. These co-digestion treatments show that combining the feedstocks causes an increase in methane production at a faster rate. They also show that co-digestion alleviates the lag phase experienced by the slaughterhouse waste.

Future Plans
We plan to continue exploring the impact of co-digestion on methane yield and production rate by using additional combinations of these feedstocks and exploring the impact of macromolecular composition (percentages of carbohydrates, proteins, and lipids) on synergistic effects. These results will help inform current or future agricultural AD operators regarding the use of co-digestion feedstocks for optimal energy production and best practices in selecting new feedstocks for co-digestion.
Authors
Jennifer Rackliffe, Graduate Research Fellow, Purdue University
Corresponding author email address
Additional authors
Dr. Ji-Qin Ni, Professor, Purdue University; Dr. Nathan Mosier, Professor, Purdue University
Additional Information:
https://www.sare.org/wp-content/uploads/2021-NCR-SARE-GNC-Funded.pdf
Acknowledgements:
This material is based upon work that is supported by the National Institute of Food and Agriculture, U.S. Department of Agriculture, under agreement number 2020-38640-31522 through the North Central Region SARE program under project number GNC21-334. USDA is an equal opportunity employer and service provider. Any opinions, findings, conclusions, or recommendations expressed in this publication are those of the author(s) and do not necessarily reflect the view of the U.S. Department of Agriculture. We also thank Purdue’s Institute for Climate, Environment and Sustainability for supporting the dissemination of this work. Finally, we acknowledge the assistance of Gabrielle Koel, Kyra Keenan, Amanda Pisarczyk, and Emily McGlothlin in conducting the laboratory work.
The authors are solely responsible for the content of these proceedings. The technical information does not necessarily reflect the official position of the sponsoring agencies or institutions represented by planning committee members, and inclusion and distribution herein does not constitute an endorsement of views expressed by the same. Printed materials included herein are not refereed publications. Citations should appear as follows. EXAMPLE: Authors. 2022. Title of presentation. Waste to Worth. Oregon, OH. April 18-22, 2022. URL of this page. Accessed on: today’s date.
Evaluating Costs and Benefits of Manure Management Systems for a Decision-Support Tool
Purpose
The purpose of the decision-support tool is to help livestock producers understand the costs of implementing new technology and the potential benefits associated with nutrient and water recovery, and how these compare across systems. Livestock agriculture is under increased scrutiny to better manage manure and mitigate negative impacts on the environment. At the same time, the nutrients and water present in manure management systems hold potential economic value as crop fertilizer and irrigation water. While technologies are available that allow for recovery and/or recycling of solids, nutrients and water, appropriate decision-support tools are needed to help farmers evaluate the practicality, costs, and benefits of implementing these systems on their unique farms.
What Did We Do?
In designing and refining the tool, we consider which economic components are important in driving the decision algorithm, as well as what is the most valuable economic output information for the user. We developed several “scenarios” defined by the unit processes used in the capture, treatment, storage, and usage of dairy manure. The costs and benefits related to each unit process were evaluated and aggregated for each scenario. Unit processes included flush/scrape activities, reception pit, sand recovery, solids separation, anaerobic digestion, composting, pond/lagoon storage, and tanker/drag hose land application.
Economic information was gathered from published literature, government documents, extension tools, and communication with academic, industry, and extension experts. We evaluated capital costs as an annual capital recovery value; operational costs including labor, energy, and repair and maintenance; cost savings resulting from sand/organic bedding and water reuse; fertilizer value of manure for use on-farm; revenue potential including the sale of treated manure nutrients and energy from anaerobic digestion; and the combined net costs or net benefits. Economic results are integrated into the multi-criteria decision algorithm. Results also elucidate economic tradeoffs across manure management systems (MMS), which can be used by farmers to assist in their decision-making.
What Have We Learned?
Economics is often about evaluating trade-offs between different choices or decisions. When evaluating results from the tool, we see that an increase in capital spending may lead to decreases in operational costs relative to capital costs, depending on farm size. This is due to a general reduction in labor and fuel costs associated with automated or additional manure treatment (e.g. increased spending on an MMS). For example, additional manure treatment can reduce land application expenses and increase cost savings from recovered sand or organic bedding. However, this larger capital outlay may or may not be possible based on the farm’s financial circumstances.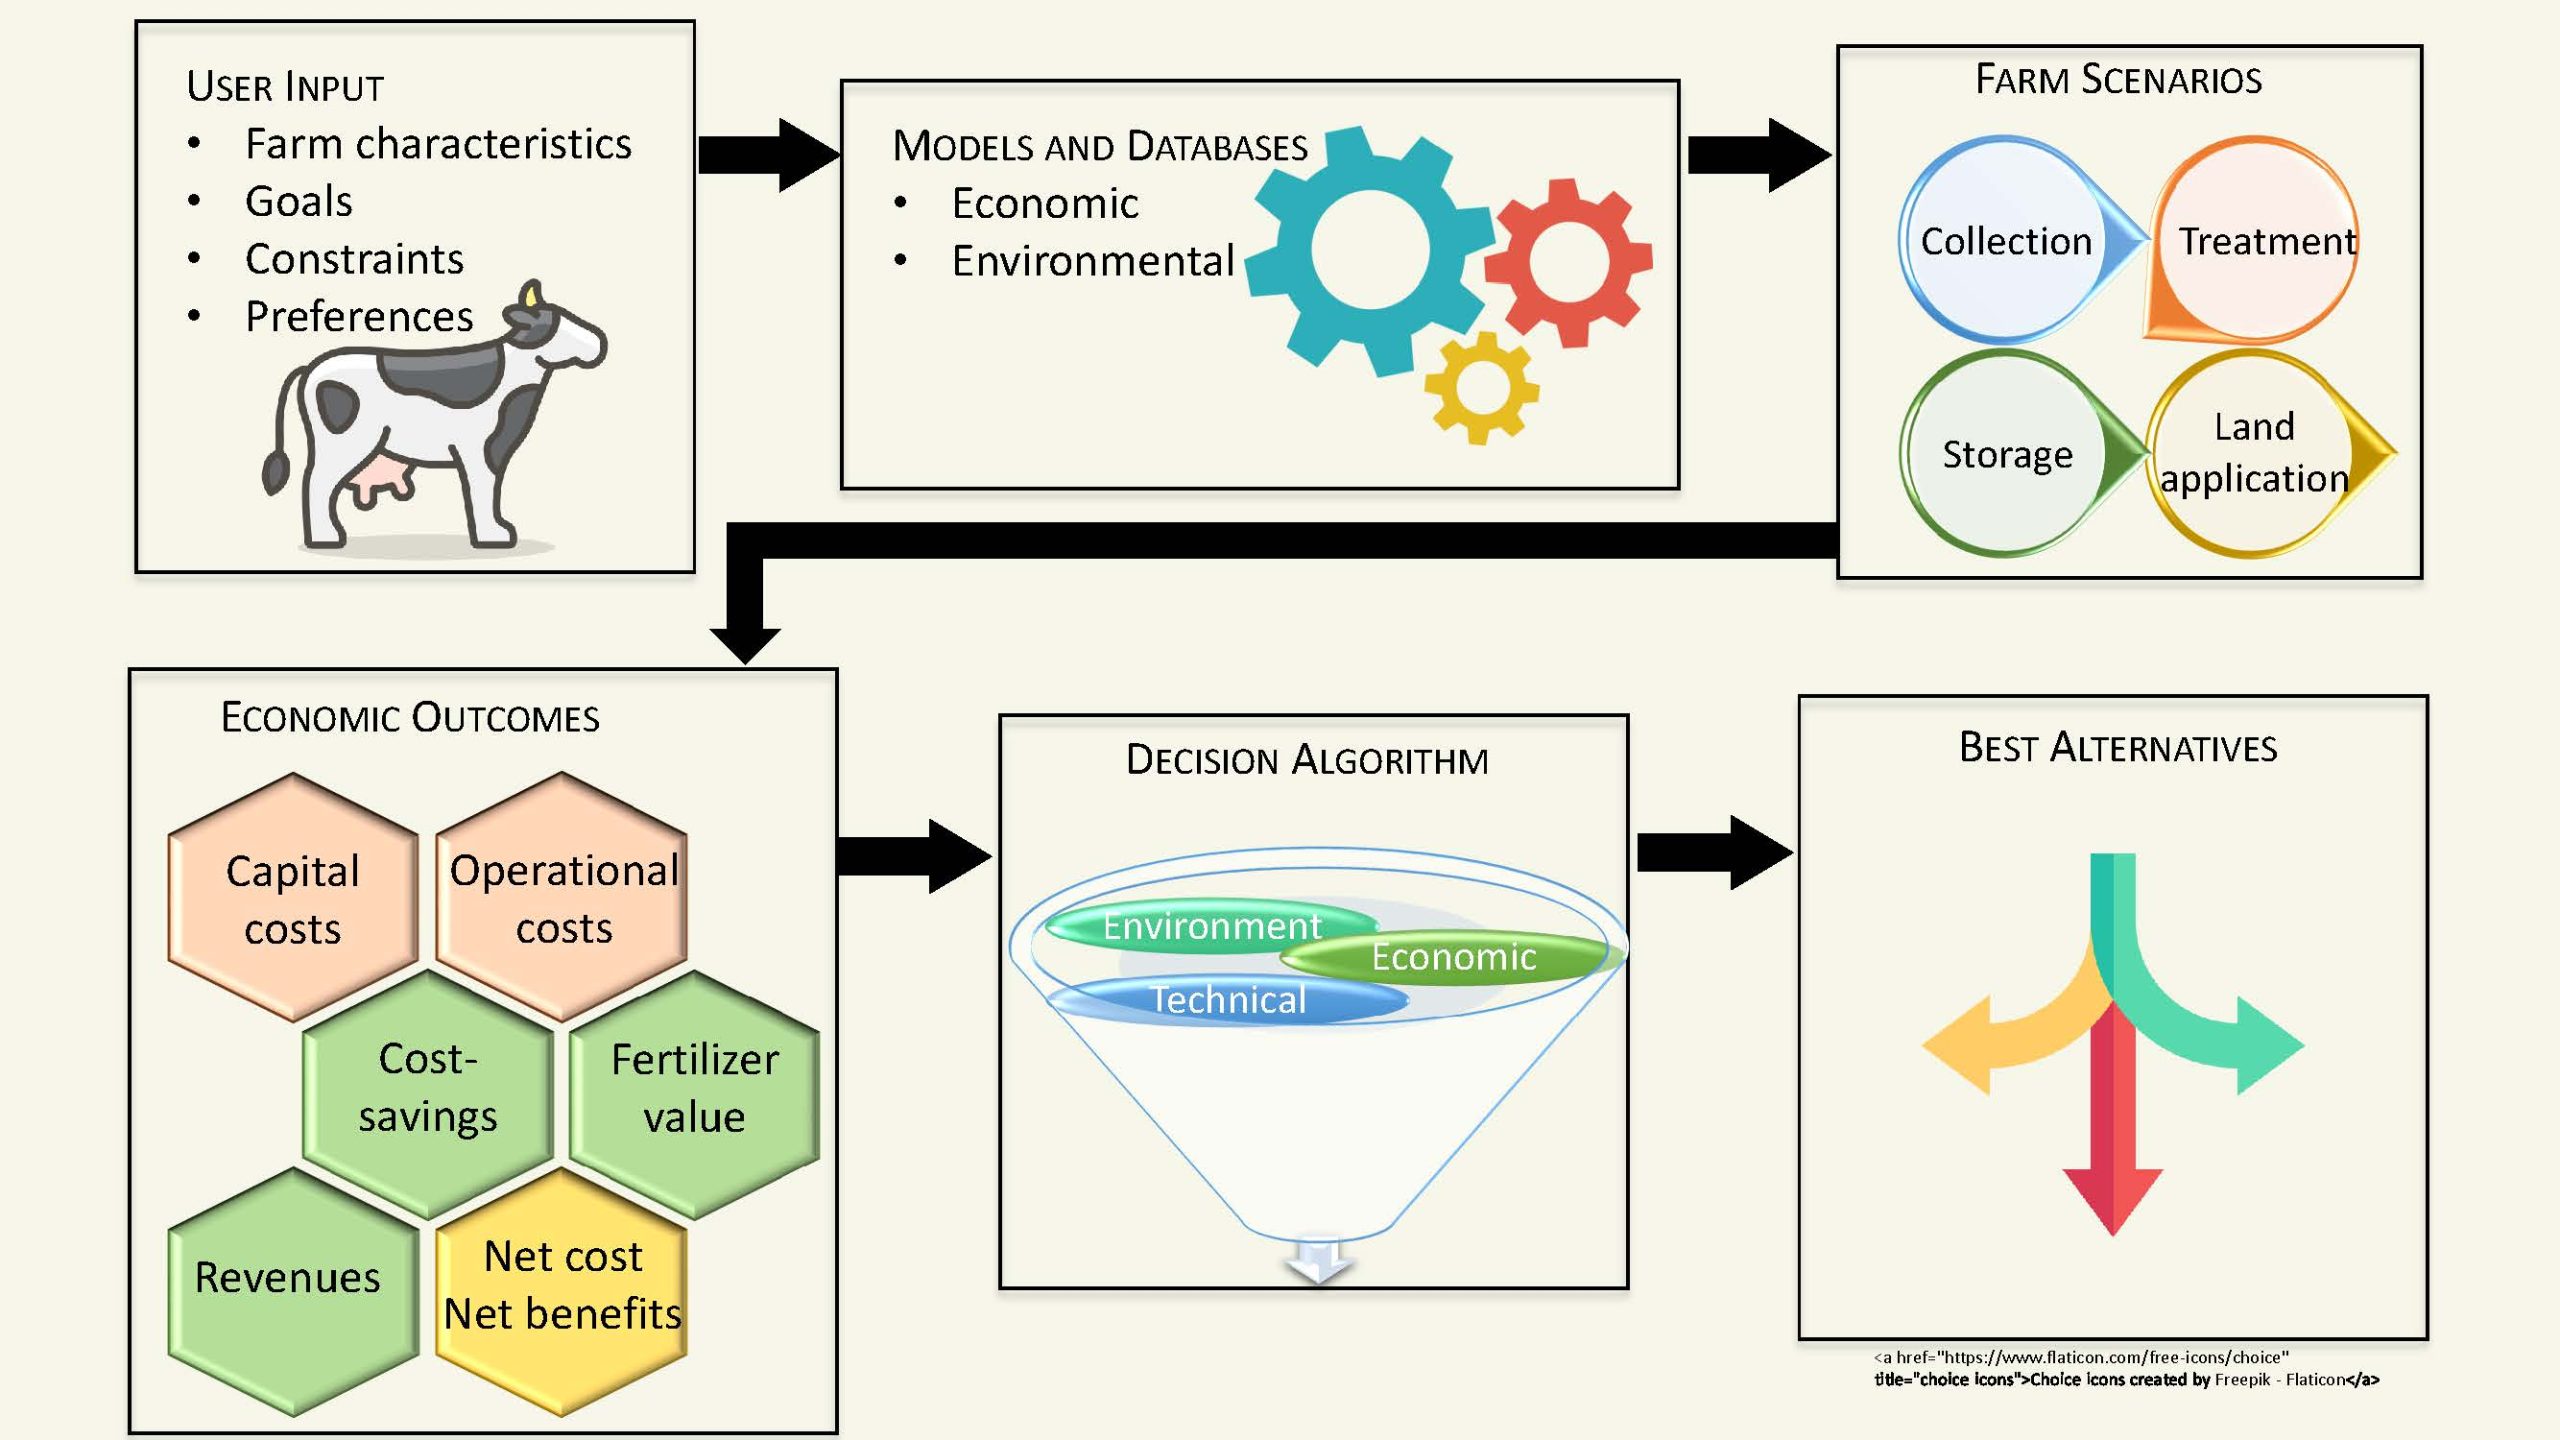
Future Plans
The next steps are to complete the economic analyses of a total of 60 MMS and integrate these into the decision-support tool. We plan to demonstrate this tool to extension specialists and producers to refine the user interface, key assumptions, functioning of the decision algorithm, and the usability of the results.
Authors
Erin E. Scott, PhD Graduate Assistant, University of Arkansas
Corresponding author email address
Additional authors
Sudharsan Varma Vempalli, Postdoctoral Research Associate, University of Arkansas
Jacob Hickman, Program Coordinator, University of Arkansas
Jennie Popp, Professor, University of Arkansas
Richard Stowell, Professor, University of Nebraska-Lincoln
Teng Lim, Extension Professor, University of Missouri
Greg Thoma, Professor, University of Arkansas
Lauren Greenlee, Associate Professor, Penn State University
Additional Information
Related presentation during this session by Varma et al., titled “A Decision-Support Tool for The Design and Evaluation of Manure Management and Nutrient Reuse in Dairy and Swine Farm Facilities”.
Acknowledgements
We acknowledge funding support from the United States Department of Agriculture (USDA) National Institute of Food and Agriculture (NIFA) grant award (# 2018-68011-28691). We would also like to thank our full project team and outside experts for their guidance on this project.
The authors are solely responsible for the content of these proceedings. The technical information does not necessarily reflect the official position of the sponsoring agencies or institutions represented by planning committee members, and inclusion and distribution herein does not constitute an endorsement of views expressed by the same. Printed materials included herein are not refereed publications. Citations should appear as follows. EXAMPLE: Authors. 2022. Title of presentation. Waste to Worth. Oregon, OH. April 18-22, 2022. URL of this page. Accessed on: today’s date.
Whole farm assessment of nutrient extraction from dairy manure
Purpose
While animal manure contains nutrients and organic material that are beneficial for crop production, the concentrations of those nutrients are typically too low to allow economically viable transportation of bulk manures over long distances to where crops are sometimes produced. Therefore, dairy manure tends to be applied to soils near where it is generated. Since phosphorous (P) is conserved during manure handling compared to nitrogen, P concentrations in soils where dairy manure is applied tend to exceed crop demands. Due to the implication that P runoff from agricultural operations plays an important role in the eutrophication of streams and other water bodies, farmers are experiencing increasing pressure and regulation to not apply animal manures to fields that are already overloaded with P.
A possible solution to P overloading is to remove some of the P from manure before it is applied. In testing the MAnure PHosphorus EXtraction (MAPHEX) System Church et al. (2016, 2017, 2018), found that by treating liquid dairy manure with a screw press followed by a decanter centrifuge, 38 – 60% of the P could be removed from the manures of a wide variety of farms. A benefit to this approach is that the P removed, is concentrated into a stackable solid (about 72% moisture) that can be more economically transported to distant fields where P may be in deficit. The remaining liquid and course solids, containing greater than 90% of the manure N, can be beneficially used nearer the source without loading those soils with P. A comprehensive farm-scale evaluation of manure nutrient extraction is needed which can be done using the Integrated Farm System Model (IFSM; USDA, 2022). The IFSM has been used to assess other manure handling strategies along with many farm-scale options for crop, animal and feeding management.
What Did We Do?
We evaluated the whole-farm performance, environmental effects, and potential economic benefit of extracting P from dairy manure using a decanter centrifuge (Rotz et al., 2022). A farm in Pennsylvania with distant cropland was simulated with the IFSM to evaluate the feasibility of extracting P to reduce transport requirements on-farm or to produce a concentrated P product for off-farm use. Three production systems were evaluated with and without the use of centrifuge extraction. The first was the current farm with manure collected by flushing, next was the same farm with manure collection by scraping and the last was a modified farm with scraped manure where only forage crops were produced and concentrate feeds were purchased. Collection by scraping greatly reduced the volume of manure handled by the centrifuge thus reducing operating time and electricity use. Reducing the crop land and removing grain production created an imbalance in nutrient utilization with potential accumulation of P in the farm soil. Under this constraint, use of the centrifuge provided a method for removing a portion of the manure P for export from the farm.
Farm simulations estimated all forms of nitrogen, P, and carbon losses. This included erosion of sediment and runoff of sediment-bound and dissolved P across the farm boundaries. Costs for owning and operating the manure handling systems were determined using the economic component in IFSM. All equipment and facilities were amortized over an economic life and the annualized cost was added to other operating costs to get a total. Manure handling costs included fixed and operating (repair and maintenance, fuel, and labor) costs of the rotary screen, screw presses, and centrifuge. Manure hauling was also an important cost in the assessment because the number of trucks required and hauling distance varied among systems. Hauling cost included the amortized initial cost of trucks and annual costs for truck repair and maintenance, fuel, and operator labor.
What Have We Learned?
On a large dairy farm of 2,000 cows and 3,450 acres of land where manure must be transported to distant cropland to obtain uniform distribution, P extraction with a centrifuge provided a better ratio of nitrogen and P contents in manure used on nearby cropland and reduced transport costs for nutrients applied to more distant cropland. Centrifuge extraction was found to be more practical and economical when used with manure scraped from the barn floor than with flushed manure. Use of the centrifuge was not economically justified with the flush system where large volumes of low concentration liquid manure were handled. When barn floors were scraped, the benefit received through reduced manure volume more than offset the increased costs of owning and operating the centrifuge. To avoid long-term accumulation of soil P on the farm with less land (2,000 cows and 2,720 acres) where concentrate feed (27% of total feed) was imported, centrifuge extraction provided a material with a high P concentration that could be exported from the farm for other uses. Extracting the P in excess of crop needs cost about $1.14/lb P. This was generally greater than the price of phosphate fertilizer, but the extract also included other nutrients and micronutrients of value to crops.
A centrifuge provides a useful tool for extracting and concentrating manure P, but the economic benefit to the producer depends upon the value of the full array of nutrients contained, manure handling practices, and the end use of the extracted material. Although marketing this material for its P content alone may not be economical, the material may have other value and the reduction in long-term risk of surface water eutrophication has a less well-defined economic benefit to society.
Future Plans
The IFSM provides a tool for evaluating the performance, environmental impacts and economics of beef cattle and dairy production systems. The addition of the new component for modeling manure nutrient extraction technologies provides a tool for evaluating the whole farm costs and benefits of various technologies being developed or proposed for on-farm use. These can include manure processing based upon dissolved air floatation, evaporation, ultrafiltration, and the full MAPHEX system.
Authors
Alan Rotz, Agricultural Engineer, Agricultural Research Service, USDA
Corresponding author email address
al.rotz@usda.gov
Additional authors
Michael Reiner, Support Scientist, Agricultural Research Service, USDA; Sarah Fishel, Support Scientist, Agricultural Research Service, USDA; Clinton Church, Chemist, Agricultural Research Service, USDA
Additional Information
Church, C. D., Hristov, A., Bryant, R. B., Kleinman, P. J. A., & Fishel, S. K. 2016. A novel treatment system to remove phosphorus from liquid manure. Appl. Eng. Agric. 32: 103 – 112. doi:10.13031/aea.32.10999
Church, C. D., Hristov, A., Bryant, R. B., & Kleinman, P. J. A. 2017. Processes and treatment systems for treating high phosphorus containing fluids. US Patent 10,737958.
Church, C. D., Hristov, A. N., Kleinman, P. J. A., Fishel, S. K., Reiner, M. R., & Bryant, R. B. 2018. Versatility of the MAnure PHosphorus Extraction (MAPHEX) System in removing phosphorus, odor, microbes, and alkalinity from dairy manures: A four-farm case study. Appl. Eng. Agric. 34: 567 – 572. doi: 10.13031/aea12632
Rotz, C.A., Reiner, M., Fishel, S., & Church, C. 2022. Whole farm performance of centrifuge extraction of phosphorus from dairy manure. Appl. Eng. Agric. In press.
USDA-ARS. 2022. The Integrated Farm System Model, version 4.7. University Park, PA: USDA-ARS. Retrieved from https://www.ars.usda.gov/northeast-area/up-pa/pswmru/docs/integrated-farm-system-model
Acknowledgements
This work was supported by the U.S. Department of Agriculture, Agricultural Research Service. USDA is an equal opportunity provider and employer. The authors thank the producer who contributed characteristics of their farm for this assessment.
The authors are solely responsible for the content of these proceedings. The technical information does not necessarily reflect the official position of the sponsoring agencies or institutions represented by planning committee members, and inclusion and distribution herein does not constitute an endorsement of views expressed by the same. Printed materials included herein are not refereed publications. Citations should appear as follows. EXAMPLE: Authors. 2022. Title of presentation. Waste to Worth. Oregon, OH. April 18-22, 2022. URL of this page. Accessed on: today’s date.
Dairy Anaerobic Digestion Simulation Software
Purpose
Co-digestion of organic material with dairy manure represents an opportunity to provide both a revenue stream to anaerobic digester operations, through the collection of a tipping fee and/or increased biogas/electricity production, as well as a means for waste generators to dispose of their product in a beneficial way.
However, there are many factors for an operator to consider when deciding on whether to accept organic waste. A major consideration is the volume of biogas that the material will generate when co-digested. This can be used both to assign a value to the waste through increased biogas production and/or electricity sales, as well as to size equipment for producing, treating and potentially selling/using the biogas. Estimating the biogas produced is a complicated process, encompassing many different factors of digester design, waste characteristics, and environmental factors.
To assist in this estimation, we have developed software that allows a user to predict the biogas production from mixed wastes and dairy manure based on changing herd sizes, as well as providing the ability to vary the timing and volume of addition of multiple organic wastes, throughout the course of a simulated year. With this user-friendly tool, we hope to enable producers to better explore the opportunities that co-digestion offers.
What Did We Do?
The originally developed Cornell Anaerobic Digester Simulations software allowed the user to input a herd size and to select how much (if any) of seven wastes would be co-digested with the dairy manure. This rudimentary method of simulation assumed that the same volume/mass would be applied to the digester in a steady-state constant fashion for the entire year that the simulations were run for. However, that is unlikely to be the case in a real-world production environment.
In the new version of the software, we have incorporated the characteristics of over 200 wastes into a user selectable interface. Once a waste type is selected, the user has the option to select when the waste is placed into the digester, whether that be on an everyday, weekly, monthly or custom basis with the option to select to which months of the year the additions occur. When selecting a weekly or monthly basis, the user can select which day(s) of the week or month wastes are added, and in the custom basis, the user can select which days of the year additions occur.
Once the timing of addition is completed, the user can select how much of the waste is applied during each addition. Whether that be a constant volume for each addition, or a custom volume for each addition.
The data for the specific wastes includes the dry matter and organic matter content as well as the biogas and methane yields. Based on the type of waste we have also assigned a “digestibility” curve to the particular waste which when assuming a first order kinetic model of gas production, can provide the production of gas a function of time. The production of biogas from all added wastes and the added manure is then summed for each day of the year to provide an estimate of the biogas production, on a daily basis, that can be summarized with a minimum/maximum/average on a monthly and annual basis.
What Have We Learned?
During the process of developing the software, we examined a few different techniques for estimating the timing of biogas production from co-digested wastes. There are more complicated models available such as Anaerobic Digestion Model #1 (ADM1), however many more parameters must be known/estimated for each waste type, (not to mention requiring a much more complicated user interface). We felt that using a simplified first order kinetic model provides a good way to add the necessary complexity to model biogas production over time without overly complicated calculations. The simplification allowed us to include a more complicated and yet more real world means of modeling the addition of wastes to a digester that wouldn’t be possible with more complicated digestion/biogas production models.
Future Plans
Currently, the Cornell Dairy Anaerobic Digestion Simulation Software is capable of predicting the amount of heat necessary to maintain digester temperatures, as well as the parasitic electrical load. Future additions will include modeling the energy usage (and effects on biogas) of treatment processes to produce Renewable Natural Gas (RNG) from biogas.
We would also like to include the ability to track nutrients through the process of digestion. Nutrient additions from the co-digestion of wastes also represent an important consideration for farm as they may or may not have the land base/crop requirements to use all of the imported nutrients. The cost of treatment of the effluent from the digester to remove nutrients, or the shipment of effluent off site may have to be added into the determination of how much of a “tipping fee” a farmer would need to charge for taking an organic waste for co-digestion.
We hope to make the program freely available to the public to use. Currently, the software is written in MATLAB which ordinarily requires a license to operate, however it is possible to create an executable standalone program that can be shared and run without the need to purchase MATLAB.
Authors
Timothy Shelford, Extension Associate, School of Integrated Plant Science, Cornell University
Corresponding author email address
tjs47@cornell.edu
Additional authors
Curt Gooch, Senior Extension Associate Emeritus, Department of Biological and Environmental Engineering, Cornell University
Peter Wright, Agricultural Engineer, Department of Animal Science, Cornell University
Lauren Ray, Agricultural Energy Systems Engineer, Cornell University
The authors are solely responsible for the content of these proceedings. The technical information does not necessarily reflect the official position of the sponsoring agencies or institutions represented by planning committee members, and inclusion and distribution herein does not constitute an endorsement of views expressed by the same. Printed materials included herein are not refereed publications. Citations should appear as follows. EXAMPLE: Authors. 2022. Title of presentation. Waste to Worth. Oregon, OH. April 18-22, 2022. URL of this page. Accessed on: today’s date.
The MAnure PHosphorus EXtraction (MAPHEX) System for Removing Phosphorus, Odor, Microbes, and Alkalinity from Dairy and Swine Manures
Abstract
Animal manures contain nutrients [primarily nitrogen (N) and phosphorus (P)] and organic material that are beneficial to crops. Unfortunately, for economic and logistics reasons, liquid dairy and swine manure tends to be applied to soils near where it is generated. Over time, P concentrations in soils where dairy manure is applied builds up, often in excess of crop demands. We previously (Church et al., 2016, 2017) and have subsequently built, a full-scale version of a MAnure PHosphorus EXtraction (MAPHEX) System capable of removing greater than 90 percent of the P from manures. While originally designed to remove phosphorus, we have also shown that the MAPHEX System was also capable of removing odor and microbes, and of concentrating alkalinity into a solid, economically transported form. We have also lowered daily operating costs by testing the effect of lower-cost chemicals as alternatives to ferric sulfate, and by showing that the diatomaceous earth (DE) filtering material can be recycled and reused. We are currently building a system capable of treating over 100,000 gallons of Dairy Manure per day. This system is planned to be operational for demonstrating starting summer 2022.
Purpose
Swine and dairy manures are typically in slurry form and contain nutrients [primarily nitrogen (N) and phosphorus (P)] and organic material that are beneficial to crops. Unfortunately, the concentrations of nutrients in both manures are too low to make transportation of bulk manures over large distances economically viable. Furthermore, since it must be transported in tanks, that transportation is inconvenient as well. Therefore, these manures tend to be applied to soils near where they are generated, and, over time, P concentrations in soils increase to the point that soil P concentrations are often in excess of crop demands. Furthermore, because of the implication that P runoff from agricultural operations plays an important role in eutrophication of streams and other water bodies, farmers are experiencing increasing pressures and regulation to not apply animal manures to those soils.
We previously reported on an invention that 1) is designed to be a solution to the P overloading that happens when unnecessary P is added to agricultural soils, 2) is scalable such that it can be used as a mobile system, and 3) has shown to be capable of removing greater than 90 percent of the P from a wide range of dairy manures, while retaining greater than 90% of the N in the final effluent for beneficial use by the farmer.
What Did We Do?
We subsequently built a full-scale version of a MAnure PHosphorus EXtraction (MAPHEX) System capable of removing greater than 90 percent of the P from manures and have tested it on dairy manures. We also focused our efforts on lowering the daily operating costs of the system by developing a method to recover and reuse the diatomaceous earth used in the final filtration step, and testing alternative, lower cost chemicals that can be used in the chemical treatment step. We also performed pilot-scale tests on swine manures.
What Have We Learned?
The full-scale MAPHEX System removed greater than 90% of P from a wide variety of dairy manures, while leaving greater than 90% of the N in the final effluent to be used beneficially to fertigate crops. The System was also shown to recover and concentrate alkalinity into a solid form on a farm that used greater amounts of lime during manure handling, remove 50% of the odor from dairy manure and to remove greater than 80% of Total coliforms and E. Coli. Furthermore, the System has not shown to alter the pH of the final effluent respective to raw manures as other treatment technologies can. We have lowered daily operating costs by testing the effect of lower-cost chemicals as alternatives to ferric sulfate, and by showing that the diatomaceous earth (DE) filtering material can be recycled and reused.
In pilot-scale swine testing, we found that the MAPHEX System can remove greater than 96% of the phosphorus in swine manures. This essentially P free effluent can be beneficially used for fertigation without further loading the receiving soils with P. Scaling up the pilot-scale testing has the potential to reduce swine manure storage volumes to allow for mitigation of overflow problems during large storms. Furthermore, the pilot-scale study suggests that capital equipment costs and treatment costs for swine manure would be lower than for treating dairy manure.
Future Plans
We are currently building a simplified version of the MAPHEX System that will be capable of treating over 100,000 gallons of dairy manure per day. This system is planned to be operational for demonstrating starting summer 2022. We plan to use this simplified version for demonstration tests, and use the results obtained to model the effects of using MAPHEX technology compared to conventional manure handling practices on two paired watersheds. We also plan to demonstrate the full-scale system on a wide range of swine manures with on-farm testing.
Author
Clinton D. Church, Research Chemist, USDA-ARS University Park, PA
Corresponding author email address
Cdchurch.h2o@netzero.com
Additional Information
Church, C. D., Hristov, A. N., Bryant, R. B., Kleinman, P. J. A., & Fishel, S. K. (2016). A novel treatment system to remove phosphorus from liquid manure. Applied Engineering in Agriculture, 32: 103 – 112. doi:10.13031/aea.32.10999
Church, C. D., Hristov, A. N., Bryant, R. B., & Kleinman, P. J. A. (2017). Processes and treatment systems for treating high phosphorus containing fluids. US Patent 9,790.110B2.
Church, C. D., Hristov, A. N., Kleinman, P. J. A., Fishel, S. K., Reiner, M. R., & Bryant, R. B. (2018). Versatility of the MAPHEX System in removing phosphorus, odor, microbes, and alkalinity from dairy manures: A four-farm case study. Applied Engineering in Agriculture, 34: 567 – 572. doi:10.13031/aea12632
Church, C. D., Hristov, A., Bryant, R. B., & Kleinman, P. J. A. (2019). Methods for Rejuvenation and Recovery of Filtration Media. USDA Docket Number 129.17. U.S. Patent Application Serial No. 62/548,23
Church, C. D., S. K. Fishel, M. R. Reiner, P. J. A. Kleinman, A. N. Hristov, and R. B. Bryant. 2020. Pilot scale investigation of phosphorus removal from swine manure by the MAnure PHosphorus Extraction (MAPHEX) System. Applied Engineering in Agriculture 36(4): 525–531. doi: 10.13031/aea13698
https://www.ars.usda.gov/people-locations/person/?person-id=40912
https://tellus.ars.usda.gov/stories/articles/mining-manure-for-phosphorus/
https://agresearchmag.ars.usda.gov/2016/dec/phosphorus/
https://jofnm.com/article-112-Packaging-phosphorus-for-the-future.html
The authors are solely responsible for the content of these proceedings. The technical information does not necessarily reflect the official position of the sponsoring agencies or institutions represented by planning committee members, and inclusion and distribution herein does not constitute an endorsement of views expressed by the same. Printed materials included herein are not refereed publications. Citations should appear as follows. EXAMPLE: Authors. 2022. Title of presentation. Waste to Worth. Oregon, OH. April 18-22, 2022. URL of this page. Accessed on: today’s date.