Feedlot Air Emissions Treatment Cost Calculator

logoThere are several techniques that animal feeding operation owners and managers can use to manage odors and gas emissions. Each technique has different costs and benefits. The Feedlot Air Emissions Treatment Cost Calculator is a tool that can be used to compare alternative technologies and designs with different costs and benefits. The calculator has information on biofilters, covers, scrubbers, manure belts, vegetative buffer and anaerobic digesters.

This spreadsheet tool is intended to assist the operator of a livestock or poultry operation to calculate the costs and benefits of installing technologies to treat odors and gases that could be emitted from the facility.

Download the Air Emissions Treatment Cost Calculator

The tool requires Excel 2007 or later versions. Download the spreadsheet. Note: This is a spreadsheet with active macros. Depending on your security settings, you may have to tell your spreadsheet program that it is OK to open it. The four videos below provide instructions on how to use the decision tool.

Instructional Videos for the Air Emissions Treatment Cost Calculator

Four videos below describe the cost calculator and how to use it.

Introduction

Biofilters and Covers

Scrubbers, Manure Belts, Buffers, Digesters

Benefits and Summary

Acknowledgements

Additional materials in this series (videos):

The Feedlot Air Emissions Treatment Cost Calculator was developed by Dr. Bill Lazarus (wlazraus@umn.edu) in the Applied Economics Department at the University of Minnesota for a multistate USDA funded research and Extension project. The calculator was suggested by stakeholders that included producers and managers of swine, poultry and dairy producing operations, equipment manufacturers and suppliers, human medicine, veterinary medicine, local and state regulators, local and county elected officials, Extension and NRCS.

Supported by the National Institute of Food and Agriculture, U.S. Department of Agriculture, under Agreement No. 2010-85112-20520. If you have any questions about the project, contact Dr. Kevin Janni, University of Minnesota, kjanni@umn.edu

What Is Manure Worth Web Calculator


Livestock producers face uncertain markets and narrow margins

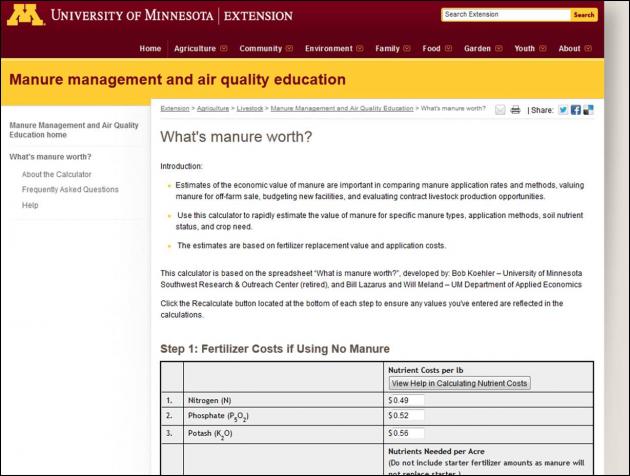
calculatorThis situation motivates growers to optimize production methods, utilizing all resources including manure. In addition, an increase in the price of commercial fertilizer experienced since 2009, has heightened interest in the use of manure for supplying crop nutrients and has significantly increased the value of manure as a nutrient source.

Estimates of the economic value of manure are important in comparing manure application rates and methods, valuing manure for off-farm sale, budgeting new facilities, and evaluating contract livestock production opportunities.

Free Manure Value Calculator

The University of Minnesota has developed a free calculator to rapidly estimate the value of manure for specific manure types, application methods, soil nutrient status, and crop need.

For more information, see the University of Minnesota’s page on Animal Waste/Manure Economics

The estimates are based on fertilizer replacement value and application costs. The manure economic value is calculated as shown below.

Net Economic Impact of Manure = Value of First-Year Fertilizer Replaced (N, P2O5, K2O, and micronutrients) & Fertilizer Application Costs Avoided + Residual Value in the Second Year or Later (if any, this relates to fertilizer nutrients that would have been purchased) +/- Non-NPK Yield Response (and possibly tillage impacts and weed control impacts)

Simple Steps to Evaluate Manure Value

In Step 1, enter current fertilizer (if using no manure) and N, P, K, and micronutrients needs for the crop.

In Step 2, choose the manure source, amount and nutrient content, and application method.

Step 3 considers some final adjustments such as second year benefits, tillage saving and yield boost impact.

Swine WFNB Tools

Tools

Whole Farm Nutrient Balance Calculator for Swine Farms

This tool is a Microsoft Excel based program that calculates the WFNB.

WFNB is a method for defining the overall nutrient use facility on a livestock facility including both the animal and cropping system. It encourages comparison of all nutrients entering and exiting a livestock farm with the goal of achieving a ratio of 1 lb input to 1 lb managed output. It also can be used to evaluate all nutrient management options for achieving a sustainable production facility for nutrients.

Introduction to Opportunities Checklist for My Farm’s Whole Farm Nutrient Balance

Reductions in nutrient losses to the environment may depend upon the following changes: storage and handling practices, feed management, nutrient management planning, exporting of manure, etc.

Opportunities Checklist for Feed Management

If an estimate of Whole Farm Nutrient Balance for your farm identified opportunities for nitrogen or phosphorus balance improvement, then consider feed management practices for their potential to improve a nutrient balance.

Opportunities Checklist for Cropping System

If an estimate of Whole Farm Nutrient Balance for your farm identified opportunities for nitrogen or phosphorus balance improvement, then consider crop management practices for their potential to improve a nutrient balance.

Opportunities Checklist for Manure Export

If an estimate of Whole Farm Nutrient Balance for your farm identified opportunities for nitrogen or phosphorus balance improvement, then consider manure export practices for their potential to improve a nutrient balance.

Opportunities Checklist Manure Treatment, Storage, and Handling

If an estimate of Whole Farm Nutrient Balance for your farm identified opportunities for nitrogen or phosphorus balance improvement, then consider manure storage and handling practices for their potential to improve a nutrient balance.

Animal Waste Management Software Training Video

Design of manure storage and treatment facilities requires an understanding of the operations involved in food animal production and engineering design principles. It also requires access to manure production data, climate data, as well as reporting and presentation software to put it all together. The USDA Natural Resources Conservation Service created the Animal Waste Management computer program to bring all of these features together.

This software has been used by consultants and government technical service providers for a number of years in designing storage and treatment facilities for animal production operations all over the country. The 2008 EPA CAFO rules cite this tool as part of the procedure to determine if a facility will discharge animal waste.

Watch the Video


Just as no engineering design software is simply plug and play, this software tool requires an understanding of the operations involved as well as experience with using the tool itself, its features and its limitations. This training video describes the basic features of how to use the software, from download to final design. Here you will learn about each screen of the tool and how each component contributes to the facility design. You’ll also learn about the data needs of the software and how to edit the native data set used by the NRCS developers of the tool.

Author

John Classen, North Carolina State University

Phosphorus Mass Balance on Livestock and Poultry Operations

Introduction

This fact sheet has been developed to support the implementation of the Natural Resources Conservation Service Feed Management 592 Practice Standard. The Feed Management 592 Practice Standard was adopted by NRCS in 2003 as another tool to assist with addressing resource concerns on livestock and poultry operations. Feed management can assist with reducing the import of nutrients to the farm and reduce the excretion of nutrients in manure.

Please check this link first if you are interested in organic or specialty dairy production

The Natural Resources Conservation Service has adopted a practice standard called Feed Management (592) and is defined as “managing the quantity of available nutrients fed to livestock and poultry for their intended purpose”. The national version of the practice standard can be found in a companion fact sheet entitled An Introduction to Natural Resources Conservation Service (NRCS) Feed Management Practice Standard 592. Please check in your own state for a state-specific version of the standard.

Mass balance is calculated as the difference between imported and exported mass across the farm boundary. Estimating mass balance can provide critical information for (comprehensive) nutrient management planning and to manage the movement of nutrients and manure. Estimation of whole-farm P mass balance is used to determine the acres of land needed for crop production to use manure P. Environmental risk to surface and ground waters is increased if the amount of P imported into the farm (e.g., from fertilizers, feeds, and animals) exceeds the amount of P exported from the farm (e.g., crops, animals, manure, milk, meat, eggs, and fibers).

In Table 1 are estimates of P excretion derived by mass balance calculations using standard diets, animal performance, and the acres needed for land application at a crop removal rate of 50 pounds P2O5/acre per year. Mass balance estimates vary among farms, depending upon specific inputs and outputs, and should be calculated specifically for each farm when doing nutrient management planning.

Table 1. Examples of annual phosphate (P2O5) excretion and acreage needed for various livestock enterprises per 1,000 head of production to maintain zero P mass balance (imported P = exported P) annually.
Livestock Enterprise Pounds P2O5 Acres needed
Growing-finishing beef 17,500 350
Horses 22,000 440
Lactating dairy cows 86,000 1,720
Dairy heifers 27,000 540
Laying hens 1,200 24
Cow-calf beef 48,000 960
Sheep 13,500 270
Swine breeding herd with phytase 37,000 740
Swine growing-finishing with phytase 3,600 72
Turkeys with phytase 1,300 26

Ways to affect P mass balance

Farms may consider moving manure off site to reduce P mass balance if not enough acreage is available. Additionally, potential feeding strategies to reduce P balance (and excretion), feed costs, and necessary land base include the following:

  1. Routinely complete laboratory analyses of feeds and re-balance rations as needed to meet animals’ P requirements.
  2. Formulate rations to meet the animal’s P requirements for maintenance, lactation, growth, and pregnancy. In general for a lactating Holstein cow, 1 gram of P for each pound of milk produced is sufficient to meet these combined requirements. Based on this, ration P should equal 0.32 to 0.38% in DM depending on feed intake and milk yield (NRC, 2001). Greater concentrations are not necessary unless feed intake is depressed.
  3. Beef and dairy cattle rations may not need P supplementation at all to meet the animals’ requirements if basal ration ingredients have high P concentrations. Discontinuing P supplementation may reduce land base required by 25 to 50% (depending on the amount of over-supplementation in the original feeding program).
  4. If typical rations (e.g., corn silage, soybean meal, alfalfa, and corn grain) contain more P than needed to meet requirements, and if land base is limiting, alternative feedstuffs should be considered. The cost of using alternative feedstuffs may be less than the cost of using common “least-cost” feeds and managing excess manure P.
  5. Swine and poultry are able to absorb only part of the P in diets, so formulate based on “available P.” Grains for swine and poultry can vary from 14 to 50% in available P. In contrast, over 90% of ration P is available to cattle and sheep due to rumen microbial phytase.
  6. Supplemental phytase in corn-soybean meal based-diets for swine and poultry increases the P availability so that 25 to 35% less total ration P is needed.
  7. Pelleting and reducing the particle size of rations can increase the efficiency of P use by swine and poultry by 5 to 10%.
  8. Formulating rations for specific production phases, genotypes and genders. “Phase- feeding” programs for growing swine, poultry and lactating dairy cows can reduce P imports and excretion at least by 5 to 10%.

References

National Research Council. 2001. Nutrient Requirements of Dairy Cattle. 7th rev. ed. Natl. Acad. Sci., Washington, DC.

“Extension programs and policies are consistent with federal and state laws and regulations on nondiscrimination regarding race, sex, religion, age, color, creed, national or ethnic origin; physical, mental or sensory disability; marital status, sexual orientation, or status as a Vietnam-era or disabled veteran. Evidence of noncompliance may be reported through your local Extension office.”


Disclaimer

This fact sheet reflects the best available information on the topic as of the publication date. Date 5-25-2007

This Feed Management Education Project was funded by the USDA NRCS CIG program. Additional information can be found at Feed Management Publications.

Image:Feed mgt logo4.JPG

This project is affiliated with the LPELC.

Image:usda,nrcs,feed_mgt_logo.JPG

Project Information

Detailed information about training and certification in Feed Management can be obtained from Joe Harrison, Project Leader, jhharrison@wsu.edu, or Becca White, Project Manager, rawhite@wsu.edu.

Author Information

David Beede
C.E. Meadows Professor
beede@msu.edu
Dale Rozeboom
Associate Professor
rozeboom@msu.edu
Department of Animal Science
Michigan State University

Reviewer Information

Brian Perkins – Consulting Nutritionist

Katherine Knowlton – Virginia Tech

Partners

Image:Logos2.JPG

State Specific Manure Nutrient Management Information

Why is State Specific Nutrient Management Information Important?

State or regionally specific factors such as climate and soils impact the many manure nutrient management recommendations for application rates and best management practices (BMPs). In addition, state specific public policy may also establish minimum expectations and required practices.

Finally, state land grant university research may have identified preferred procedures for implementing crop nutrient recommendations or manure nutrient management that may differ from other states. Regardless of the driving force, it is recommended that nutrient management plans follow state specific recommendations for crop nutrient requirements, crop availability of manure nutrients, BMPs, and planning and record expectations.

Click on Your State to View Links to State-Specific Nutrient Management Information

If there is no information linked to your state on this map, it is recommended that you contact your land grant university, county Cooperative Extension office, or county or state USDA Natural Resources Conservation office. If your farm falls among those covered by state or federal regulation, your state’s environmental regulatory agency should also be contacted.

View Larger Map

Additional Information Sources on State Specific Nutrient Management

  • The Manure Management Planner computer program developed at Purdue University is one source of state specific information. The software currently supports 34 states (AL, AR, CA, CO, DE, FL, GA, IN, IL, IA, KS, MA, KY, MD, MI, MN, MO, MS, MT, NE, ND, NJ, NM, OH, OK, OR, PA, RI, SD, TN, UT, VT, WA and WI) by automatically generating fertilizer recommendations and estimating manure N availability based on each state’s Extension and/or NRCS guidelines. Check with your state to be sure the Manure Management Planner meets state specific nutrient management plan criteria.

Page Manager. Rick Koelsch, University of Nebraska, rkoelsch1@ unl.edu
Reviewers: Doug Beegle, Pennsylvania State University, and John Lory, University of Missouri

Estimating Manure Nutrient Excretion

Printer friendly version

Introduction

This fact sheet has been developed to support the implementation of the Natural Resources Conservation Service Feed Management 592 Practice Standard. The Feed Management 592 Practice Standard was adopted by NRCS in 2003 as another tool to assist with addressing resource concerns on livestock and poultry operations. Feed management can assist with reducing the import of nutrients to the farm and reduce the excretion of nutrients in manure.

The Natural Resources Conservation Service has adopted a practice standard called Feed Management (592) and is defined as “managing the quantity of available nutrients fed to livestock and poultry for their intended purpose”. The national version of the practice standard can be found in a companion fact sheet entitled “An Introduction to Natural Resources Feed Management Practice Standard 592”. Please check in your own state for a state-specific version of the standard.

Please check this link first if you are interested in organic or specialty dairy production

Estimating Manure Nutrient Excretion

The front and back end of an animal is connected. While this principle seems obvious, it has historically been ignored in nutrient planning procedures. This fact sheet describes tools that allow integration of feed management and animal performance into nutrient planning processes for animal feeding operations.

A new standard published by the American Society of Agricultural and Biological Engineers (D384.2, Manure Production and Characteristics) is a tool for developing farm specific Comprehensive Nutrient Management Plans (CNMP). This standard allows accurate estimates of nutrient and solids excretion reflective of feed programs and animal performance. Accurate estimates of manure excretion are critical to estimating land requirements and land application costs, sizing manure storage, and planning treatment technologies. This fact sheet will introduce the new manure excretion standard and its application.

Contents of the Manure Production Standard

An ASABE committee of animal scientists and agricultural engineers developed predictive equations for estimating manure excretion for five species (beef, dairy, horse, poultry, and swine) and “typical” characteristics for excreted and as-removed manure. The standard is found at ASABEfollowed by a search of “Standards” and “Title” options for “Manure Production”. The ASABE standard includes seven sections.

Section 1 lists a new “typical” characteristics tabular summary for individual species and groupings of animals. See Tables 1 and 2.(PDF file) These values should provide a reasonable estimate of excretion for animals in the year 2000. As time passes, published typical values become less accurate and should be used with caution for individual herds or flocks. Differences in genetics, feed program, and animal performance between individual farms create a potential for errors when typical values are applied. They may have value for preliminary nutrient planning estimates but should NOT be used in final farm-specific nutrient management plans.

Sections 2 through 7 define the equations for cattle, dairy cattle, horses, poultry (separate sections for meat birds and layers), and swine, respectively. Equation based estimates are provided for all species groups for dry matter, N and P excretion. Equations for estimating additional characteristics are available for some species.

Section 8 of the new standard summarizes As-Removed manure characteristics. The work group summarized a wide range of data sets for inclusion in this section. These values can be beneficial for estimating storage volumes and manure application rates when no other farm-specific information is available. However, when farm specific manure samples are available, they are preferred.

Two Approaches for Estimating Excretion

Two distinctly different approaches were used equation based estimates of excretion. The beef, swine, and poultry work groups used an animal mass balance approach (Figure 1). Excretion is estimated as a difference between feed nutrient intake and retention in body mass or animal products (eggs or milk). intake and retention in body mass or animal products (eggs or milk). The dairy and horse work groups used existing data sets as a basis for multi-variable regression analysis. The dairy work group proposed equations for lactating cows, dry cows and heifers. The horse work group chose to publish separate equations for exercised and sedentary horses. See Table 1. Estimated typical manure (urine and feces combined) characteristics as excreted by meat-producing livestock and poultry.(PDF file) Diet based numbers are in BOLD. Source ASAE D384.2 March 2005, Manure Production and Characteristics.

Figure 1. Mass balance approach was used for estimating excretion haracteristics for beef cattle, swine and poultry.

Factors Affecting Nutrient Excretion

The new standard defines the relationship between feed inputs and animal performance and manure excretion characteristics. For example, the quantity of solids excreted is directly tied to the dry matter digestibility of the diet. Since dry matter digestibility for many species is often 80 to 85% (15 to 20% of solids in feed excreted in feces), small changes in dry matter digestibility produce large differences in solids excreted. A dietary modification that changes dry matter digestibility change from 85% to 80% results in 33% more solids in the feces. Similarly, dietary intake of protein and phosphorus is directly related to excreted N and P.

Historically, manure excretion estimates have been based upon standards published by the ASABE, USDA Natural Resources Conservation Service, and Midwest Plan Service. These previous standards varied excretion estimates with species and animal weight only. A linear relationship was assumed between excretion and body weight. However, this approach provides a poor explanation of important biological factors that influence manure excretion. In addition, these standards become dated with time because they do not recognize changes in genetics, animal performance, and feeding options. Current and past excretion estimates based upon species and body weight alone often produce inaccurate estimates of manure excretion for individual farms.

The standard for manure excretion released by ASABE in 2005 was designed to provide farm-specific estimates of excretion reflective of individual farm feed programs and animal performance. In addition, this standard will better adapt to changes in excretion that occur over time due to factors such as improved animal genetics. Thus, the equation based standard for manure excretion released in 2005 should remain accurate well into the future.

Is This Important?

Tables 3, 4, and 5(PDF file) illustrate excretion estimates for beef, swine, and dairy calculated from the new equations. Some of the more dramatic differences between the current ASABE and other standards are associated with P and total solids excretion. These differences tend to become larger as emerging feed technologies reduce nutrient excretion and as feeding of by-products of corn processing and other food processing industries become increasingly popular. To illustrate the importance of the new ASABE standard for farm specific estimates, comparisons are illustrated below for three species.

Beef

A comparison of excretion characteristics estimated by the new ASABE standard with past standards (Table 3, Rows A-C) suggests that previous estimates are in reasonable agreement for N excretion but in poor agreement with P excretion. A significant effort to better match beef cattle rations with phosphorus requirements has reduced P excretion substantially.

Considerable variation exists between individual cattle feedlots relative to performance and feed program strategies. Substantial variation in N and P excretion is anticipated when comparing a corn based ration (Table 3, Row C) and a ration with 40% distillers grains (Table 3, Row D). Combining feed program variation with typical ranges in animal performance can produce a 2-fold range in N excretion and a 3-fold range in P excretion (Table 3, Rows F and G). Large errors in beef cattle excretion estimates are common unless performance and feed program are considered in estimating excretion.

Swine

Typical nitrogen excretion estimates for swine for the new standard have changed little from the past ASAE standard (Table 4, Rows A-B). However, phosphorus excretion is substantially lower than other standards. Total solids excretion is also generally lower than previously accepted values.

Table 4 illustrates the importance of a standard that responds to emerging feeding strategies (Table 4, Row C). Diets based on use of crystalline amino acids and phytase have the potential for lowering dietary CP and P levels and N and P excretion. A low CP diet would produce N excretion levels up to 40% less than new standard typical value. Low P diets would reduce P excretions levels by 33 to 40% from new typical values.

Dairy Cattle

Generally the new ASABE standard predicts greater excretion of nutrients and solids as compared to the past ASAE standard and other existing accepted values for lactating cattle (Table 5, Rows A and B. Steadily increasing milk production will create an even larger disparity between predicted excretion by the new ASABE standard and other past values.

Tools for Applying ASABE Standard

The proposed ASABE equations complicate the process of estimating nutrient and solid excretion. Software tools based upon these equations provides one option for improving the utility of equations and their application to farm specific CNMPs. Two spreadsheet tools use the ASABE estimate of excreted nutrients as a basis for estimating land requirements for managing manure nutrients. A Nutrient Inventory comes with instructions and a one-hour video discussing its application (available at University of Nebraska). A second tool nearing completion (FNMP$) will estimate land requirements, cost and time required for land applying manure, and potential economic benefits of manure nutrients (will be available at the same web site).

A simplified hand calculator of nutrient excretion was introduced in a MWPS publication, Manure Characteristics (Table 6). It uses a mass nutrient balance procedure for estimating excretion for beef, dairy, poultry and swine. It provides a simplified approach that produces similar answers to procedures used in the ASABE standard.

Information Requirements for Using New Standard

The information requirements of the new standard are greater than with past standards. Farm specific information is needed for animal performance ( e.g. weight gain or milk production) and feed program (dry matter intake and nutrient concentration). Those input requirements are summarized in [media:Table7excretion.pdf | Table 7]].

Applications of New ASABE Standard

Most nutrient planning processes follow a step-wise procedure similar to that illustrated in Figure 2. At this time, the equation-based estimates of solids and nutrients will have their greatest utility in the strategic or long-term planning. These strategic plans are of greatest value to a new or expanded facility or when a regulatory permit is being assembled.

Figure 2 illustrates a second critical planning phase, the Tactical or Annual Plan. For decisions such as manure application rates, timing, and location, constantly changing conditions such as weather and residual soil nutrients must be considered. On-farm data such as manure samples will likely be of greater value to annual planning processes than the predictions made by the new ASABE equations
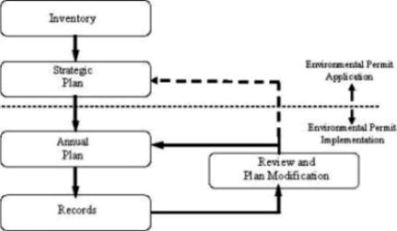
Figure 2. Common planning procedure used for nutrient management planning.

Improvements in nutrient excretion estimates offered by the new equations should improve the accuracy of farm-specific planning for:

  • Land requirements for managing N and P. The equations provide a more accurate estimate of nutrient driven land requirements for manure application when on-farm data on manure production is not available. Nitrogen volatilization and availability estimates remain a weak point for this planning process.
  • Cost of manure application. The ASABE equations are being used to estimate manure nutrient value as well as time, equipment, and labor requirements for handling manure (Kissinger et al., 2005).
  • Ammonia emissions. Ammonia emissions from animal facilities are of increasingly interest to the regulatory community. The equations should provide a mechanism for adjusting farm emission estimates based upon several farm-specific factors.

The equations also allow a prediction of dry matter excretion and possibly volatile solids excretion if feed digestibility values are known. This approach will allow farm specific estimates of solids excretion that will benefit planning estimates of:

  • Anaerobic and aerobic lagoon sizing,
  • Anaerobic digester sizing and gas production,
  • Storage sizing if solids estimates are combined with known moisture contents resulting from specific manure handling systems

Summary

The new ASABE standard for manure excretion provides an important tool for key strategic planning activities important to a comprehensive nutrient management plans. In addition, the new standard provides an important tool for integrating feed management decisions into CNMPs and deciding the environmental and economic benefits and costs of feed program options.

Related Files

To follow the references in this article, it is recommended that you print these four PDF files and refer to them at the appropriate places in the article.
Tables 1 and 2
Tables 3, 4 and 5
Table 6
Table 7

Disclaimer

This fact sheet reflects the best available information on the topic as of the publication date. Date 5-25-2007

Acknowledgements

This Feed Management Education Project was funded by the USDA NRCS CIG program. Additional information can be found at Feed Management Publications.
Image:Feed mgt logo4.JPG This project is affiliated with the Livestock and Poultry Environmental Learning Center.

Image:usda,nrcs,feed_mgt_logo.JPG

Project Information

Detailed information about training and certification in Feed Management can be obtained from Joe Harrison, Project Leader, jhharrison@wsu.edu, or Becca White, Project Manager, rawhite@wsu.edu.

Author Information

R.K. Koelsch, University of Nebraska-Lincoln

Images: CC 2.5 Rick Koelsch

Partners

Logos2.JPG

“Extension programs and policies are consistent with federal and state laws and regulations on nondiscrimination regarding race, sex, religion, age, color, creed, national or ethnic origin; physical, mental or sensory disability; marital status, sexual orientation, or status as a Vietnam-era or disabled veteran. Evidence of noncompliance may be reported through your local Extension office.”

Software and Web-Based Resources for Nutrient Management

Why Utilize Tools for Nutrient Planning?

The process of nutrient management planning can be complex and time consuming. Doing a good job requires:

  • collecting and organizing extensive information about a farm;
  • making a diverse series of decisions and calculations about crops, fertilizer and manure management; and
  • communicating the completed plan to a multiple audiences including the farmer.

There is an expanding list of web-based and personal-computer-based tools that can help nutrient management planners write effective nutrient management plans. Some of these tools help with a specific element of the nutrient management process where others perform multiple parts of the process.

The objective of this page is to show some of the diversity in software tools that may be useful to nutrient management planners. The listing is not and cannot be comprehensive and will focus on tools that have a national audience. Some state-specific tools are included if they provide a particularly unique service or approach.

There are many state-specific tools. If you see a helpful resource on this site you may want to search for an analogous program developed in your region or state that may have more relevant supporting data integrated into the program. Links to state-specific nutrient management pages may be listed on State Specific Manure Nutrient Management Information.

Data Collection and General Information

  • Google Map provides aerial view of areas of interest and driving directions. A good place to get started.
  • University of Missouri National Data Finder. Download spatial and soils data needed to run RUSLE2, MMP and SNMP for any location in the U.S. Includes selected soils data and black and white georeferenced aerial photos (DOQ’s). Clip areas up to 10,000 acres.
  • University of Missouri Animal Feeding Operation Site Assessment Tool (AFO SITE): Available only for Missouri. Web-based application that produces a detailed site assessment evaluating the sites suitability for an animal feeding operation.
  • Web Soil Survey. Download tabular and spatial soils data for U.S. counties. Whole county data sets sent in an email.
  • NRCS Geospatial Gateway provides access to a diverse set of spatial layers. Cannot clip to area of interest so file sizes typically too large to download over the internet.
  • USDA National Agricultural Imagery Program provides georeferenced aerial photography of agricultural land taken during the growing season. The imagery is available for download as mosaicked DOQQ’s either individually or as compressed county images.

Nutrient Balance Calculators

Whole farm nutrient balance looks at all nutrient imports and exports on a farm and can be a useful tool to evaluate the nutrient status of a farm. Are there too many nutrients? Is the farm nutrient deficient?

  • University of Nebraska Nutrient Balance Calculator. A spreadsheet based calculator. The web site includes links to good supporting information.
  • Cornell University Nutrient Balance Calculator. A spreadsheet based calculator. The web site includes links to good supporting information.

Nutrient Management Software

This software helps the user through the many steps of completing a nutrient management plan. Many states have there own software including NC, NY, VA, and WI.

  • Purdue’s Manure Management Planner. The most complete multi-state software for writing nutrient management plans. Includes state-specific fertilizer recommendations, manure nutrient availability calculations and generates plans that meet national standards for USDA-NRCS and EPA. Automated links to SNMP for geographic information and to the record keeping program WinMax. A free stand alone program available for 34 states.

Economics of Manure Management

What is manure worth? This can be a complicated question to answer. These tools provide some help in making economic decisions about manure.

  • Feed Nutrient Management Planning Economics (FNMP$): a comprehensive program connecting feed ration characteristics, manure storage type and cropping systems impacts on the value of manure as a fertilizer. FNMP$ estimates: 1) manure nutrients, 2) land requirements, 3) labor and equipment application time, and 4) costs and value for land application. Spreadsheet-based program. Instructions for program.
  • University of Missouri Manure Value Spreadsheet A spreadsheet-based calculator of the fertilizer value of manure based on manure test results, crop fertilizer recommendations and fertilizer prices.
  • University of Minnesota What Is Manure Worth? spreadsheet.

Other Tools and Resources

  • Spatial Nutrient Management Planner (SNMP): an ArcView 3.x program that facilitates delineating farm fields, mapping setbacks and soil test levels and calculating field sizes and spreadable acres. Available for all states. Links automatically to MMP. An ArcView 9.x version to be released soon.
  • Revised Universal Soil Loss Equation ver. 2 (RUSLE(2)): Used by USDA-NRCS to estimate edge-of-field erosion losses. Complicated to get started and not fully intuitive to use. The good news is that it will soon be fully integrated into MMP.
  • NRCS eFOTG (electronic Field Office Technical Guide: This is not software, but this website has links to conservation standards such as Nutrient Management (590) and Waste Utilization (633) for every state. Search in section IV under “Conservation Practices”.
  • Phosphorus Index: There is no national P index. Instead individual states have developed P indexes that meet the needs of their state. Look for information about the P index through the state NRCS office or Land Grant University.
  • Animal Waste Management (AWM) software: Facilitates sizing of manure storage facilities for animal feeding operations. Estimates the volume of manure, waste water and solids generated by animals in confinement. Does not address state-specific requirements. Some states have state-specific programs. To view a tutorial on using this software, see Animal Waste Management Software Training Video

If there is web page or software program you would like to have included on this webpage please contact John Lory.

Author: John Lory, University of Missouri, loryj@missouri.edu
Reviewers: Rick Koelsch, University of Nebraska and Rich Meinert, University of Connecticut

Linking Feed Management to Whole Farm Nutrient Management

Nutrients in feed is the primary source of Nitrogen, Phosphorus, and Potassium that is imported to livestock and poultry farms. This webcast highlights a decision aid tool that follows the nutrients in feed all the way to the land application of manure for crop production. This presentation was originally broadcast on October 17, 2014. More… Continue reading “Linking Feed Management to Whole Farm Nutrient Management”