Livestock manure nutrients can be variable depending on animal species, age, diet, management, housing, climate, and manure storage and handling. Thousands of samples are analyzed every year by agricultural laboratories across the United States (U.S.). While many published manure characteristics are two decades old, this study provides an updated glimpse into more recent manure data from thousands of samples across the country and reviewed possible trends from 2012-2022 by U.S. regions for common animal categories.
What Did We Do?
We collected manure nutrient data from participating U.S. laboratories and this data was aggregated by researchers at the University of Minnesota into ManureDB, a manure nutrient test database. By February 2024, ManureDB included over 490,000 samples from across the U.S. With ManureDB, data was filtered for the time period from 2012-2022 and common U.S. animal manure categories (solid beef, liquid beef, solid dairy, liquid dairy, solid chicken-broiler, solid chicken-layer, solid turkey, and liquid swine manure) to update nutrient summary statistics for total nitrogen (TN), ammonium-N (NH4-N), phosphorus (P2O5), and potassium (K2O) using the approximately 325,000 samples. Samples were divided by designating samples with <10% total solids as liquid manure and samples with >10% total solids as solid manure. Data was also analyzed to assess regional nutrient comparisons and trends for regions with sufficient samples.
What Have We Learned?
Regional differences impacted nutrient concentrations in solid and liquid manures. When comparing regions with at least 500 samples per animal manure category across 2012-2022 we found significant differences in nutrient concentrations in 66% of the individual year comparisons for solid manures and 91% of comparisons for liquid manures for all four analytes.
Between 2012 and 2022, significant increasing or decreasing nutrient (TN, NH4-N, P2O5, K2O) trends were evident in 25% of solid samples and 18% of liquid samples. The only significant trend for solid beef manure was a decreasing trend in the SE region for NH4-N. Both the solid chicken-broiler SE and NE regions had significant decreases in NH4-N, and only the SE had an increasing trend for K2O. The SE region for solid chicken-layer had decreasing trends for NH4-N, P2O5, and K2O. For solid dairy manure, the MW region only had a decreasing trend for P2O5, while the NE region had decreasing trends for N and NH4-N. Solid turkey manure only had significant trends for P2O5, with the MW increasing and the SE decreasing. Liquid beef manure had no significant trends. For liquid dairy manure, only the NE region had significant decreasing trends for all four nutrients. For liquid swine manure, only the SE region had significant increasing trends for NH4-N.
Standardizing nomenclature and increasing manure sample details, especially with animal life stage and manure storage information on manure sample submittal forms, will further improve ManureDB’s usefulness.
Future Plans
We continue to expand and refine ManureDB by adding data each year, additional labs, making the website more user-friendly, and enhancing data quality control. We archived the first set of data with Ag Data Commons in 2024 and plan to do that annually. We also plan to publish several papers regarding the development of the database and analysis of the manure nutrient data.
Authors
Presenting & corresponding author
Nancy L. Bohl Bormann, Researcher, University of Minnesota, nlbb@umn.edu
Additional authors
Melissa L. Wilson, Associate Professor, University of Minnesota
Erin L. Cortus, Associate Professor and Extension Engineer, University of Minnesota
ManureDB is supported through USDA NIFA Award 2020-67021-32465 and Cooperative Ecosystem Studies Unit program [grant no. NR253A750008C001] from the U.S. Department of Agriculture — Natural Resources Conservation Service.
The authors are solely responsible for the content of these proceedings. The technical information does not necessarily reflect the official position of the sponsoring agencies or institutions represented by planning committee members, and inclusion and distribution herein does not constitute an endorsement of views expressed by the same. Printed materials included herein are not refereed publications. Citations should appear as follows. EXAMPLE: Authors. 2025. Title of presentation. Waste to Worth. Boise, ID. April 7–11, 2025. URL of this page. Accessed on: today’s date.
The goal of this demo is to give our audience an initial experience with the Manure Management Decision-Support Tool (DST), to engage interest, and to seek input on the user interface for the results output and development considerations. While we will briefly describe the User Input page and inner workings of the Tool, we will focus most of this discussion on the Results Output, including variables of interest and the effectiveness of the user interface for conveying this information.
Presenters include: Erin Scott and Varma Vempalli
The authors are solely responsible for the content of these proceedings. The technical information does not necessarily reflect the official position of the sponsoring agencies or institutions represented by planning committee members, and inclusion and distribution herein does not constitute an endorsement of views expressed by the same. Printed materials included herein are not refereed publications. Citations should appear as follows. EXAMPLE: Authors. 2022. Title of presentation. Waste to Worth. Oregon, OH. April 18-22, 2022. URL of this page. Accessed on: today’s date.
In the spring of 2021, Rick Koelsch and Leslie Johnson shared these activities with a number of educators across the U.S. and encouraged them to download electronic copies of all resources, which were adaptable for their state, in order to begin sharing a highly interactive and peer-to-peer educational experience. This workshop will continue that education. This workshop will again share the original curriculum for teaching animal manure management and will highlight adaptations of the exercise for teaching similar concepts to the same and different audiences. Part of the workshop will be a train-the-trainer on how to use the original mapping exercise. Additionally, participants will preview variations on the exercise that have been developed for different audiences including crop producers that may not have their own livestock and women in agriculture. Finally, we’ll brainstorm other ideas and plant the seeds of development for future similar curriculum development and adaptation.
What Did We Do?
An educational curriculum was pilot tested in 2020 by Extension professionals in Nebraska and Minnesota. The curriculum includes a 25-square mile map, scenarios set up for six animal feeding operations (you pick one for your group), four fields for land application with simplified information cards, worksheets, and one-page information sheets for each of the six scenarios. These activities often lead to lots of peer-to-peer teaching. As participants work through these discussions, they add their happy and sad face emojis to the map to weigh the benefits and concerns connected to individual fields. The curriculum has been utilized across the state of Nebraska with livestock producers, and in Minnesota with custom manure applicators, livestock producers, and county feedlot officers.
In Michigan, an adaptation was developed with scenarios for three locations looking at the environmental, economically, and social aspects of manure and fertility management. Then, with the help of farm business educators, the scenarios were integrated with a new tool developed to look at the costs of different fertility programs to determine what is best for participant farms.
Minnesota took the activity and made digital versions of the game pieces to be used in an online activity. They utilized Jamboard and breakout rooms in Zoom to work through the scenarios.
In Nebraska, the water quality scenario part of the curriculum has been updated slightly to include water quality concerns not only about manure, but also about commercial fertilizer and nitrogen leaching. This was done as part of an adaptation for use in Nitrogen Management Trainings that are hosted by various Natural Resource Districts (NRDs). Other scenarios were developed to teach how to calculate a realistic yield goal and various nitrogen credits that should be considered when determining a nitrogen fertilizer rate.
Another variation in Nebraska took the manure credits exercise from the nitrogen management variation and reworked it for teaching how to determine a manure application rate on both a nitrogen and phosphorus basis to learners that had not previously utilized manure as a fertilizer, but rather were primarily spreading manure to dispose of it.
What Have We Learned?
Since beginning use of the mapping exercise, participant discussion throughout our annual land application training program has increased dramatically. This increased their satisfaction with the program as well. Because the mapping exercise requires active participation in the program, very few trainees feel comfortable sitting back to passively learn the materials, but rather they are discussing with their neighbor and attempting the exercises. Most notably, participants are usually surprised when we get through the exercise and they have completed their training. They’re busy working and forget to watch the clock, which is a wonderful complement to the program. Evaluations at the end of the program indicate that the favorite part of the program is the interactive map, group work and discussions and the ability to “visualize and understand nutrient application”.
While we expected there to be a need to have a facilitator at each table initially, experience has shown that a facilitator can handle multiple tables. Facilitators are helpful to keep participant discussions on-track and progressing through the exercise, often needing to point out instructions within the exercise. Room setup matters as does the size of the group. To make this curriculum work, large round tables with up to 8-10 participants are ideal, but 2 rectangular tables pushed together can work well too. Smaller groups work better but the nitrogen management variation has been used successfully with up to 85 participants at a time, surrounding multiple maps.
Future Plans
Continued updating of the curriculum and additional scenarios will be necessary as land application training for Nebraska livestock producers is required every 5 years, and the Nebraska Extension manure team attempts to not do the same program for the same audience more than once. This workshop will hopefully lead to future collaborations and ideas for additional or modified scenarios.
Authors
Presenting authors
Leslie Johnson, Animal Manure Management Extension Educator, University of Nebraska – Lincoln
Todd Whitney, Water & Cropping Systems Extension Educator, University of Nebraska – Lincoln
Sarah Fronczak, Environmental Management Educator, Michigan State University
Corresponding author
Leslie Johnson, Animal Manure Management Extension Educator, University of Nebraska – Lincoln
The original mapping exercise was developed in partnership with Nutrient Advisors, Ward Laboratories, Settje Agri-Services, and University of Minnesota Extension with funding from the North American Manure Expo and the North Central Region Water Network. Partners for the development of nitrogen management variations included the Lower Platte North and Upper Big Blue NRD.
The authors are solely responsible for the content of these proceedings. The technical information does not necessarily reflect the official position of the sponsoring agencies or institutions represented by planning committee members, and inclusion and distribution herein does not constitute an endorsement of views expressed by the same. Printed materials included herein are not refereed publications. Citations should appear as follows. EXAMPLE: Authors. 2022. Title of presentation. Waste to Worth. Oregon, OH. April 18-22, 2022. URL of this page. Accessed on: today’s date.
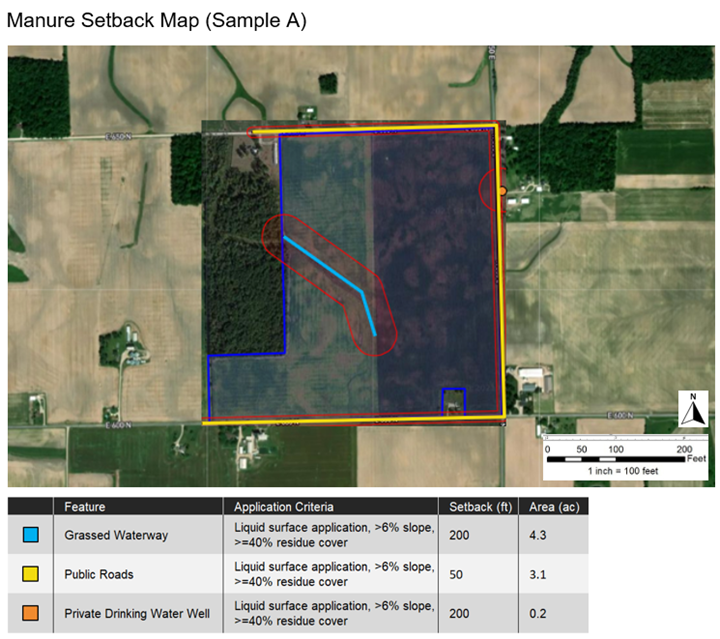
MyFarms, the software development team that manages the Manure Management Planner (MMP) desktop application, is now making it easy for TSPs to make beautiful manure setback maps that comply with government guidelines for use in Comprehensive Nutrient Management Plans (CNMPs). After using the MyFarms web-based platform to navigate a simple process (described below), the TSP will be able to download three digital assets from MyFarms including: 1.) The *.mmp project file, 2.) The PDF manure setback map book, and 3.) Manure setback images. TSPs will benefit from producing these downloads whether they use MMP or not and at any point in the planning process (i.e., before, during, or after entering data into MMP).
What Did We Do?
TSPs will begin by using MyFarms, a cloud-based field data management platform, to automatically fetch field boundaries from other cloud-based applications, such as Climate FieldView or the John Deere Operations Center. If the producer does not use one of those systems, the TSP can upload shapefiles, after exporting them from a different system. Or, if the producer has no field boundaries available, they can be created in MyFarms using existing field geometries.
After setting up field boundaries, the TSP will navigate a wizard-like process to create a “Feature Map” including wells, streams, water control structures, facilities, and roads. Then, the TSP can create a “Manure Setback Map” (below), by specifying the manure application practice(s) associated with each feature. As each selection is made, MyFarms dynamically calculates the setback area surrounding the feature so the user can easily see the relationship between the application practice, the setback distance, and the setback area.
After a setback map has been created for each field, the TSP can export the data they entered in MyFarms as an *.mmp project file, which can be used to create a new project in MMP. If the TSP has already used MMP to generate a CNMP in Word format, they can export setback map images and paste them into the Word document. Or, if the TSP does not use MMP at all, they can export the setback maps as a standalone document in PDF format.
What Will You Learn in this Workshop?
You will learn of what NRCS is doing to modernize the manure management planning process through state-of-the-art, cloud-based software. As a starting point, you will learn how to create professional looking manure setback maps more accurately and easily than ever before. Following the workshop, MyFarms will be available to register your own account, so you can take what you have learned into your next CNMP-focused client engagement.
Future Plans
The MMP Download(s) solution is the first of numerous steps that will be taken by Purdue University, NRCS, and MyFarms to modernize the manure management planning workflow. Over time, state-specific policies, logic, and reference data will be added to this foundation, to deliver a more pleasing end-to-end user experience.
Authors
Chris Fennig, Managing Director, MyFarms
Corresponding author email address
chris.fennig@myfarms.com
Additional Information
purduemmp.myfarms.com
Acknowledgements
This solution is being built in partnership with Purdue University and NRCS.
The authors are solely responsible for the content of these proceedings. The technical information does not necessarily reflect the official position of the sponsoring agencies or institutions represented by planning committee members, and inclusion and distribution herein does not constitute an endorsement of views expressed by the same. Printed materials included herein are not refereed publications. Citations should appear as follows. EXAMPLE: Authors. 2022. Title of presentation. Waste to Worth. Oregon, OH. April 18-22, 2022. URL of this page. Accessed on: today’s date.
As a primarily mined material, the global reserve of phosphorus (P) is finite and running out. Consequently, inorganic, commercial fertilizers are becoming more expensive. Chemical engineering techniques have been developed and are being actively researched to recover P from wastewater sources in the form of struvite (MgNH4PO4 · 6H2O). Many wastewaters contain elements such as P and nitrogen (N) in various forms that could be recovered and beneficially recycled as fertilizer nutrients. Recovering nutrients, such as P, from wastewaters and/or treating wastewaters to the point they could be safely recycled back into the environment could have a tremendously positive impact on any agricultural activity as well as receiving waters.
Arkansas has a documented significant geographic nutrient imbalance, where the row-crop-dominated region of eastern Arkansas has a severe nutrient deficiency, particularly for P, which routinely requires commercial P applications to supply crop needs for optimum production. Thus, eastern Arkansas is an ideal setting for testing the effectiveness of recovered nutrients from wastewaters as fertilizer sources, especially P, for various row crops, namely rice, corn, and soybeans. A sustainable, wastewater-recovered source of P, in the form of the mineral struvite, would be a critical advancement in the long-term viability of P availability, P-source options, and use as a fertilizer in P-deficient soils used for crop production.
What Did We Do?
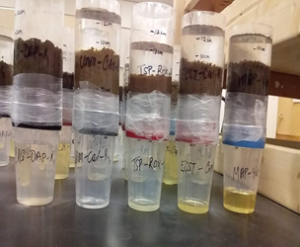
Figure 1. Image of the moist-soil, plant-less laboratory incubations with various soil and fertilizer-P treatment combinations.
Various studies were conducted to evaluate the behavior of struvite in different soils and crop response to struvite as compared to other commonly used, commercially available fertilizer-P sources [i.e., monoammonium phosphate (MAP), diammonium phosphate (DAP), triple superphosphate (TSP), and rock phosphate (RP)]. Two struvite materials were tested, a chemically precipitated struvite (CPST) created from real wastewater treatment plant effluent and an electrochemically precipitated struvite (ECST) created in the laboratory with an innovative electrochemical approach.
Figure 2. Image of the column-leaching experimental set-up with various soil and fertilizer-P treatment combinations.
In the laboratory, a series of plant-less soil incubation experiments were conducted in several different agricultural soils to evaluate the behavior of struvite and the other fertilizer-P sources as they solubilize. Soil pH, water-soluble and plant-available P, magnesium (Mg), calcium (Ca), iron (Fe), nitrate and ammonium concentrations were measured over a 4- to 9-month period in moist/aerobic and saturated/flooded/anaerobic soil conditions (Figure 1). A column study was also conducted to evaluate the effects of fertilizer-P source, including ECST and CPST, on P-leaching characteristics over time in multiple soils (Figure 2).
Figure 3. Image of the rainfall-runoff experimental set-up.
Additionally, a rainfall-runoff simulation experiment was conducted to evaluate the effects of water source (i.e., rainfall, groundwater, and struvite-removed wastewater) and fertilizer-P source on runoff water quality parameters (i.e., pH, electrical conductivity, and P, N, Mg, Ca, and Fe concentrations) in various soils (Figure 3).
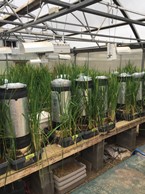
Figure 4. Image of rice growing in the greenhouse in response to various fertilizer-P sources with chambers in the tubs to measure greenhouse gas emissions.
In the greenhouse, several potted-plant studies were conducted for 60-90 days evaluating above- and below-ground plant response to ECST, CPST, MAP, DAP, TSP, RP, and unamended controls in rice, corn, soybeans, and wheat. Studies were also conducted to evaluate the effects of fertilizer-P source (i.e., ECST, CPST, DAP, TSP, and an unamended control) on greenhouse gas emissions (i.e., CO2, CH4, and N2O) from flood- and simulated-furrow-irrigated rice (Figure 4).
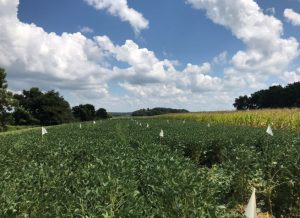
In the field, two-year studies have been conducted in soil having low soil-test-P to evaluate the effects of fertilizer-P source (i.e., ECST, CPST, MAP, DAP, TSP, RP, and an unamended control) on above- and below-ground dry matter and tissue P, N, and Mg concentrations, aboveground tissue P, N, and Mg accumulations, and yields in rice, corn, and soybeans, as well as soil P concentrations in corn and soybeans (Figure 5).
Figure 5. Image of a field study with soybean and corn grown in response to various fertilizer-P sources.
What Have We Learned?
For the moist-soil incubations, averaged across fertilizer sources, differences in water-soluble soil P concentration [from their initial concentrations] differed among soils over time and, averaged across soils, among fertilizer sources over time. In addition, averaged across time, Mehlich-3-extractable soil P concentration differences from their initial concentrations differed among fertilizer sources within soils. For the flooded-soil incubations, averaged across fertilizer sources, the change in soil pH from the initial differed among soils over time. In addition, averaged across soils, the change in water-soluble soil P concentration from the initial differed among fertilizer sources over time. Results from the plant-less soil incubation experiments show that many elemental soil concentrations, namely P, and soil pH differed among soil-fertilizer-P-source combinations over time. However, in general, the two struvite materials (ECST and CPST) behaved similarly to one another and behaved similarly to at least one other commonly used, commercially available fertilizer-P source without any large, unexpected outcomes across several different agricultural soils with varying soil textures. Struvite appears to relatively similar soil behavior as other commercially available fertilizer-P sources.
For the greenhouse study, no differences were identified in soybean plant properties. However, corn plant properties and corn and soybean elemental tissue concentrations differed (P < 0.05) among fertilizer amendments. Total corn dry matter from ECST did not differ from that from RP and TSP and was 1.2 times greater than that from CPST Belowground corn dry matter from ECST was 1.9 times greater than that from CPST, TSP, DAP, and the unamended control treatments Corn cob-plus-husk dry matter from CPST and ECST were similar. Corn belowground tissue P concentration from CPST did not differ from that from DAP, TSP, and MAP and was 1.4 times larger than that from ECST. Corn cob-plus-husk tissue P concentration from ECST was similar to that from MAP and DAP and was 1.2 times larger than that from CG. Corn stem-plus-leaves tissue P concentration from ECST differed from that from all other treatments and was 1.8 times greater than that from the unamended control. Struvite appears to be a viable, alternative fertilizer-P source.
For the 2019 rice field study, neither above- or belowground P, Mg, and N tissue concentrations differed among fertilizer sources. For the 2019 corn field study, neither above- or below-ground P, Mg, and N tissue concentrations differed among fertilizer sources. For the 2019 soybean field study, neither aboveground Mg or N nor belowground P, Mg, and N tissue concentrations differed among fertilizer sources. However, aboveground tissue P concentration was greater from ECST than from RP and the unamended control. For the 2020 rice field study, aboveground dry matter and aboveground dry matter P, N, Mg concentrations did not differ among fertilizer sources. However, rice grain yield from ECST was similar to that from CPST, but both were lower than from TSP. Aboveground Mg uptake from ECST was greater than that from CPST. For the 2020 corn field study, total aboveground, cob/husk, and stalk/leaves dry matter, aboveground P, N, and Mg concentrations and uptake, and belowground P and N concentrations did not differ among fertilizer sources. However, corn yield was larger from ECST than from all other fertilizer treatments, which did not differ among themselves. Belowground Mg concentration was numerically largest from ECST among all fertilizer-P treatments and was significantly greater than that from MAP, DAP, and TSP. For the 2020 soybean field study, neither aboveground dry matter nor yield differed among fertilizer sources. Similar to greenhouse results, struvite appears to be a viable, alternative fertilizer-P source for multiple agronomic crops, including rice, corn, and soybean.
Results from a greenhouse trial in 2021 showed that, across 13 sample dates over a nearly 4-month period evaluating the effects of fertilizer-P source on greenhouse gas fluxes and emissions from flood-irrigated rice, CO2 fluxes were unaffected by fertilizer-P source, but differed over time, while both CH4 and N2O fluxes differed among fertilizer-P treatments over time. Furthermore, results showed generally lower CO2, CH4, and N2O fluxes from ECST than from the other fertilizer-P sources and numerically lower CO2 and N2O season-long emissions from ECST than from the other fertilizer-P sources, while CH4 emissions from ECST were numerically lower than from CPST in flood-irrigated rice. Electrochemically precipitated struvite may have potential to reduce greenhouse gas emissions from flood-irrigated rice.
Future Plans
Future plans include additional laboratory rainfall-runoff simulation experiments, greenhouse potted-plant trials, and field studies to evaluate the effects of real-wastewater-derived struvite compared to other commonly used, commercially available fertilizer-P sources on soil and plant response as well as greenhouse gas emissions.
Authors
Presenting author
Lauren F. Greenlee, Associate Professor, Pennsylvania State University
Corresponding author
Kristofor R. Brye, University Professor, University of Arkansas
Corresponding author email address
kbrye@uark.edu
Additional authors
Lauren F. Greenlee, Associate Professor, Pennsylvania State University
Niyi Omidire, Post-doctoral Research Associate, University of Arkansas
Tatum Simms, Graduate Research Assistant, University of Arkansas
Diego Della Lunga, Graduate Research Assistant, University of Arkansas
Ryder Anderson, former Graduate Research Assistant, University of Arkansas
Shane Ylagan, Graduate Research Assistant, University of Arkansas
Machaela Morrison, Graduate Research Assistant, University of Arkansas
Chandler Arel, Graduate Research Assistant, University of Arkansas
Additional Information
Anderson, R., K.R. Brye, L. Greenlee, and E. Gbur. 2020. Chemically precipitated struvite dissolution dynamics over time in various soil textures. Agricultural Sciences 11:567-591.
Ylagan, S.R., K.R. Brye, and L. Greenlee. 2020. Corn and soybean response to wastewater-recovered and other common phosphorus fertilizers. Agrosystems, Geosciences & Environment 3:e20086.
Anderson, R., K.R. Brye, L. Greenlee, T.L. Roberts, and E. Gbur. 2021. Wastewater-recovered struvite effects on total extractable phosphorus compared with other phosphorus sources. Agrosystems, Geosciences & Environment 4:e20154.
Anderson, R., K.R. Brye, L. Kekedy-Nagy, L. Greenlee, E. Gbur, and T.L. Roberts. 2021. Total extractable phosphorus in flooded soil as affected by struvite and other fertilizer-P sources. Soil Science Society of America Journal 85:1157–1173.
Anderson, R., K.R. Brye, L. Kekedy-Nagy, L. Greenlee, E. Gbur, and T.L. Roberts. 2021. Electrochemically precipitated struvite effects on extractable nutrients compared to other fertilizer-P sources. Agrosystems, Geosciences & Environment 4:e20183.
Omidire, N.S., K.R. Brye, T.L. Roberts, L. Kekedy-Nagy, L. Greenlee, E.E. Gbur, and L.A. Mozzoni. 2021. Evaluation of electrochemically precipitated struvite as a fertilizer-phosphorus source in flood-irrigated rice. Agronomy Journal 114:739–755. DOI: 10.1002/agj2.20917
Brye, K.R., and L.F. Greenlee. 2022. What is struvite and how is it used? Blog post for Soil Science Society of America’s “Soils Matter” blog (https://soilsmatter.wordpress.com/).
Acknowledgements
The authors acknowledge funding from the USDA NIFA AFRI Water for Food Production Systems program, grant #2018-68011-28691 and funding from the National Science Foundation, grant #1739473.
The authors are solely responsible for the content of these proceedings. The technical information does not necessarily reflect the official position of the sponsoring agencies or institutions represented by planning committee members, and inclusion and distribution herein does not constitute an endorsement of views expressed by the same. Printed materials included herein are not refereed publications. Citations should appear as follows. EXAMPLE: Authors. 2022. Title of presentation. Waste to Worth. Oregon, OH. April 18-22, 2022. URL of this page. Accessed on: today’s date.
Discuss different perspectives on challenges and opportunities
Develop a better understanding of what changes are needed in industry, academia and agencies
Identify and prioritize actions for further consideration and strategic planning
Challenges This Session Will Address
Industry organizations, such as DMI, are creating sustainability goals, e.g., GHG emissions and water quality, but often do not have personnel with the training (engineering, technical) and background to help make these goals a reality. Furthermore, they may not have a good understanding of what expertise and/or capabilities they need or should be expected from recent graduates.
Universities face challenges in providing students the course work and training opportunities so graduates possess an appropriate level of the technical/engineering knowledge/skills desired by industry and agencies to help meet sustainability goals. Focused training generally requires collaboration with industry/agencies and sharing of resources to meet needs of all parties.
Students often have great interest in environmental science curricula, but graduates of such programs may not possess the level of technical training desired. Students who are willing to invest in developing their technical capabilities need to have some confidence that there will be meaningful employment opportunities for them in organizations related to animal agriculture or they will pursue training and opportunities in other fields.
Panelists
Becky Larson, University of Wisconsin (Moderator), larson@wisc.edu
Michelle Rossman, Dairy Management Inc. (Industry)
Amy Millmier Schmidt, University of Nebraska – Lincoln (Faculty)
Sam Mullins, Livestock and Environmental Permitting, Ohio Department of Agriculture (Government Agency)
Mara Zelt, University of Nebraska – Lincoln (Recent Student)
The authors are solely responsible for the content of these proceedings. The technical information does not necessarily reflect the official position of the sponsoring agencies or institutions represented by planning committee members, and inclusion and distribution herein does not constitute an endorsement of views expressed by the same. Printed materials included herein are not refereed publications. Citations should appear as follows. EXAMPLE: Authors. 2022. Title of presentation. Waste to Worth. Oregon, OH. April 18-22, 2022. URL of this page. Accessed on: today’s date.
Dairy farming is known to emit greenhouse gases (GHG), both from direct and indirect emission sources. Carbon dioxide (CO2) is emitted from the combustion of deep sequestered fossil fuel while non/temporarily sequestered, biologically mediated, methane (CH4) and nitrous oxide (N2O) are emitted by various sources, most notably by cattle, feed production, and manure management.
Dairy farmers and their key advisors, the balance of the dairy value chain, policy makers, government officials, non-governmental organizations (NGOs), and astute consumers value best available information about the greenhouse gas (GHG) emissions associated with milk production. In 2020, the Innovation Center for US Dairy (IC) set three 2050 environmental stewardship goals spanning from cradle to processor gate (i.e., milk production and milk processing), including GHG neutrality. Further, the IC committed to outwardly reporting on progress towards the goals every five years starting in 2025.
What Did We Do?
Work focused on the cradle to farm gate (milk production) segment of the overall GHG neutrality goal. A list of considerations deemed important to conduct a robust US dairy GHG analysis was developed and evaluated. The most important key considerations determined were geographic-driven factors and assessment focused approach (i.e., sampling farm population, not sampling). Boundaries for the four areas making up a cradle to farm gate categories for analysis – Cattle (Enteric), Feed, Manure, and Energy – were developed based in part on understanding of where available data is housed and managed by farmers and their custom operators and following Life Cycle Assessment (LCA) practices.
What Have We Learned?
The most important lesson learned was that sampling a farm population and scaling results to represent the US dairy industry GHG emission footprint cannot be used for multiple reasons. First, classical statistics requires a sample needs to be normally distributed about the mean – herd size is not normally distributed among farm size, 80 % cows owned by 20% of the farms and milk production is higher, between 3,000 and 5,000 lbs./cow annually, for larger herds. Second, the data needed from every farm doesn’t exist today. Third, random sampling of MILK and COWS is required, however, farmers are surveyed. Fourth, accurate emission results require a percentage of cows surveyed and the percentage of milk surveyed to be the same; however, the estimated probably is less than 0.0001 that this would occur (once in every 10,000 years if annual surveys were conducted). Lastly, analysis showed that unavoidable and unpredictable error resulted when scaling up sample analysis results to the US dairy population, meaning that a reported carbon dioxide equivalent (CO2e) value would have tremendous uncertainty in direction and magnitude. This is especially challenging when measuring progress toward the 2050 GHG neutrality goal; a population sampling and scaling based approached can result in higher calculated emissions in five years over a current value, even though many farms made notable changes to reduce GHG emissions.
Leaders of the US dairy industry were educated on the challenges of farm sampling and scaling. As a result, the decision was made to approach quantification of the progress toward the 2050 GHG neutrality goal using an approach that removes the need for scaling. That approach is called USDA Cow and Milk Data Focused approach.
Future Plans
Measurement of US dairy’s progress towards its 2050 GHG neutrality goal will be made using the USDA Cow and Milk Data Focused approach; first report on progress due in 2025.
Authors
Curt A. Gooch, Sustainable Dairy Product Owner, Land O’Lakes – Truterra
Roger Cady, Freelance Sustainability Consultant (Retired from industry)
Acknowledgements
Dairy Management Incorporated and the Innovation Center for US Dairy Environmental Stewardship Committee
The authors are solely responsible for the content of these proceedings. The technical information does not necessarily reflect the official position of the sponsoring agencies or institutions represented by planning committee members, and inclusion and distribution herein does not constitute an endorsement of views expressed by the same. Printed materials included herein are not refereed publications. Citations should appear as follows. EXAMPLE: Authors. 2022. Title of presentation. Waste to Worth. Oregon, OH. April 18-22, 2022. URL of this page. Accessed on: today’s date.
Anaerobic digestion (AD) is commonly used in agriculture to break down livestock manure and produce a sustainable source of energy by producing biogas, which is predominantly methane. Digestion of livestock manure can be supplemented with additional agricultural or industrial organic waste, potentially adding sources of revenue to the farm or digestion facility through tipping fees and additional biogas production. However, quantifying the anticipated impact on digester performance and operation is challenging, particularly as some potential feedstocks have not been studied previously. Understanding how a feedstock might impact a digester’s performance is critical, as digester upsets can lead to loss of revenue or even digester failure.
What Did We Do?
We conducted a set of mono-digestion biomethane potential experiments of several feedstocks currently in use at an agricultural AD facility that accepts mixed industrial waste streams in addition to digesting beef manure. The mono-digestion studies used triplicate 1-L working volume batch digesters which ran for 30-38 days. We tested beef manure, off-spec starch from food manufacturing, slaughterhouse wastewater treatment sludge, waste activated sludge from a corn processing facility, soap stock from glycerin refining, filter press slurry from a food grade water treatment facility, and food waste dissolved air flotation sludge. We also included a treatment for the effluent from the digester’s ammonia recovery system and a mixture of all the feedstocks at the same time. A blank (inoculum only) and positive control (cellulose with inoculum) digester were included as controls. This set of studies is described here as Experiment 1 (E1).
We then conducted a set of co-digestion biomethane potential tests combining the manure pairwise with some of the industrial feedstocks, specifically starch, slaughterhouse waste, soap stock, and filter press slurry (Experiment 2 or E2). These combinations were made at two different ratios of the two feedstocks. The first set of treatments combined the manure and an additional substrate at a 1:1 ratio on a volatile solids basis. The second set of treatments combined the feedstocks proportional to the amounts commonly used in the AD facility providing the materials. A final treatment pairing starch and soap stock at a 3:1 ratio was also included. These co-digestion treatments were conducted in triplicate alongside a single mono-digestion treatment of each feedstock for comparison. Finally, we examined the potential synergistic or antagonistic impacts of these combinations on methane yield and production rate. This was done by comparing the measured methane production at each time point compared to the expected methane production if the feedstocks each contributed additively to the methane production.
What Have We Learned?
Figure 1 shows the cumulative specific biogas production on a volatile solids basis for the mono-digestion experiment (E1). Some feedstocks, such as soap stock and slaughterhouse waste, experienced a substantial lag phase at the beginning of the experiment, which may have been due to the high levels of lipids and proteins.
Figure 1: Average biogas production of all treatments during mono-digestion experiment (Experiment 1).
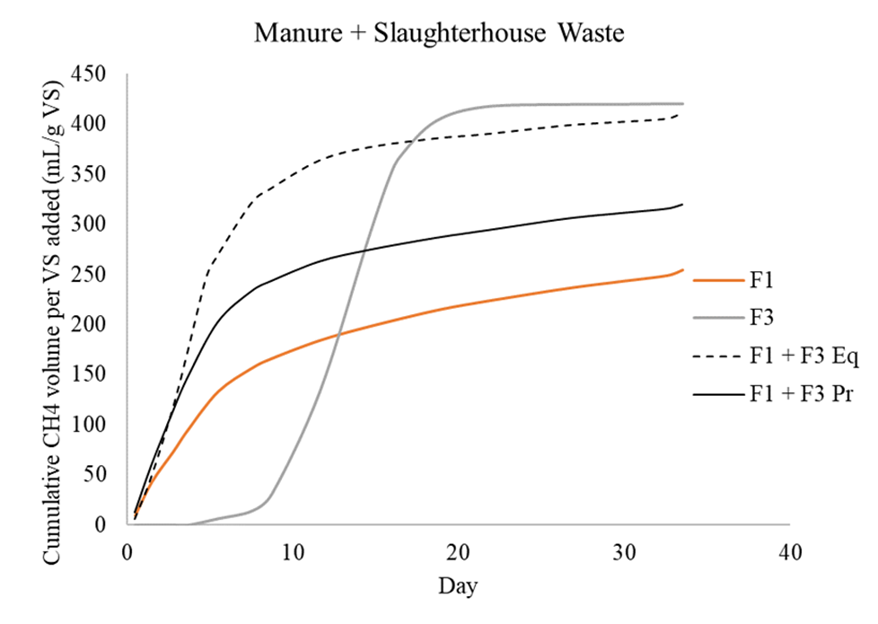
During the co-digestion experiment (E2), we observed both total yield and kinetic synergy in all treatments. Only two digesters (one of the replicates from the starch and manure proportional treatment and one from the starch and soap stock treatment) produced substantially less (<30%) methane than would be expected for an additive effect for more than one day. This effect can be seen in Figure 2, which shows the cumulative methane curves (corrected for inoculum contribution and averaged over the three replicates) of the mono-digestion digesters for manure and starch individually and the curves for both co-digestion treatments using both manure and starch. Figure 3 shows the same curves for the co-digestion of manure and slaughterhouse waste. These co-digestion treatments show that combining the feedstocks causes an increase in methane production at a faster rate. They also show that co-digestion alleviates the lag phase experienced by the slaughterhouse waste.
Figure 2: Cumulative specific methane production for manure (F1) and starch (F2). F1 + F2 Eq = 1:1 ratio of VS; F1 + F2 Pr = ratio of VS is proportional to what full-scale digester receives.Figure 3: Cumulative specific methane production for manure (F1) and slaughterhouse waste (F3). F1 + F3 Eq = 1:1 ratio of VS; F1 + F3 Pr = ratio of VS is proportional to what full-scale digester receives.
Future Plans
We plan to continue exploring the impact of co-digestion on methane yield and production rate by using additional combinations of these feedstocks and exploring the impact of macromolecular composition (percentages of carbohydrates, proteins, and lipids) on synergistic effects. These results will help inform current or future agricultural AD operators regarding the use of co-digestion feedstocks for optimal energy production and best practices in selecting new feedstocks for co-digestion.
Authors
Jennifer Rackliffe, Graduate Research Fellow, Purdue University
This material is based upon work that is supported by the National Institute of Food and Agriculture, U.S. Department of Agriculture, under agreement number 2020-38640-31522 through the North Central Region SARE program under project number GNC21-334. USDA is an equal opportunity employer and service provider. Any opinions, findings, conclusions, or recommendations expressed in this publication are those of the author(s) and do not necessarily reflect the view of the U.S. Department of Agriculture. We also thank Purdue’s Institute for Climate, Environment and Sustainability for supporting the dissemination of this work. Finally, we acknowledge the assistance of Gabrielle Koel, Kyra Keenan, Amanda Pisarczyk, and Emily McGlothlin in conducting the laboratory work.
The authors are solely responsible for the content of these proceedings. The technical information does not necessarily reflect the official position of the sponsoring agencies or institutions represented by planning committee members, and inclusion and distribution herein does not constitute an endorsement of views expressed by the same. Printed materials included herein are not refereed publications. Citations should appear as follows. EXAMPLE: Authors. 2022. Title of presentation. Waste to Worth. Oregon, OH. April 18-22, 2022. URL of this page. Accessed on: today’s date.
The purpose of this study was to develop and analyze potential recipes for composting swine lagoon sludge. Composting is a simple treatment; it is widely adopted on farms, generates a stable value-added stackable product, and conserves organic matter and nutrients. All these benefits along with an affordable cost and lower environmental emissions make it a potential candidate for the management of lagoon sludge, a byproduct of swine operations in southeast US.
Sludge accumulation in lagoons can result in increased odor from lagoons, impact animal productivity, increase risk of environmental and social consequences and lead to operation non-compliance. Developing affordable sludge management alternatives is important because current practices (land application post dredging and dewatering using organic polymers and geo-bags) are not widely adoptable, cost-prohibitive and non-sustainable (Owusu-Twum and Sharara, 2020, Soil facts) and current farm nutrient management plans do not consider management of sludge nutrients.
What Did We Do?
We developed two recipes by mixing different sludge amounts with locally available low-cost amendments: poultry litter, Bermuda hay, yard debris and lagoon liquid. We composted these recipes in triplicates using 13-cubic feet in-vessel composters and recorded changes in temperatures, weight loss, volume, moisture, and organic matter. We also recorded greenhouse gases emitted from the piles at regular intervals. Forced, intermittent aeration was maintained during composting for replicates to ensure adequate oxygen supply and avoid prematurely drying mixtures. Finally, we analyzed the final compost to determine its suitability as a soil amendment.
We used the observations from the experiments to evaluate if proposed recipes resulted in successful compost and determine whether sludge inclusion significantly impacts composting process and product quality. We also analyzed which factors influence weight and organic matter losses in the piles and if the proposed recipes have comparable cumulative GHG and NH3 emissions to previous observations.
What Have We Learned?
We learned that sludge can be composted at both 10% and 20% inclusion rates using the above ingredients, as the process met time and temperatures for pathogen reduction (15A NCAC, 13B.1406) and the final product were stable (TMECC, US Composting council). For 100 lbs. of an initial wet mixture (60.8 to 61.4% moisture) both recipes experienced a total weight loss of 33.8-35.2 lbs. with 24.5 to 25.4 lbs. being lost as moisture and 8.8 to 9.7 lbs. lost as organic matter during the active phase of composting (31 days). Post-screening the recipes resulted in 42.3 to 48.6 lbs. of the stable final product (45 to 47% moisture) that can be directly land applied.
We learned that the composting process generated similar GHG, and ammonia emissions as reported in the previous studies however, most of the methane (CH4) and nitrous oxide (N2O) were generated in the later stages of composting, which can be potentially reduced by proper management of the composting process. Another observation was larger losses in ammonia in the earlier stages of composting which on reduction; using certain additives, changes in recipe or management practices, can result in optimal utilization of nitrogen, increase product value, and reduce environmental impacts.
Future Plans
We plan to further analyze the impact of the composting process on total nutrients and water-extractable fractions, this will provide information on land use rate and potential losses in runoffs. This information is critical for swine lagoon sludge-derived products due to the high concentration of P, Zn, and Cu in sludge as losses can lead to eutrophication in surface and marine waters and potential toxicity in soils.
Future work proposed also involves techno-economic evaluation of this process to determine the cost of treatment, and fair price of the final product. We also plan to conduct a cradle to gate life cycle assessment of the process to determine global warming potential, eutrophication, acidification, and particulate matter generation for farm and large-scale systems. These efforts will help guide further research to improve the technology and provide knowledge to stakeholders and producers on alternative sludge management options.
Figure 1. Swine lagoon sludge composting process and products.
References
Owusu-Twum, M. Y., & Sharara, M. A. (2020). Sludge management in anaerobic swine lagoons: A review. Journal of Environmental Management, 271, 110949.
Soil Facts, Karl A. Shaffer, Dianna Deanna L. Osmond, Sanjay B. Shah, Phosphorus Management for Land Application of Biosolids and Animal Waste, North Carolina Cooperative extension.
Stephanie Kulesza, Assistant Professor, Crop & Soil Sciences, North Carolina State University
Sanjay Shah, Professor and Extension specialist, Bio&Ag. Eng. North Carolina State University
John Classen, Associate Professor, Bio&Ag. Eng. North Carolina State University
Additional Information
Publication is in progress currently so best resource is the corresponding author.
Acknowledgements
We would like to acknowledge the support from Joseph Stuckey and Chris Hopkins (Poultry, livestock, and animal waste management facility, NCSU).
Funding sources
Bioenergy Research Initiative (BRI) – Contract No #17-072-4015, North Carolina Department of Agriculture & Consumer Services
National Institute of Food and Agriculture (NIFA) – Critical Agricultural Research and Extension (CARE) – Award No. 2019-68008-29894, U.S. Department of Agriculture
The authors are solely responsible for the content of these proceedings. The technical information does not necessarily reflect the official position of the sponsoring agencies or institutions represented by planning committee members, and inclusion and distribution herein does not constitute an endorsement of views expressed by the same. Printed materials included herein are not refereed publications. Citations should appear as follows. EXAMPLE: Authors. 2022. Title of presentation. Waste to Worth. Oregon, OH. April 18-22, 2022. URL of this page. Accessed on: today’s date.
The ability to communicate about a scientific topic in a manner that is trusted and compelling is known as “scientific discourse.” The highly globalized, connected, and digital world in which we live today is overwhelming audiences with information sources, many of which are not evidence based. Many mainstream topics have already transcended the realm of simple data presentation and entered the complexities of socio-scientific issues that encompass conflicting principles of ethics, cultural perspectives, and economic theories or human livelihoods. For many complex scientific topics, the dearth of public knowledge and engagement has led to confusion and misunderstanding, exacerbated by the public perception of the media’s authority. Mistaken information and extreme opinions often promote messages of blame. Regardless of subject matter or audience, Extension professionals are expected to impact stakeholder knowledge and behavior through programming that is evidence-based – and often extraordinarily complex. STEM professionals seeking to navigate this information space need new strategies for breaking out from the pack and targeting audiences with new and innovative methods of outreach. This is especially true in emerging and potentially controversial issues like antimicrobial resistance (AMR).
This session – curated by members of the iAMResponsible Project, a nationwide outreach program focused on AMR from the perspectives of food producers and food consumers – will feature experts in science communication discussing scientific discourse. Participants in this session can expect to:
gain knowledge about evidence-based rhetorical elements of successful communication;
learn new ways to approach communication-based on lessons learned from past and current health communication efforts,
and generate innovative ideas for programming based on a proposed model for message design and delivery.
A moderated panel of communication experts will discuss how the public forms their perceptions of science information, the kind of information sources they trust and seek out, and how socioeconomic and cultural differences impact audience engagement with scientific information.
Panel
Amy Schmidt, Associate Professor, University of Nebraska (Moderator)
Having grown up in rural Iowa, Amy appreciates the agricultural production systems that feed people worldwide and chose her career path to support responsible livestock production by helping farmers adopt research-based practices that optimize agronomic productivity and minimize potential environmental and social risks. Keeping up with two active kids, her husband, and their family dog is her other full-time job! She spends a lot of evenings and weekends cheering on her kids at baseball and softball games, about as much time scrubbing dirt and grass stains out of white baseball pants, and not nearly enough time sleeping.
Panelists
Kari Nixon, Assistant Professor, Whitworth University
Kari Nixon is an assistant professor at Whitworth University. Her research focuses on the mutually constitutive nature of social understandings of death, disease, and community. Formerly studying to be a clinical psychologist with an emphasis in data science, she shifted to the humanities early on in her graduate career. Her work has appeared in Disability Studies Quarterly and Journal for Medical Humanities, among others. Her co-edited collections, Endemic: Essays in Contagion Theory and Syphilis and Subjectivity were published with Palgrave in 2016 and ’17, respectively. Her first monograph, Kept from All Contagion: Germ Theory, Disease, and the Dilemma of Human Contact was published in June 2020 with SUNY UP, and her mass-market book teaching lay audiences how to critically interpret COVID-19 public health messaging came out through Simon and Schuster in June 2021
David Lansing, Associate Professor, University of Maryland-Baltimore County
Dr. David Lansing is an Associate Professor in Geography and Environmental Systems at the University of Maryland Baltimore County. Growing up in Wyoming and spending many years in rural areas across Central America, Dr. Lansing has witnessed all types of farming styles and livelihoods. Since 2005 his research has studied how conservation policy is formed and implemented, and the effects such policies have on the land use decisions and livelihoods of farmers. He has conducted research in Costa Rica, Honduras, Maryland, New York, and Nebraska. His more recent work is focused on how various land use stakeholders conceive of the environment, how this affects their approach toward sustainable farming practices, and their relationship toward environmental regulations. He is currently undertaking this approach through a multidisciplinary project that studies changing antibiotic use practices across dairy and beef cattle industries.
Andy King, Assistant Professor, Iowa State University.
Dr. Andy King conducts research in strategic health, science, and risk communication, focusing on message design and campaign evaluation. His work advances applied communication theorizing relevant to message design and message processing, with the goal of contributing to improving public health through evidence-based practice. Much of his research has looked at the role of visual imagery and its influence in strategic health messages. He has published over 40 peer-reviewed journal articles in outlets including Journal of Health Communication, Cancer Epidemiology, Risk Analysis, Journal of Communication and Health Communication and has received research funding from the Health Resources and Services Administration and the National Institutes of Health. He serves on the editorial boards for Communication Monographs and Journal of Health Communication. He is a senior editor at Health Communication.
Acknowledgements
Funding for the iAMR Project was provided by USDA-NIFA Award Nos. 2017-68003-26497, 2018-68003-27467 and 2018-68003-27545. Any opinions, findings, conclusions, or recommendations expressed in this publication are those of the author(s) and do not necessarily reflect the view of the U.S. Department of Agriculture.
The authors are solely responsible for the content of these proceedings. The technical information does not necessarily reflect the official position of the sponsoring agencies or institutions represented by planning committee members, and inclusion and distribution herein does not constitute an endorsement of views expressed by the same. Printed materials included herein are not refereed publications. Citations should appear as follows. EXAMPLE: Authors. 2022. Title of presentation. Waste to Worth. Oregon, OH. April 18-22, 2022. URL of this page. Accessed on: today’s date.
Manage Cookie Consent
To provide the best experiences, we use technologies like cookies to store and/or access device information. Consenting to these technologies will allow us to process data such as browsing behavior or unique IDs on this site. Not consenting or withdrawing consent, may adversely affect certain features and functions.
Functional
Always active
The technical storage or access is strictly necessary for the legitimate purpose of enabling the use of a specific service explicitly requested by the subscriber or user, or for the sole purpose of carrying out the transmission of a communication over an electronic communications network.
Preferences
The technical storage or access is necessary for the legitimate purpose of storing preferences that are not requested by the subscriber or user.
Statistics
The technical storage or access that is used exclusively for statistical purposes.The technical storage or access that is used exclusively for anonymous statistical purposes. Without a subpoena, voluntary compliance on the part of your Internet Service Provider, or additional records from a third party, information stored or retrieved for this purpose alone cannot usually be used to identify you.
Marketing
The technical storage or access is required to create user profiles to send advertising, or to track the user on a website or across several websites for similar marketing purposes.


 Having grown up in rural Iowa,

