Currently, there is limited regulation of ammonia (NH3) emissions as a matter of federal policy. The Clean Air Act (CAA) provides the federal authority for regulation of these emissions. Although there are reporting requirements for NH3 under the Comprehensive Environmental Response, Compensation and Liability Act and Emergency Planning and Community Right-To-Know Act, these statutes do not provide authority to regulate emissions of NH3. There is increasing pressure to change NH3 policy primarily due to concerns about nutrient enrichment of large water bodies, such as the Chesapeake Bay and the Gulf of Mexico. Recently, the EPA has been petitioned to list NH3 as a criteria pollutant; and this request is somewhat supported by the report from the EPA’s Integrated Nitrogen Panel to the Science Advisory Board. There is also the immediate concern of EPA’s treatment of NH3 as a precursor to fine particulate matter (PM2.5). Regulation of NH3 as a precursor to PM2.5 will make it a regulated pollutant under the CAA. It will be difficult to regulate only the ‘excess’ portion of reactive N, particularly since ‘excess’ cannot be defined as a constant. Roughly 60- 85% of NH3 emissions in the U.S. are estimated to come from agricultural sources, a sector that varies considerably from the traditional industrial sources addressed by the environmental statutes. In fact, in most of these statutes, there is recognition that agricultural sources are different; and some regulatory exemptions are provided. Most likely, Congress did not anticipate the application of the CAA to agricultural sources or it would have included some exemptions in it as well. Nevertheless, regulation of NH3 emissions under the CAA will make it extremely difficult for EPA to consider the positive value and need for fertilizer NH3, which could have huge implications for the viability of the domestic and global food supply.
Purpose
Members of the U.S. Department of Agriculture’s Agricultural Air Quality Task Force (AAQTF) recognize the ever increasing pressure to change ammonia policy in the United States and to regulate sources of ammonia emissions under various environmental statutes including the Clean Air Act (CAA). Ammonia is not your ordinary air pollutant and will be difficult to regulate appropriately under the current construct of the CAA. Therefore, members of the AAQTF developed and approved a paper outlining information that regulators should consider before regulating ammonia emissions entitled, “Ammonia Emissions: What to Know Before You Regulate.”
What did we do?
Consideration of NH3 as an air pollutant will require the EPA to acknowledge and address the role of NH3 in the full nitrogen (N) cycle and specifically address emission reduction measures that do not merely transfer NH3 from one environmental medium to another. It will be difficult to regulate only the “excess” portion of reactive N, particularly since “excess” cannot be defined as a constant. Regulation of NH3 emissions under the CAA will make it extremely difficult for EPA to consider the positive value and need for fertilizer NH3, which could have huge implications for the viability of the domestic and global food supply.
To date, pollutants regulated under the CAA are considered “bad” for public health and for the environment; and the statute is designed to limit the impacts of these pollutants by reducing or eliminating their emissions. As EPA moves to regulate greenhouse gases, it is encountering difficulty in applying the existing statute in its consideration of carbon dioxide as a pollutant, which is a necessary component of the life cycle of plants and animals. Regulation of NH3 emissions within the constraints of the existing CAA will prove no less daunting and may lead to costly and illogical outcomes with little actual benefit to the environment or human health.
Prior to regulating ammonia emissions, EPA regulators must fully understand ammonia’s role in agriculture. Not only must there be an understanding of the nitrogen cycle from a chemical perspective, but there must be a full understanding from a biological perspective as well. These biological processes cannot be easily predicted or controlled and are based on many factors such as geographic region, cropping system, management practices, soil characteristics, climate and field variability. In animal production systems, there must be an understanding of diets and nitrogen use efficiency of the various species and the impacts of the housing systems, manure characteristics and management, and climate variables.
The EPA regulators must also not only understand the fate, transport, and transformation of atmospheric ammonia but must be able to quantify these processes. Any regulation of agricultural sources of ammonia should be informed by knowledge of management practices that will reduce emissions without negatively impacting animal and plant health and production levels. Ammonia reduction strategies must be considered across the entire production spectrum and not on individual aspects of production.
Underlying any regulation must be accurate measurement of the emissions and the ability to measure compliance, i.e., reductions and impacts. However, ammonia emissions are fugitive, vary spatially and temporally, and are readily influenced by many factors (e.g., source, climate, management practices, etc.) making it difficult to determine at a farm level, a precise emission factor. There are currently no easy and economical ways to directly monitor emissions from commercial livestock and cropping farms, which will make emissions estimation and enforcement challenging. Proceeding to regulation without proven methodologies for measurement of agricultural sources of ammonia and the ability to demonstrate scientifically the effectiveness of reduction practices, does not seem appropriate.
Nitrogen is essential to both crop and animal production, and when not supplied in sufficient amounts, will decrease both crop yield and animal productivity, risk declining soil system health and sustainability, and generate a loss for producers and perhaps even increase the overall environmental footprint of agricultural activities. Certain management or mitigation practices may be too costly for many producers given the current market value of agricultural commodities, so any regulation must considered how these costs will be covered.
What have we learned?
A collaborative dialogue with the agricultural community needs to occur prior to considering regulation. Current approaches of voluntary and incentive-based efforts are accomplishing significant improvements in soil health and reducing erosion and loss of nutrients, and agencies should recognize these improvements.
EPA can assist constructive dialog by avoiding regulatory silos and embracing holistic approaches in development of policies as it focuses on the agricultural sector; avoiding “One size fits all” style requirements; and avoiding multiple regulations on the same practice.
Farmers of the U.S. and the world must meet the food, fiber, and fuel needs of the predicted nine billion people by 2050. Therefore, any regulation of ammonia under the Clean Air Act must address its impact on the sustainability of domestic and global food supply as part of the mandatory statutory requirement to evaluate public health and welfare effects and the vitality of rural communities.
Future Plans
The AAQTF will continue to address these issues and attempt to facilitate future dialogue with EPA and USDA on these issues.
Authors
Sally Shaver, President, Shaver Consulting, Inc. slshaver50@aol.com
Dr. April Leytem, USDA-ARS, NW Irrigation and Soils Lab, Kimberly, ID
Dr. Robert Burns, Assistant Dean for Agriculture, Natural Resources and Community Economic Development, University of Tennessee Extension, Knoxville
Dr. Hongwei Xin, Director of Egg Industry Center, Departments of Agricultural and Biosystems Engineering and Animal Sciences, Iowa State University
Dr. Lingjuan Wang-Li, Associate Professor, Department of Biological and Agricultural Engineering, North Carolina State University
Lara Moody, Director of Stewardship Program, The Fertilizer Institute
Dr. Nicole Embertson, Resource Coordinator – Sustainable Livestock Production Program, Whatcom Conservation District, Lynden, WA
Dr. Eileen Fabian-Wheeler, Professor, Agricultural and Biological Engineering, Penn State University.
Additional information
The paper, Ammonia Emissions: What to Know Before You Regulate, is located on the USDA website
Acknowledgements
The contributions of members of the AAQTF to the discussions of these issues and to the development of the paper are recognized and greatly appreciated.
The authors are solely responsible for the content of these proceedings. The technical information does not necessarily reflect the official position of the sponsoring agencies or institutions represented by planning committee members, and inclusion and distribution herein does not constitute an endorsement of views expressed by the same. Printed materials included herein are not refereed publications. Citations should appear as follows. EXAMPLE: Authors. 2015. Title of presentation. Waste to Worth: Spreading Science and Solutions. Seattle, WA. March 31-April 3, 2015. URL of this page. Accessed on: today’s date.
 What did we do?
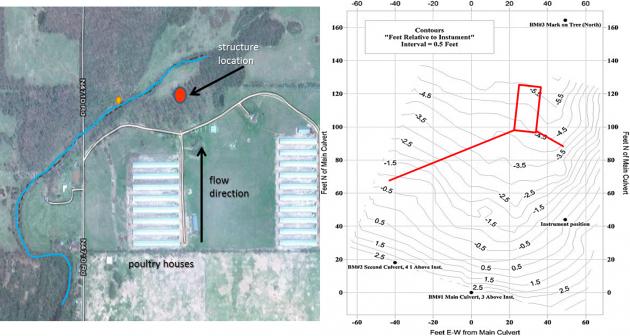 gpm flow rate. Several hypothetical designs were made based on the available P sorbing materials (PSMs), such as drinking water treatment residuals, acid mine residuals, and gypsum. We chose to use a treated steel slag material as the PSM in the structure; this required about 35 tons of material.
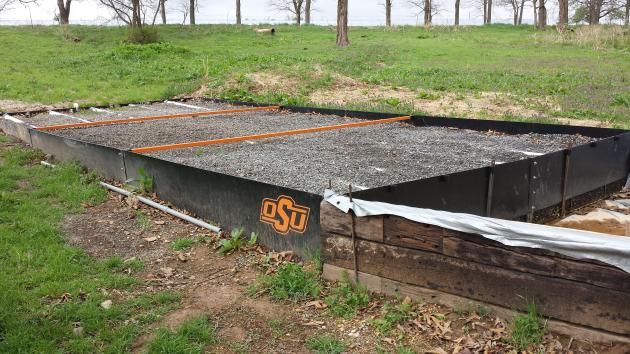 We constructed a P removal structure on a poultry farm in Eastern OK; this is a BMP that can remove dissolved P loading in the short term until soil legacy P concentrations decrease below levels of environmental concern. A P removal structure contains P sorbing materials (PSMs) and are placed in a location to intercept runoff or subsurface drainage with high dissolved P concentrations. As high P water flows through the PSMs, dissolved P is sorbed onto the materials by several potential mechanisms, allowing low P water to exit the structure. While they vary in form, P removal structures contain three main elements: 1) use of a filter material that has a high affinity for P, 2) containment of the material, and 3) the ability to remove that material and replace it after it becomes saturated with P and is no longer effective.
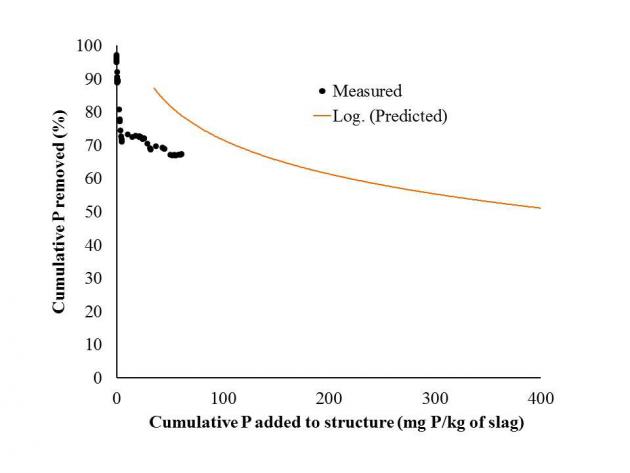 The P removal structure has removed approximately 67% of all dissolved P that has flowed into it over a 16-month time period. In addition, it has handled all flow volume from every event, including a runoff event that resulted in 600 gpm. That single event delivered 2/3 lb of dissolved P, in which the structure removed 66%. While the structure is removing P as predicted based on P loading, the structure has greatly outlasted the goal of removing 45% of cumulative dissolved P in one year. This is due to the below average rainfall received over the last two years.
 We will continue to monitor the structure. In addition, we are cooperating with several people throughout the US in helping to design P removal structures. We are also releasing design software for licensing in an attempt to promote commercialization of this BMP through private industry. A NRCS standard is currently underway and the goal is for this BMP to become cost-shared. Last, we are continuing to investigate the economics of P removal structure over a large scale area.
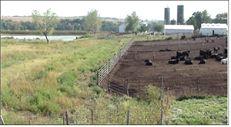 A buffer down-slope of the pen area is essential to managing water quality. The buffer area should be on permeable soils and covered with dense grass. The buffer size should be more than equal to the footprint of the pen, and it is preferred that it be twice the area of the pen. Size of the buffer is influenced by the soils, The more permeable the soil, the greater the infiltration rate, reducing the need for increased size of the buffer area.