
This webinar focuses on nitrogen and phosphorus inventories at two watershed scales, and how manure nutrients are incorporated. This presentation was originally broadcast on September 20, 2019. More… Continue reading “Watershed Nutrient Inventories – Opportunities and Needs”
California’s Efforts to Reduce Greenhouse Gases from Dairy and Livestock Operations
This webinar discusses two programs in California, administered through the California Department of Food and Agriculture (CDFA), that provide financial incentives to dairy and livestock producers to reduce methane emissions from on-farm manure management. This presentation was originally broadcast on August 16, 2019. More… Continue reading “California’s Efforts to Reduce Greenhouse Gases from Dairy and Livestock Operations”
Impacts of New Phosphorous Regulations on Composting of Animal Manures
The Problem
Concerns are mounting in states that have sensitive waterways about the release of P from manure and compost into ground and surface water. P is the limiting nutrient for many freshwater ecosystems and as such regulate the rate of eutrophication and oxygen depletion. The concerns have led to new regulations that limit the application of manure and in some cases compost products that have high concentrations of P. Also, compost use in stormwater biofiltration swales has been called into question because of the potential leaching of P. There are concerns in the composting industry that the regulations will limit the application of compost and reduce the market for compost products.
Composting can theoretically increase the biological activity of the soil matrix and help the formation of aggregates that absorb nutrients. Compost also contains metals such as iron, magnesium, calcium and aluminum that help bind P to the soil particles. Composting has a substantial impact on N as the high temperatures result in losses of ammonia. Depending on the stage of composting, the bacterial thermophilic phase of composting can release P during the breakdown of plant and animal tissue. In contrast the curing or fungal phase can bind nutrients into the hyphae and to the stabilized organic substrate. Additionally, soils high in organic C have lower bulk densities and prevent runoff because of the increased water holding capacity and infiltration rates*. The concept is that even though the overall P levels in the soils are increasing with compost application, only a small portion of the P is in the liquid phase and there is sufficient soil and plant uptake to limit P losses.
*Spargo, J.T., G.K. Evanylo, and M.M. Alley. 2006. Repeated compost application effects on phosphorus runoff in the Virginia Piedmont. J. Environ. Qual. 35:2342–2351.
What did we do?
In 2014, Green Mountain Technologies (GMT) received an Animal Waste

Technology Fund (AWTF) grant from the Maryland Department of Agriculture to install an Earth Flow composting systems at Days End Farm (DEF, Fig. 1) in Howard County and Glamor View Farms in Frederick County. There were two types of manures that were tested, dry pack manure from Glamour View Farms and bedded horse manure from Days End Farm.
Days End Farm Horse Rescue is a non-profit, volunteer-based animal welfare organization established in 1989 to provide care and treatment for horses that have been abused or mistreated. DEF works to rehabilitate horses, find good homes for them and educate the public about humane treatment of horses. DEF cares for between 100-150 horses annually, rehabilitating them and preparing them for adoption.

Glamour View Farm (GVF, Fig. 2) is a 146-acre dairy operation which is a part of Lager Farms. Glamour View houses approximately 180 Holstein and Jersey cows. In 2014, Green Mountain Technologies (GMT) and GVF received an AWTF grant from the Maryland Department of Agriculture to install an Earth Flow composting system at GVF in Frederick County, Maryland.
Description of the Earth Flow Composting System
The Earth Flow (Fig. 3 & 4) is an in-vessel composting system that integrates an automated mixing system, aeration system and moisture addition system into the vessel. The Earth Flow system accelerates the composting process by providing optimum conditions for aerobic composting. The combination of these features facilitates a thermophilic composting process for horse manure and bedding in 10-14 days.


The Earth Flow has an integrated mixing system (Fig. 5) that allows the compost to be mixed on a daily basis (2-4 times per day). The traveling auger is the key to the effectiveness of the Earth Flow. It provides seven different functions that facilitate the hot composting process:
- Shreds. The auger breaks up manure balls to reduce particle size and expose nutrients to the microbes.
- Mixes. The auger mixes material by smearing manure onto bedding.
- Aerates. The auger continually fluffs the compost to add oxygen to the compost matrix.
- Distributes Moisture. The auger sweeps up wet material from the lower portions of the compost pile and elevates it to the surface.
- Homogenizes. The auger homogenizes manure with bedding for an even distribution of nutrients.

- Transports. The auger slowly increments compost from the load end to the discharge end.
- Stacks. As compost reduces in volume, the auger continually stacks the material toward the back to maximize utilization of the space.
The Earth Flow is designed such that feedstocks are loaded on one end of the vessel and finished product is discharged from the opposite end of the vessel.
The Earth Flow at Days End Farm is operated as a continuous-flow system. In a continuous-flow system, feedstocks can be loaded at any time on the load end and the traveling auger slowly migrates compost to the discharge end. Material can be discharged once the vessel is full and/or the user is ready to discharge compost. The standard mixing pattern of the auger is shown below.
The basis of the study was to evaluate whether composting manure would reduce the amount of P, especially the water extractable P compared to raw manure. The theoretical basis for this reduction is that composting would add more carbon and also tie up P in the increased biomass making it less available to run off. While N can be lost to the atmosphere as ammonia or converted to elemental nitrogen gas, P is only transportable in liquid phase and can neither be created or destroyed by the normal biological processes. P is essentially recycled through biomass and decaying plant and animal tissues release P that is the reabsorbed by new living tissue.
Samples of raw manure were collected prior to composting and the same manure was sampled 3-4 weeks later to determine the changes in nutrient levels and water extractable P. Samples were taken every quarter for a one year period to assess any seasonal changes. One of the proposed applications for the compost product was bedding reuse so some of the focus of the study related to product quality as a recycled bedding material.
What we learned
Bedded Horse Manure
The average total Nitrogen (N) of 0.68% comprised 0.03% Ammonia-N of the loaded mixture (over the study period) with 52% moisture and 48% solids, with a total carbon content of about 40%, resulting in a C:N ratio of 29. Total P in the loaded mixture was 0.17% of which 0.40% was P2O5. For the compost produced during this period, the total N averaged 0.6% (5980 mg/kg) of which 0.06% was ammonia (577 mg/kg) and 0.54% was organic N (5436 mg/kg) and 470 mg/kg nitrate-nitrite N. The total carbon was 44.87% (44867 mg/kg), resulting in a C:N ratio of 214, with an average moisture content of 20% (Tables 3 and 4).
The average N:P ratio for the unloaded compost is 1.5 (5980:4140). Minerals analyzed from the manure and unloaded compost showed variability between samples collected on the different dates, but all measured concentrations of calcium, magnesium, sodium, iron, aluminum, manganese, copper, and zinc were within acceptable ranges. The nearly 30% decrease in moisture content over the composting period was measured, this is of interest as the compost process is optimal at 50% moisture content with a workable range from 40-60%. When moisture reaches 35% or less the material is suitable for screening when producing a product for landscape or horticultural uses. In addition, microbial decomposition (metabolic) activity decreases substantially resulting in insufficient metabolically generated heat within the compost mass. The TKN and C:N data indicate a substantial reduction in N during the compost process. We inquired with Waypoint about data reporting errors as the N values seemed surprisingly low. They had already disposed of the samples so they were not able to rerun the test. They did offer to retest and we may have them run the data points again. If the N data is correct, then a substantial amount of N would have been lost to the air as ammonia. In contrast, two of the three P values were higher in the compost than in the raw manure. There may be several explanations for this trend. One point of interest as the bedding reuse continues is the accumulation of P in the compost product.
Dairy Dry Pack Manure
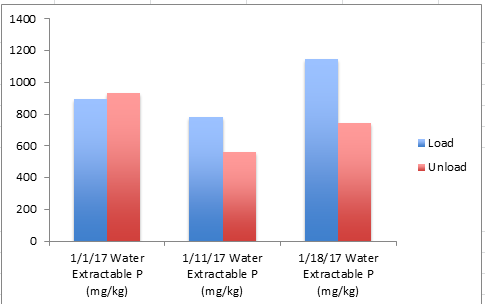
Penn State Labs performed the lab analysis of the raw manure and compost samples on 8/7/17. The lab samples were stored at Michael Calkin’s refrigerator and shipped to Penn State. Two samples were taken at the load and unload ends of the vessel each week and combined into a single grab sample. Ammonia and Organic N were analyzed as well as P, extractable P and carbon. Because Glamor View is operated as a batch system, the initial sample on 5/28/17 represents the raw manure at both the load and unload ends of the vessel. Each subsequent lab analysis shows the weekly change in N or P as the manure turns into compost as shown below (Fig. 6 – 8).


Winter 2017
The nutrient levels showed no clear trend of diminishment during the 3 weeks of monitoring as shown in Table 1. The average N actually increased which seems highly unlikely given ammonia losses typically experienced during composting. The good news is that it has reasonable fertilizer value when compared to typical composts. The average P2O5 levels were unchanged during the 3-week sampling also. The water extractable P showed a slight downward trend but once again the data was scattered. The only conclusion we can make from the data is that more P was liberated during the thermophilic phase of composting than was bound up by bacterial bodies. In retrospect, additional water extractable samples should have been performed on the cured compost to see how much water extractable P is in the product immediately before the compost is applied to fields or gardens.
| Table 1. Lab Analysis of Bedded Horse Manure Before and After Three Weeks of Composting | |||||
|---|---|---|---|---|---|
| Average results for Compost Feedstock Loaded into the Earth Flow unit at
Days End Farm in December 2015 |
Average results for Compost Unloaded from Earth Flow unit at
Days End Farm in December 2015 |
||||
| TEST | Dec 2015 Summary (%) | Average result-Dec 2015 (mg/Kg) | TESTα | Dec 2015 Summary (%) | Average result-Dec 2015 (mg/Kg) |
| As Received | Dry basis | ||||
| Nitrogen, N % | 0.39 | 0.95 | |||
| Ammonical-N % | 0.07 | 0.16 | Total Kjeldahl Nitrogen | 1.12 | 11200.00 |
| Phosphorus, P % | 0.10 | 0.23 | Total Phosphorus | 0.33 | 3346.67 |
| Potassium, K % | 0.36 | 0.87 | Total Potassium | 1.10 | 11033.33 |
| Sulfur, S % | 0.06 | 0.14 | Total Sulfur | 0.19 | 1923.33* |
| Magnesium, Mg % | 0.13 | 0.32 | Total Magnesium | 0.38 | 3760.00* |
| Calcium, Ca % | 1.76 | 4.53 | Total Calcium | 2.35 | 23466.67* |
| Sodium, Na ppm | 602.00 | 1480.00 | Total Sodium | 0.18 | 1773.33* |
| Iron, Fe ppm | 889.00 | 2173.33 | Total Iron | 4310.00* | |
| Aluminum, Al ppm | 368.33 | 873.00 | Total Aluminum | 3500.00* | |
| Manganese, Mn ppm | 93.07 | 230.00 | Total Manganese | 278.67* | |
| Copper, Cu ppm | 8.05 | 19.77 | Total Copper | 26.33* | |
| Zinc, Zn ppm | 33.60 | 82.93 | Total Zinc | 91.33* | |
| Boron, B ppm | 2.50 | 6.12 | Total Volatile Solids | 78.14 | 781400.00 |
| Test | Result | Result | |||
| Moisture % | 59.5 | Moisture † | 31.46 | Moisture † | |
| Solid % | 40.5 | Total Solids † | 68.54 | 685366.67 | |
| Additional Tests | Result | ||||
| P2O5 (as received) , % | 16.41 | C/N RATIO † | 40.67 | ||
| K2O (as received) , % | 0.428 | Carbon (TOC) † | 45.43 | 454333.33 | |
| αAll values are on a dry weight basis, except as noted by†; Detection limit on all N series is on a wet basis.
*Within normal range, Analyses by Waypoint Laboratories, Richmond, VA |
|||||


Spring 2017
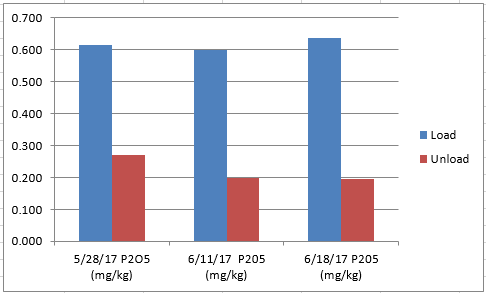
Unlike the last sampling event over the winter, the nutrient levels showed a clear trend of diminishment during the 3 weeks of monitoring as shown in Fig. 9-11. The average N reduced by 30% or more during the three weeks of composting. The average P2O5 levels showed a downward trend on the unload and unchanged on the load end which is expected given that P is not lost in the compost process. The water extractable P had a clear downward trend for both the load and unload ends of the vessel with an average 42% reduction over the 3 weeks. Water extractable P is more important than a reduction in the P2O5 levels as it indicates the amount of P available for leaching. In general, the lab data supported the trends that are typical of composting. It is not clear if the change over the winter results were seasonal or if the sampling methods were inconsistent. One possibility is the change in feed type that the heifers receive in the summer vs winter. In retrospect, additional water extractable samples should have been performed on the cured compost to see how much water extractable P is in the product immediately before the compost is applied to fields or gardens. This sampling would have provided a more complete picture of the entire compost process for nutrient management.
Next Steps
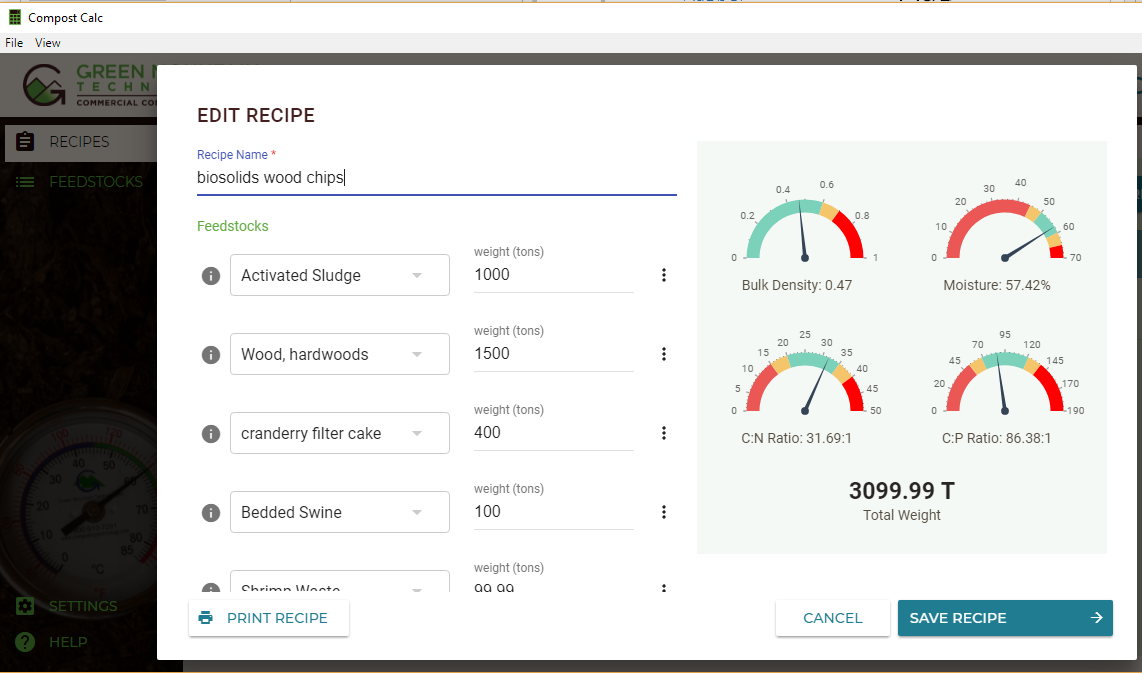
There is no doubt that P chemistry and bioavailability are complicated subjects. Based on this work and studies done by Larry Sikora at USDA and John Spargo there needs to be a more comprehensive study performed with greater control of variables to demonstrate what might actually happen in the field with P availability and losses in compost. The other effort GMT is involved in is the development of a compost feedstock recipe calculator that includes values for different feedstock P concentrations and also performs C/P ratio calculations (Fig. 12). The calculator has an interactive dial format that immediately shows the user how the volumes of different feedstocks changes not only C/N but C/P ratios as shown below. The hope is that the software will raise awareness about P and help to make compost products with balanced nutrient ratios.
Authors
Michael Bryan-Brown, Green Mountain Technologies, mbb@compostingtechnology.com
The authors are solely responsible for the content of these proceedings. The technical information does not necessarily reflect the official position of the sponsoring agencies or institutions represented by planning committee members, and inclusion and distribution herein does not constitute an endorsement of views expressed by the same. Printed materials included herein are not refereed publications. Citations should appear as follows. EXAMPLE: Authors. 2019. Title of presentation. Waste to Worth. Minneapolis, MN. April 22-26, 2019. URL of this page. Accessed on: today’s date.
Field Technology & Water Quality Outreach
Proceedings Home | W2W Home 
Purpose
In 2015, Washington State Department of Agriculture (WSDA) partnered with local and state agencies to help identify potential sources of fecal coliform bacteria that were impacting shellfish beds in northwest Washington. WSDA and Pollution Identification and Correction (PIC) program partners began collecting ambient, as well as rain-driven, source identification water samples. Large watersheds with multiple sub-basins, changing weather and field conditions, and recent nutrient applications, meant new sites were added almost daily. The increased sampling created an avalanche of new data. With this data, we needed to figure out how to share it in a way that was timely, clear and could motivate change. 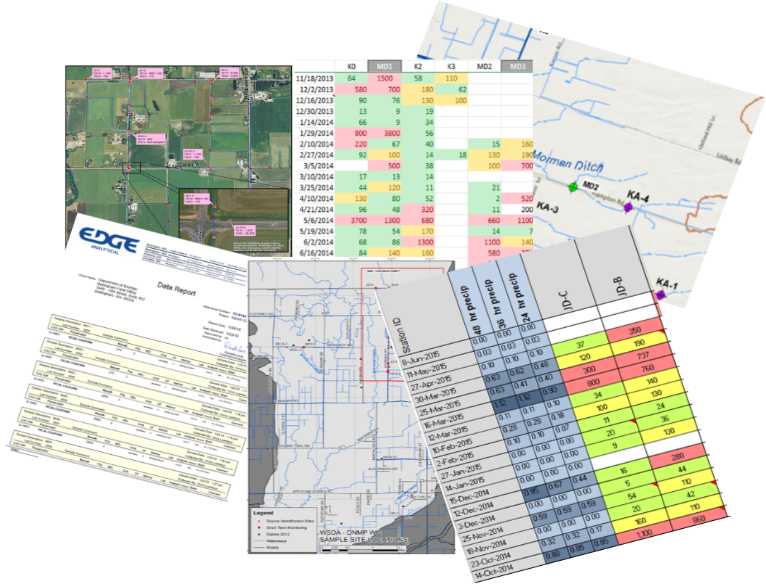
Conveying complex water quality results to a broad audience can be challenging. Previously, water quality data would be shared with the public and partners through spreadsheets or graphs via email, meetings or quarterly updates. However, the data that was being shared was often too late or too overwhelming to link locations, weather or field conditions to water quality. Even though plenty of data was available, it was difficult for it to have meaningful context to the general public.
Ease of access to results can help inform landowners of hot spots near their home, it can link recent weather and their own land management practices with water quality, as well as inform and influence decision-making.
What Did We Do?
Using basic GIS tools we created an interactive map, to share recent water quality results. The map is available on smartphones, tablets and personal computers, displaying near-real-time results from multiple agencies. Viewers can access the map 24 hours a day, 7 days a week.
We have noticed incre ased engagement from our dairy producers, with many checking the results map regularly for updates. The map is symbolized with graduated stop light symbology, with poor water quality shown in red and good in green. If they see a red dot or “hot spot” in their neighborhood they may stop us on the street, send an email, or call with ideas or observations of what they believe may have influenced water quality. It has opened the door to conversations and partnerships in identifying and correcting possible influences from their farm.
The map also contains historic results data for each site, which can show changes in water quality. It allows the viewer to evaluate if the results are the norm or an anomaly. “Are high results after a rainfall event or when my animals are on that pasture?”
The online map has also increased engagement with our Canadian neighbors to the north. By collecting samples at the US/Canadian border we have been able to map streams where elevated bacteria levels come across the border. This has created an opportunity to partner with our Canadian counterparts to continue to identify and correct sources.
What Have We Learned?
You do not need to be a GIS professional to create an app like this for your organization. Learning the system and fine-tuning the web application can take some time, but it is well worth the investment. GIS skills derived from this project have proven invaluable as the app transfers to other areas of non-point work. The web application has created great efficiencies in collaboration, allowing field staff to quickly evaluate water quality trends in order to spend their time where it is most needed. The application has also provided transparency to the public regarding our field work, demonstrating why we are sampling particular areas.
From producer surveys, we have learned that viewers prefer a one-stop portal for information. Viewers are less concerned about what agency collected the data as they are interested in what the data says. This includes recent, as well as historical water quality data, field observations; such as wildlife or livestock presence or other potential sources. Also, a brief weekly overview of conditions, observations and/or trends has been requested to provide additional context.
Future Plans
The ease and efficiency of the mobile mapping and data sharing has opened the door to other collaborative projects. Currently we are developing a “Nutrient Tracker” application that allows all PIC partners to easily update a map from the field. The map allows the user to log recent field applications of manure. Using polygons to draw the area on the field, staff can note the date nutrients were identified, type of application, proximity to surface water, if it was a low-, medium- or high-risk application, if follow-up is warranted, and what agency would be the lead contact. This is a helpful tool in learning how producers utilize nutrients, to refer properties of concern to the appropriate agency, and to evaluate recent water quality results against known applications.
Developing another outreach tool, WSDA is collecting 5 years of fall soil nitrate tests from all dairy fields in Washington State. The goal is to create a visual representation of soil data, to demonstrate to producers how nitrate levels on fields have changed from year to year, and to easily identify areas that need to be re-evaluated when making nutrient application decisions.
As part of a collaborative Pollution Identification and Correction (PIC) group, we would like to create a “Story Map” that details the current situation, why it is a concern, explain potential sources and what steps can be taken at an individual level to make a difference. A map that visually demonstrates where the watersheds are and how local neighborhoods really do connect to people 7 miles downstream. An interactive map that not only shows sampling locations, but allows the viewer to drill down deeper for more information about the focus areas, such as pop-ups that explain what fecal coliform bacteria are and what factors can increase bacteria levels. We envision a multi-layer map that includes 24-hour rainfall, river rise, and shellfish bed closures. This interactive map will also share success stories as well as on-going efforts.
Author
Kerri Love, Dairy Nutrient Inspector, Dairy Nutrient Management Program, Washington State Department of Agriculture
Additional Information
Results Map Link: http://arcg.is/1Q9tF48
Washington Shellfish Initiative: http://www.governor.wa.gov/issues/issues/energy-environment/shellfish
Mobile Mapping Technology presentation by Michael Isensee, 2016 National CAFO Roundtable
Sharing the Data: Interactive Maps Provide Rapid Feedback on Recent Water Quality and Incite Change by Educating the Public, Kyrre Flege, Washington State Department of Agriculture and Jessica Kirkpatrick, Washington State Department of Ecology, 2016 National Non-Point Source Monitoring Workshop
Whatcom County PIC Program: http://www.whatcomcounty.us/1072/Water-Quality
Skagit County, Clean Samish Initiative: https://www.skagitcounty.net/Departments/PublicWorksCleanWater/cleansamish.htm
Lower Stillguamish PIC Program: http://snohomishcountywa.gov/3344/Lower-Stilly-PIC-Program
GIS Web Applications: http://doc.arcgis.com/en/web-appbuilder/
Acknowledgements
The web application was a collaborative project developed by Kyrre Flege, Washington State Department of Agriculture and Jessica Kirkpatrick, Washington State Department of Ecology.
The authors are solely responsible for the content of these proceedings. The technical information does not necessarily reflect the official position of the sponsoring agencies or institutions represented by planning committee members, and inclusion and distribution herein does not constitute an endorsement of views expressed by the same. Printed materials included herein are not refereed publications. Citations should appear as follows. EXAMPLE: Authors. 2017. Title of presentation. Waste to Worth: Spreading Science and Solutions. Cary, NC. April 18-21, 2017. URL of this page. Accessed on: today’s date.
Comprehensive Physiochemical Characterization of Poultry Litter: A First Step Towards Manure Management Plans in Argentina
Proceedings Home | W2W Home
Purpose
For the last decade, Argentinian CAFO’s have been increasing in number and size. Poultry farming showed remarkable growth and brought to light the absence of litter and nutrient management plans. Land application of poultry litter is the most common practice, but there is insufficient data to support recommended agronomic rates of application.
In this study, we developed the first comprehensive physiochemical characterization of poultry litter to accurately state average nutrient concentrations and data variability to support development of future litter best management practices. Simultaneously, we estimated the crop fertilization potential of poultry litter in Entre Rios Province.
What did we do?
Entre Rios Province contributes 51% of total Argentinian broiler production, holding over 2,600 chicken farms. Thus, the Ministry of Agriculture Industry contacted integrated broiler farmers, which all seemed to share a modern production protocol related to housing conditions, feed ration, and bedding management, and who were willing to participate in the sampling project. A sampling protocol was written following recognized literature sources (Zhang and Hamilton) and hands-on training sessions were developed with producers in charge of poultry litter sampling. A total of 55 broiler farms were sampled with 3 replicates per farm.
The following parameters were selected for analysis: organic matter, total nitrogen, ammoniacal nitrogen, organic nitrogen, phosphorus, potassium, calcium, magnesium, sodium, zinc, copper, electrical conductivity, pH and moisture content. Analytical procedures were stated with a certified local lab following recommended methods for manure analysis. A survey was also conducted at each sampling farm to assess variability on bedding age and material.
What have we learned?
The average stocking density was 11.3 chickens/m2. The number of flocks grown on the litter before house cleaning ranged from 1 to 11 with an average of 4.7. However, 47.3% of the farms’ litter had less than 5 flocks while 52.7% presented 5 or more flocks. There was no significant correlation between the physiochemical parameters measured and bird density, nor with the number of flocks raised on the litter.
Table 1. Litter Type
| Litter Type | Farms (%) |
|---|---|
| Woodchips | 50.91 |
| Rice hulls | 23.64 |
| Woodchips + rice hulls | 21.82 |
| Peanut hulls | 3.63 |
While total nitrogen (TN) and phosphorus means were comparable to normal values reported in U.S. literature (Britton and Bullard; Zhang et al.), the variability of data was significant. Table 2 shows a summary of the most relevant analytical results obtained.
Table 2. Physical and Chemical Average Litter Composition (Dry Basis). SEM*: Standard Error of the Mean
| Mean | SEM* | St. Deviation | C.V. (%) | |
|---|---|---|---|---|
| Organic matter (%) | 79.13 | 0.62 | 4.61 | 5.82 |
| Total nitrogen (%) | 2.96 | 0.05 | 0.38 | 12.86 |
| Phosphorus (%) | 0.97 | 0.04 | 0.30 | 30.83 |
| Sodium (%) | 0.41 | 0.02 | 0.16 | 39.42 |
| Electrical conductivity (mmhos/cm) | 8.63 | 0.49 | 3.66 | 42.48 |
| pH (I.U.) | 7.56 | 0.04 | 0.31 | 4.07 |
| Moisture content (%) | 31.50 | 0.63 | 4.65 | 14.78 |
The coefficients of variation were especially high for phosphorus, sodium and electrical conductivity. This could be a critical factor governing poultry litter land application rates that promote neither phosphorus loss via surface runoff nor buildup of salts or sodium in the soil profile.
Raising over 359 million chickens annually, broiler litter value in Entre Rios Province would surpass 51 million dollars if it were fully used as commercial fertilizer substitute. Based upon the average nutrient content, 51,100 tons of nitrogen, 17,100 tons of phosphorus and 23,600 tons of potassium would be available; enough to fertilize 349,000 hectares of corn based upon crop nitrogen requirements whilst a plan based upon phosphorus would supply 629,000 hectares. Other critical factors like storage duration of litter outdoors, land application method, and the availability of litter nitrogen will impact the final calculation of plant available nitrogen (PAN), which is generally assumed to be 50% of TN when surface applied (Chastain et al.). Entre Rios farmers sow around 245,000 hectares of corn annually, hence 71% of the planted area could potentially be fully nitrogen fertilized using broiler litter instead of commercial fertilizer.
These results showed that while there is strong potential for litter land application at agronomic rates in Entre Rios, individual litter samples properly taken and analyzed are still needed to sustain environmentally sound nutrient management plans due to the large variability of the analytical results.
Future Plans
The information presented will be utilized as input data for developing draft Broiler Farms’ Nutrient Management Plans that will serve as a model for other Argentinian CAFO. Currently, laboratory results from Buenos Aires Province hen farms are being analyzed.
Corresponding author, title, and affiliation
Roberto Maisonnave, President at AmbientAgro – International Environmental Consulting
Corresponding author email
Other authors
Karina Lamelas, Director of Poultry and Swine Production at Ministry of Agriculture (Argentina). Gisela Mair, Ministry of Agriculture (Argentina). Norberto Rodriguez, Ministry of Agricultrue and University of Tres de Febrero (Argentina).
Additional information
Britton, J. and G. Bullard. 1998 Summary of Poultry Litter Samples in Oklahoma. Oklahoma Cooperative Extension Service. CR-8214.
J. Chastain, J. Camberato and P. Skewes. Poultry manure production and nutrient content. Poultry Training Manual. Clemson University. http://www.clemson.edu/extension/camm/manuals/poultry_toc.html
Maisonnave, R.; Lamelas, K. y G. Mair. Buenas prácticas de manejo y utilización de cama de pollo y guano. Ministerio de Agroindustria de la Nación Argentina. 2016.
Zhang, H. and D. Hamilton. Sampling animal manure. Oklahoma Cooperative Extension Service. PSS-2248.
Zhang, H.; Hamilton, D. and J. Payne. Using Poultry Litter as Fertilizer. Oklahoma Cooperative Extension Service. PSS-2246.
Acknowledgements
Dr. Jorge Dillon and Ing. José Noriega (SENASA)
Ing. Agr. Juan Martin Gange and Lic. Corina Bernigaud (INTA)
Ing. Agr. Alan Nielsen and M. Vet. Juan Nehuén Rossi (Granja Tres Arroyos)
Lic. Pablo Marsó (Las Camelias)
Sra. Nancy Dotto (Soychú)
An Economical Method to Install Industrial Wastewater Storage Pond Liners
Proceedings Home | W2W Home
Purpose
Over the past four decades, the number of custom slaughterhouses in Michigan has steadily decreased as the number of livestock producers declined. Those who remain are growing larger as they capitalize on the buy local food craze by providing fresh USDA-approved boxed meats at a meat counter or by adding value to the meats by further processing (i.e., sausages, hams, etc.). All slaughterhouses in the State are regulated by the Michigan Department of Environmental Quality (MDEQ) who issues permits for the proper disposal of the process wastewater for those operations that are not connected to a municipal sewer.
Typical disposal of the process wastewater involves removal of the solids through septic tank filtration and screens followed by storage of the process wastewater in ponds for eventual disposal on crop ground at agronomic rates. Facilities operating in this manner are issued a Groundwater Discharge Permit from MDEQ. However, because the state classifies slaughterhouses as an industry, the storage ponds require double liners and must meet a hydraulic conductivity of 1 x 10⁻⁷ centimeters/second.
A process wastewater storage pond is being designed for a slaughterhouse located in Coopersville, Michigan. The existing process wastewater holding pond is not sufficient to hold process water generated at the facility due to the recent expansions in slaughterhouse operations. Therefore, modifications to the existing holding pond and construction of a new holding pond to accommodate the process water generated is underway. The construction of the ponds is scheduled for spring 2017.
This paper evaluates the applicability, economic feasibility compared to geomembrane liners and constructability of pond liners using AquaBlok.
AquaBlok is a man-made clay pellet material that handles like gravel and is placed in varying thicknesses depending on the desired hydraulic conductivity and then hydrated to create a low permeable liner. Advertised as a “composite particle system” each AquaBlok particle contains an individual piece of limestone as its core. When a continuous layer of individual particles is applied, the clay (i.e., a high-quality sodium bentonite coating) surrounding each stone hydrates, swells, and binds together to produce a low-permeable earthen liner when introduced to a water environment.
What did we do?
Based on the current operations and future growth forecast, the slaughterhouse requires a pond(s) with total holding capacity of approximately 1.6 million gallons of process wastewater. This accounts for process wastewater generated in total of eight (8) months period. Soil borings were taken at the site and soil samples were collected to determine geotechnical parameters including hydraulic conductivity. Total of eight (8) soil borings were advanced to an approximate depth of fifty (50) feet below ground surface. Based on the laboratory testing results, the hydraulic conductivity of the native clay did not meet the MDEQ’s minimum 1 x 10⁻⁷ cm/s requirement. These results indicate a need for a composite liner for the existing pond as well as the new pond. Two candidate liner materials are being evaluated. They are 1) clay liner that is constructed of AquaBlok and 2) geomembrane liner. Geomembrane are commonly being used for wastewater! holding ponds. AquaBlok is not being frequently used as liners for holding ponds. However, once constructed appropriately, this material would provide a liner with hydraulic conductivity of less than 1 x 10⁻⁸ cm/s and appropriate shear and compressive strength. Currently, the economic feasibility of the two methods is being evaluated. Also, the constructability of the AqaBlok liners is being investigated. The ponds are scheduled to be constructed in Spring 2017.
What have we learned?
The evaluation of AquaBlok as a liner material for process wastewater holding ponds is being evaluated. The construction of the ponds is scheduled for Spring 2017. This material has promising geotechnical parameters and can provide a liner with a very low permeability once constructed appropriately. A detailed discussion of the material evaluation, liner construction methodology, economic analysis, and regulatory compliance will be presented during the oral presentation.
Use of a geotextile liner is an approved method to construct industrial wastewater storage ponds in Michigan but cost and liner installer availability is typically a detriment to fast installations.
Future Plans
Due to a plant expansion, the design drawings and application to expand the process wastewater pond capacity and to meet the state requirements for minimum liner permeability are currently in review by the state MDEQ. Construction of the new storage pond is planned for spring 2017 pending MDEQ review and approval.
Corresponding author, title, and affiliation
Matthew J. Germane, PE, Senior Project Engineer at Environmental Resources Group, LLC
Corresponding author email
Other authors
Mala Hettiarachchi, Ph.D, PE, Senior Engineer at Environmental Resources Group, LLC
Additional information
Additional information on Michigan’s rules for liner construction of industrial wastewater is available at:
http://www.michigan.gov/documents/deq/wb-groundwater-P22GuidshtIV_248171_7.pdf
Acknowledgements
The authors wish to acknowledge DeVries Meats, Inc., in Coopersville, MI and their owner, Ken DeVries, whose site the design work and cost evaluations were completed for.
Poultry Mortality Freezer Units: Better BMP, Better Biosecurity, Better Bottom Line.
Proceedings Home | W2W Home
Purpose
Why Tackle Mortality Management? It’s Ripe for Revolution.
The poultry industry has enjoyed a long run of technological and scientific advancements that have led to improvements in quality and efficiency. To ensure its hard-won prosperity continues into the future, the industry has rightly shifted its focus to sustainability. For example, much money and effort has been expended on developing better management methods and alternative uses/destinations for poultry litter.
In contrast, little effort or money has been expended to improve routine mortality management – arguably one of the most critical aspects of every poultry operation. In many poultry producing areas of the country, mortality management methods have not changed in decades – not since the industry was forced to shift from the longstanding practice of pit burial. Often that shift was to composting (with mixed results at best). For several reasons – improved biosecurity being the most important/immediate – it’s time that the industry shift again.
The shift, however, doesn’t require reinventing the wheel, i.e., mortality management can be revolutionized without developing anything revolutionary. In fact, the mortality management practice of the future owes its existence in part to a technology that was patented exactly 20 years ago by Tyson Foods – large freezer containers designed for storing routine/daily mortality on each individual farm until the containers are later emptied and the material is hauled off the farm for disposal.
Despite having been around for two decades, the practice of using on-farm freezer units has received almost no attention. Little has been done to promote the practice or to study or improve on the original concept, which is a shame given the increasing focus on two of its biggest advantages – biosecurity and nutrient management.
Dusting off this old BMP for a closer look has been the focus of our work – and with promising results. The benefits of hitting the reset button on this practice couldn’t be more clear:
- Greatly improved biosecurity for the individual grower when compared to traditional composting;
- Improved biosecurity for the entire industry as more individual farms switch from composting to freezing, reducing the likelihood of wider outbreaks;
- Reduced operational costs for the individual poultry farm as compared to more labor-intensive practices, such as composting;
- Greatly reduced environmental impact as compared to other BMPs that require land application as a second step, including composting, bio-digestion and incineration; and
- Improved quality of life for the grower, the grower’s family and the grower’s neighbors when compared to other BMPs, such as composting and incineration.
What Did We Do?
We basically took a fresh look at all aspects of this “old” BMP, and shared our findings with various audiences.
That work included:
- Direct testing with our own equipment on our own poultry farm regarding
- Farm visitation by animals and other disease vectors,
- Freezer unit capacity,
- Power consumption, and
- Operational/maintenance aspects;
- Field trials on two pilot project farms over two years regarding
- Freezer unit capacity
- Quality of life issues for growers and neighbors,
- Farm visitation by animals and other disease vectors,
- Operational and collection/hauling aspects;
- Performing literature reviews and interviews regarding
- Farm visitation by animals and other disease vectors
- Pathogen/disease transmission,
- Biosecurity measures
- Nutrient management comparisons
- Quality of life issues for growers and neighbors
- Ensuring the results of the above topics/tests were communicated to
- Growers
- Integrators
- Legislators
- Environmental groups
- Funding agencies (state and federal)
- Veterinary agencies (state and federal)
What Have We Learned?
The breadth of the work at times limited the depth of any one topic’s exploration, but here is an overview of our findings:
- Direct testing with our own equipment on our own poultry farm regarding
- Farm visitation by animals and other disease vectors
- Farm visitation by scavenger animals, including buzzards/vultures, raccoons, foxes and feral cats, that previously dined in the composting shed daily slowly decreased and then stopped entirely about three weeks after the farm converted to freezer units.
- The fly population was dramatically reduced after the farm converted from composting to freezer units. [Reduction was estimated at 80%-90%.]
- Freezer unit capacity
- The test units were carefully filled on a daily basis to replicate the size and amount of deadstock generated over the course of a full farm’s grow-out cycle.
- The capacity tests were repeated over several flocks to ensure we had accurate numbers for creating a capacity calculator/matrix, which has since been adopted by the USDA’s Natural Resources Conservation Service to determine the correct number of units per farm based on flock size and finish bird weight (or number of grow-out days) in connection with the agency’s cost-share program.
- Power consumption
- Power consumption was recorded daily over several flocks and under several conditions, e.g., during all four seasons and under cover versus outside and unprotected from the elements.
- Energy costs were higher for uncovered units and obviously varied depending on the season, but the average cost to power one unit is only 90 cents a day. The total cost of power for the average farm (all four units) is only $92 per flock. (See additional information for supporting documentation and charts.)
- Operational/maintenance aspects;
- It was determined that the benefits of installing the units under cover (e.g., inside a small shed or retrofitted bin composter) with a winch system to assist with emptying the units greatly outweighed the additional infrastructure costs.
- This greatly reduced wear and tear on the freezer component of the system during emptying, eliminated clogging of the removable filter component, as well as provided enhanced access to the unit for periodic cleaning/maintenance by a refrigeration professional.
- Farm visitation by animals and other disease vectors
- Field trials on two pilot project farms over two years regarding
- Freezer unit capacity
- After tracking two years of full farm collection/hauling data, we were able to increase the per unit capacity number in the calculator/matrix from 1,500 lbs. to 1,800 lbs., thereby reducing the number of units required per farm to satisfy that farm’s capacity needs.
- Quality of life issues for growers and neighbors
- Both farms reported improved quality of life, largely thanks to the elimination or reduction of animals, insects and smells associated with composting.
- Farm visitation by animals and other disease vectors
- Both farms reported elimination or reduction of the scavenging animals and disease-carrying insects commonly associated with composting.
- Operational and collection/hauling aspects
- With the benefit of two years of actual use in the field, we entirely re-designed the sheds used for housing the freezer units.
- The biggest improvements were created by turning the units so they faced each other rather than all lined up side-by-side facing outward. (See additional information for supporting documentation and diagrams.) This change then meant that the grower went inside the shed (and out of the elements) to load the units. This change also provided direct access to the fork pockets, allowing for quicker emptying and replacement with a forklift.
- Freezer unit capacity
- Performing literature reviews and interviews regarding
- Farm visitation by animals and other disease vectors
- More research confirming the connection between farm visitation by scavenger animals and the use of composting was recently published by the USDA National Wildlife Research Center:
- “Certain wildlife species may become habituated to anthropogenically modified habitats, especially those associated with abundant food resources. Such behavior, at least in the context of multiple farms, could facilitate the movement of IAV from farm to farm if a mammal were to become infected at one farm and then travel to a second location. … As such, the potential intrusion of select peridomestic mammals into poultry facilities should be accounted for in biosecurity plans.”
- Root, J. J. et al. When fur and feather occur together: interclass transmission of avian influenza A virus from mammals to birds through common resources. Sci. Rep. 5, 14354; doi:10.1038/ srep14354 (2015) at page 6 (internal citations omitted; emphasis added).
- More research confirming the connection between farm visitation by scavenger animals and the use of composting was recently published by the USDA National Wildlife Research Center:
- Pathogen/disease transmission,
- Animals and insects have long been known to be carriers of dozens of pathogens harmful to poultry – and to people. Recently, however, the USDA National Wildlife Research Center demonstrated conclusively that mammals are not only carriers – they also can transmit avian influenza virus to birds.
- The study’s conclusion is particularly troubling given the number and variety of mammals and other animals that routinely visit composting sheds as demonstrated by our research using a game camera. These same animals also routinely visit nearby waterways and other poultry farms increasing the likelihood of cross-contamination, as explained in this the video titled Farm Freezer Biosecurity Benefits.
- “When wildlife and poultry interact and both can carry and spread a potentially damaging agricultural pathogen, it’s cause for concern,” said research wildlife biologist Dr. Jeff Root, one of several researchers from the National Wildlife Research Center, part of the USDA-APHIS Wildlife Services program, studying the role wild mammals may play in the spread of avian influenza viruses.
- Animals and insects have long been known to be carriers of dozens of pathogens harmful to poultry – and to people. Recently, however, the USDA National Wildlife Research Center demonstrated conclusively that mammals are not only carriers – they also can transmit avian influenza virus to birds.
- Biosecurity measures
- Every day the grower collects routine mortality and stores it inside large freezer units. After the broiler flock is caught and processed, but before the next flock is started – i.e. when no live birds are present, a customized truck and forklift empty the freezer units and hauls away the deadstock. During this 10- to 20- day window between flocks biosecurity is relaxed and dozens of visitors (feed trucks, litter brokers, mortality collection) are on site in preparation for the next flock.
- “Access will change after a production cycle,” according to a biosecurity best practices document (enclosed) from Iowa State University. “Empty buildings are temporarily considered outside of the [protected area and even] the Line of Separation is temporarily removed because there are no birds in the barn.”
- Every day the grower collects routine mortality and stores it inside large freezer units. After the broiler flock is caught and processed, but before the next flock is started – i.e. when no live birds are present, a customized truck and forklift empty the freezer units and hauls away the deadstock. During this 10- to 20- day window between flocks biosecurity is relaxed and dozens of visitors (feed trucks, litter brokers, mortality collection) are on site in preparation for the next flock.
- Nutrient management comparisons
- Research provided by retired extension agent Bud Malone (enclosed) provided us with the opportunity to calculate nitrogen and phosphorous numbers for on-farm mortality, and therefore, the amount of those nutrients that can be diverted from land application through the use of freezer units instead of composting.
- The research (contained in an enclosed presentation) also provided a comparison of the cost-effectiveness of various nutrient management BMPs – and a finding that freezing and recycling is about 90% more efficient than the average of all other ag BMPs in reducing phosphorous.
- Quality of life issues for growers and neighbors
- Local and county governments in several states have been compiling a lot of research on the various approaches for ensuring farmers and their residential neighbors can coexist peacefully.
- Many of the complaints have focused on the unwanted scavenger animals, including buzzards/vultures, raccoons, foxes and feral cats, as well as the smells associated with composting.
- The concept of utilizing sealed freezer collection units to eliminate the smells and animals associated with composting is being considered by some government agencies as an alternative to instituting deeper and deeper setbacks from property lines, which make farming operations more difficult and costly.
- Farm visitation by animals and other disease vectors
Future Plans
We see more work on three fronts:
- First, we’ll continue to do monitoring and testing locally so that we may add another year or two of data to the time frames utilized initially.
- Second, we are actively working to develop new more profitable uses for the deadstock (alternatives to rendering) that could one day further reduce the cost of mortality management for the grower.
- Lastly, as two of the biggest advantages of this practice – biosecurity and nutrient management – garner more attention nationwide, our hope would be to see more thorough university-level research into each of the otherwise disparate topics that we were forced to cobble together to develop a broad, initial understanding of this BMP.
Corresponding author (name, title, affiliation)
Victor Clark, Co-Founder & Vice President, Legal and Government Affairs, Farm Freezers LLC and Greener Solutions LLC
Corresponding author email address
Other Authors
Terry Baker, Co-Founder & President, Farm Freezers LLC and Greener Solutions LLC
Additional Information
https://rendermagazine.com/wp-content/uploads/2019/07/Render_Oct16.pdf
Farm Freezer Biosecurity Benefits
One Night in a Composting Shed
—
Avian flu conditions still evolving (editorial)
USDA NRCS Conservation fact sheet Poultry Freezers
How Does It Work? (on-farm freezing)
Influenza infections in wild raccoons (CDC)
Collection Shed Unit specifications
Collection Unit specifications
Freezing vs Composting for Biosecurity (Render magazine)
Manure and spent litter management: HPAI biosecurity (Iowa State University)
Acknowledgements
Bud Malone, retired University of Delaware Extension poultry specialist and owner of Malone Poultry Consulting
Bill Brown, University of Delaware Extension poultry specialist, poultry grower and Delmarva Poultry Industry board member
Delaware Department of Agriculture
Delaware Nutrient Management Commission
Delaware Office of the Natural Resources Conservation Service
Maryland Office of the Natural Resources Conservation Service
The authors are solely responsible for the content of these proceedings. The technical information does not necessarily reflect the official position of the sponsoring agencies or institutions represented by planning committee members, and inclusion and distribution herein does not constitute an endorsement of views expressed by the same. Printed materials included herein are not refereed publications. Citations should appear as follows. EXAMPLE: Authors. 2017. Title of presentation. Waste to Worth: Spreading Science and Solutions. Cary, NC. April 18-21, 2017. URL of this page. Accessed on: today’s date.
Closing Abandoned Livestock Lagoons Effectively to Utilize Nutrients and Avoid Environmental Problems
Proceedings Home | W2W Home
Purpose
In Nebraska alone, nearly 400 earthen manure storage structures are in operation; approximately four dozen requests to cease operation of permitted lagoons were received by the Nebraska Department of Environmental Quality in the prior decade with many more non-permitted storage structures being in need of proper closure. Abandoned livestock lagoons, earthen manure storage basins, and other manure storages (e.g. concrete pits) need to be decommissioned in a manner that controls potential environmental risk and makes economical use of accumulated nutrients. Currently, limited guidance is available to support lagoon closure planning and implementation and few professionals who support livestock producers have experience planning or participating in the manure storage closure process. The main focus of this project was to produce two videos that document the processes for planning and executing a lagoon closure.
What did we do?
The University of Nebraska Haskell Ag Laboratory, located near Concord, NE, had an anaerobic lagoon that was operated for over 20 years, but has not received swine manure additions since 2009 when the swine unit was depopulated. The decommissioning of this storage structure was proposed in 2014 and provided our team an opportunity to plan, implement and document the procedures necessary to properly close this structure. When we went to find material on how to accomplish this properly, we did not find suitable material. Two grants were secured in 2016 from the U.S. Pork Center of Excellence (USPCE) to fund our team efforts to document the closure process – from planning to completion – with two separate videos. The first video is focused on the planning activities necessary to prepare for removal and utilization of stored liquid and sludge. The second is focused on the liquid and sludge removal and utilization activities, decommissioning of conveyance structures, and deconstruction of the lagoon berm to return the site to a natural grade.
Activities conducted to execute the lagoon closure have included:
1) Mapping of sludge levels with sonar and analyzing sludge samples to estimate volume and nutrient content of sludge, which enabled development of a land application plan for utilizing the products
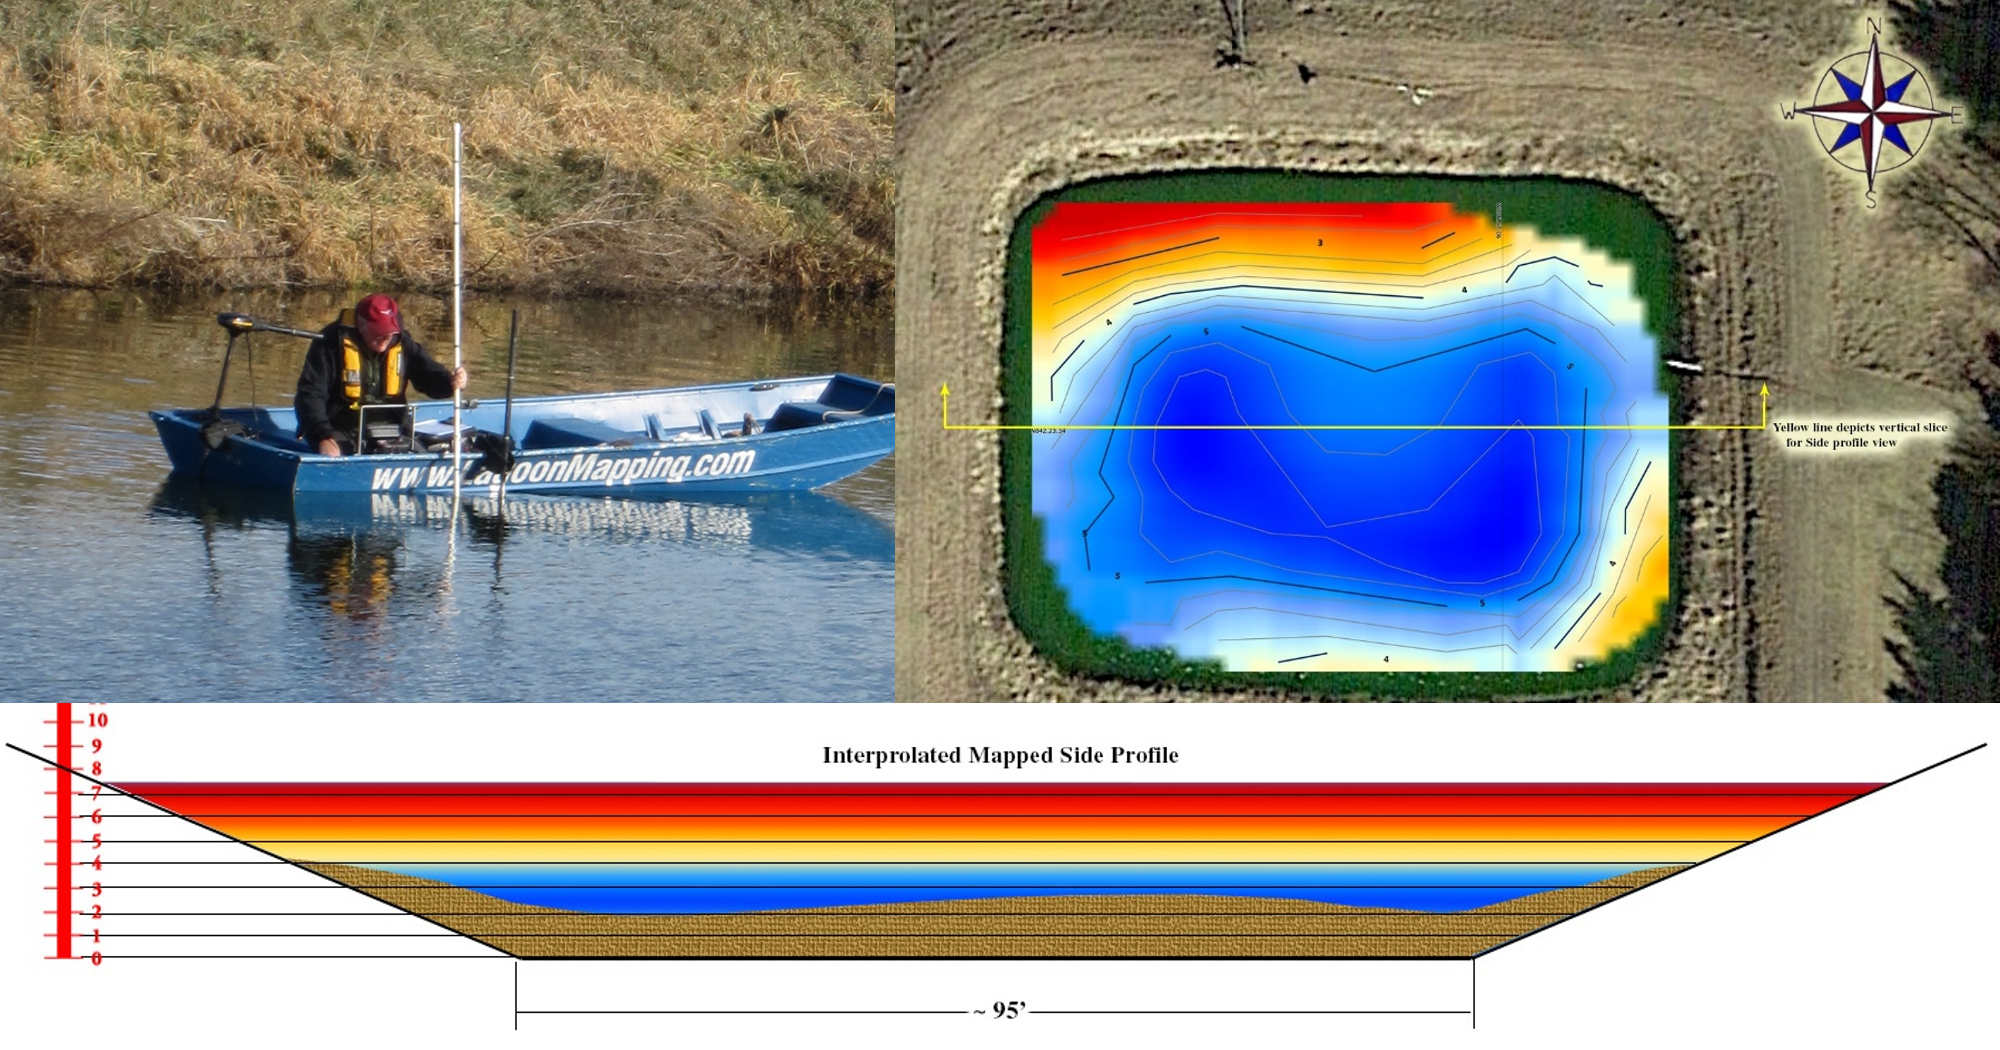
Figure 1. Sonar sludge mapping.
2) De-watering the lagoon (effluent used for sprinkler irrigation and flood irrigation)
3) Hosting a demonstration event during which participants:
a. observed sludge removal and land application processes,
b. participated in a manure spreader calibration,
c. inspected the soil beneath the lagoon liner,
d. viewed the abandoned production buildings and heard about options for eliminating conveyance of liquid from the building to the lagoon,
e. explored alternative sludge removal methods, and
f. participated in a classroom session where presenters shared details of the closure planning process, cost-share opportunities for closure of manure storage structures, and expectations for re-grading and re-seeding the site following removal of sludge.

Figure 2. Participants learned about planning land application of the sludge.
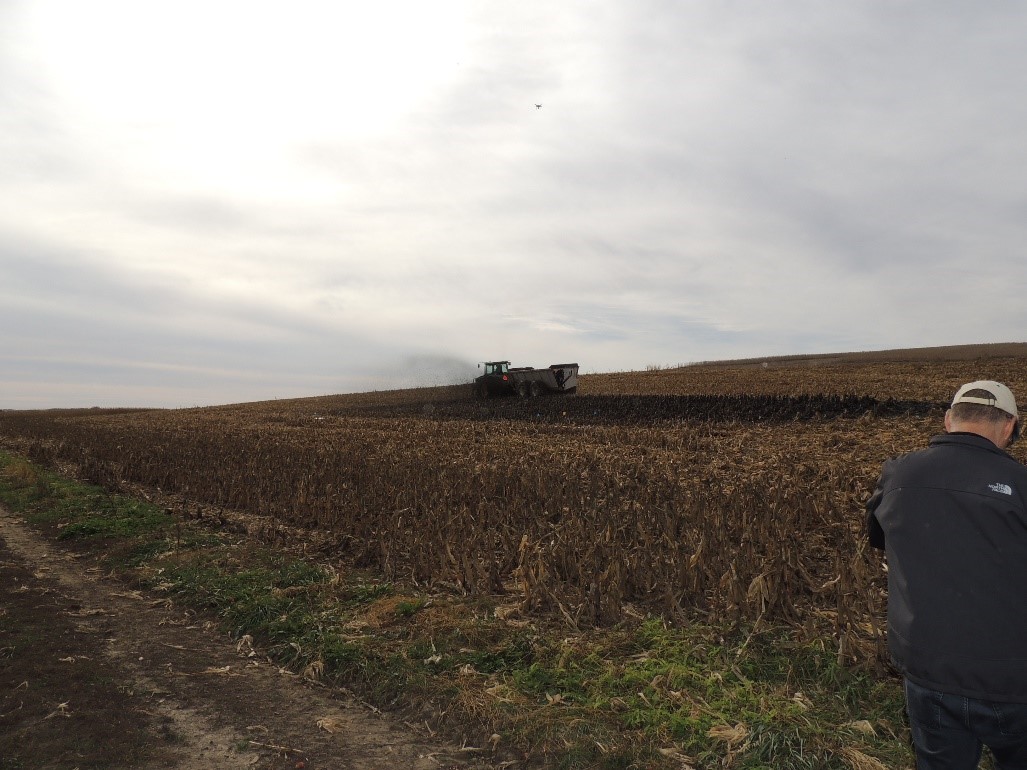
Figure 3. Land application of the sludge and calibration of the manure spreader.
4) Removing the sludge and applying it to cropland following the demonstration event.
Documentation of all planning, demonstration, and closure execution activities have been captured via extensive video footage, still photos, and participant interviews. Production of the videos is in process with completion and release of videos anticipated in summer 2017.
What have we learned?
Although every manure storage closure process is expected to present its own unique challenges and opportunities for learning, the process documented during this project has provided a number of insights:
1) While this process involved pumping liquid from the lagoon prior to attempting sludge removal in order to observe the sludge layer and document the volume present, a more appropriate, and likely more effective, process is to agitate the storage prior to and during pumping activities to enable handling all of the material as a slurry;
2) Dewatered sludge volume (nearly 200,000 gallons) and nutrient content (44.2 lbs. TKN, 37.5 lbs. organic N, 89.3 lbs. P2O5 and 7.6 lbs. K2O per 1,000 gallons) for this system yielded enough nutrients to apply to 80-100 acres, based on a phosphorus removal rate. It is unknown what the release of the organic N component of the sludge will be, but using just the phosphorus content, application of 1000 gallons per acre would provide enough phosphorus for what would be removed from 220 bushels of corn, which is worth approximately $35 with winter 2017 prices.;
3) Given the high phosphorus content in the sludge and that the nearby fields at the Haskell Ag Lab were not in need of phosphorus, an appropriate application rate for the sludge was determined as 8-10 tons/acre;
4) Soil beneath the lagoon liner yielded a phosphorus concentration of 556 ppm, likely a result of an inadequate liner in the lagoon as originally constructed in the 1960s; and
5) Installation of a bentonite clay liner during renovation of the structure in 1992 appeared to be effective as the liner was fully intact when observed during closure activities.
Pre-post surveys completed by 33 attendees of the demonstration event revealed that attendees improved their confidence in performing six key tasks identified by the team as being impactful. Results are summarized in Figure 4.
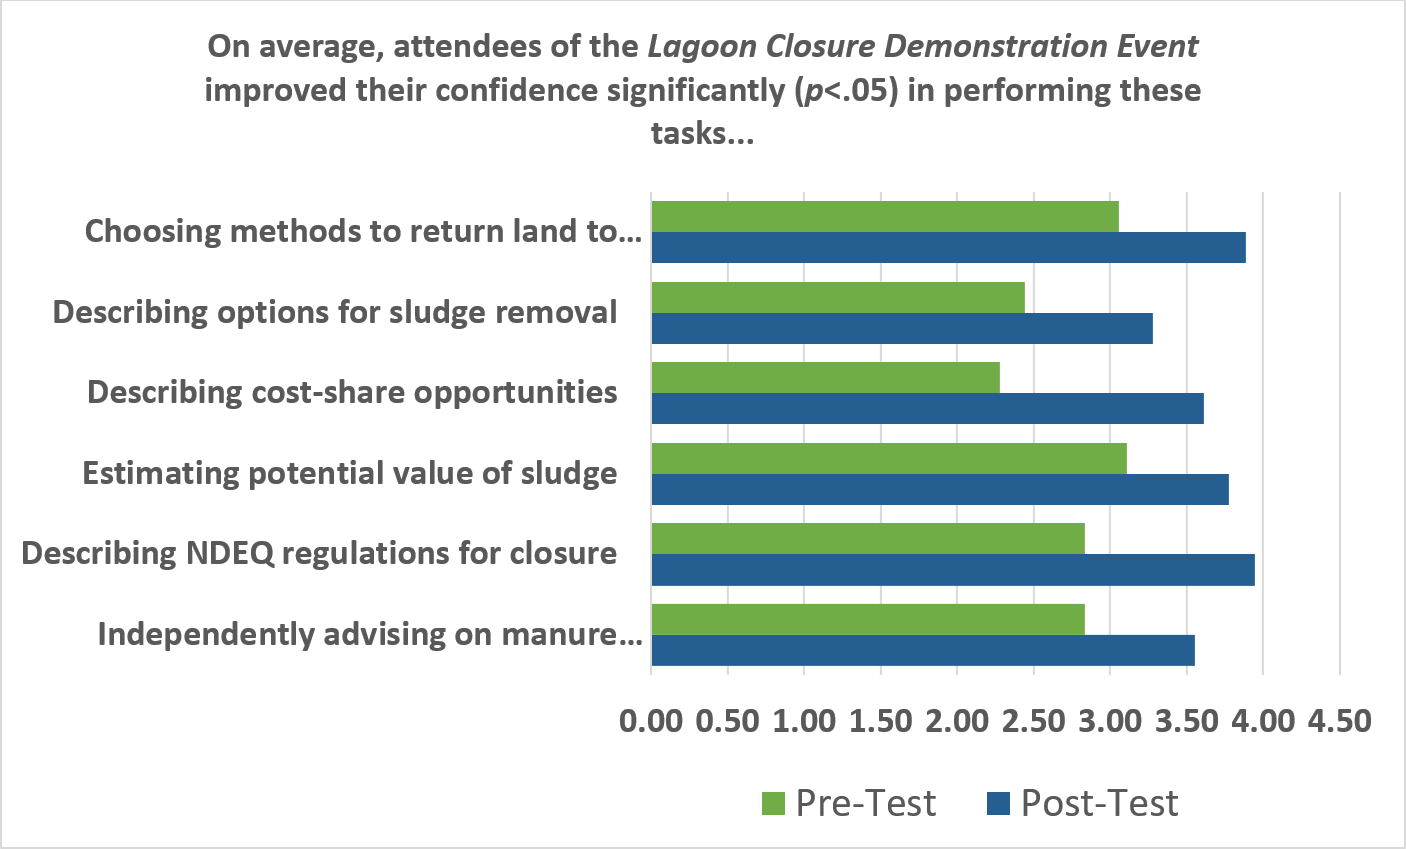
Figure 4. Impacts of the lagoon closure demonstration event.
Future Plans
We plan to continue the decommissioning process by:
1) Completing sludge removal and application to cropland;
2) Deconstructing the berms, leaving the liner intact, and returning the area to natural grade;
3) Seeding the area to establish ground cover and mitigate runoff and erosion; and
4) Plugging the inlet pipes in manure pits within the animal housing in lieu of removing buried conveyance pipes.
The two videos are in production and will be made available through the Pork Information Gateway (www.porkgateway.org) during summer 2017.
Corresponding author, title, and affiliation
Leslie Johnson, Research Technologist, University of Nebraska – Lincoln
Corresponding author email
Other authors
Charles Shapiro and Amy Schmidt, University of Nebraska – Lincoln
Additional information
Acknowledgements
The authors would like to recognize the U.S. Pork Center of Excellence (USPCE) for funding the development of the videos documenting this process and enabling us to complete this project. We would also like to acknowledge that without the support of the industry, who provided equipment and advice, we would not have been able to get this project off the ground. Also a special thanks to the Agricultural Research Division for their support.
Water Quality Regulations and Animal Agriculture Curriculum Materials
As livestock and poultry production has intensified it is no surprise that regulations have become a more prominent part of the business. This module introduces the Clean Water Act (CWA) and it application to animal agriculture. This material was developed for use in beginning farmer and extension programs, high school classrooms, and for self-study or professional continuing education.
Agriculture Professionals and Farmers
Check out this self-study module “Playing By the Rules“. This module is estimated to take 60 minutes and offers a certificate upon successful completion.
Teachers, Extension, Consultants
Educators are welcome to use the following materials in their classrooms and educational programs. More modules…
- Instruction Guide – includes lesson plan, links to additional information, connections to national agriculture education standards (AFNR Career Content Cluster Standards), application to Supervised Agricultural Experience (SAE) projects, sample quiz/review questions, and enrichment activities.
- Presentation – 36 slides, Powerpoint 97-2003 format. Annotated.
Acknowledgements
Author: Thomas Bass, Montana State University
Reviewers: Paul Hay, University of Nebraska, Lyle Holmgren, Utah State University, Jill Heemstra, University of Nebraska, Elizabeth Burns Thompson, Drake University (law student), Mary Catherine Barganier, NYFEA, Shannon Arnold, Montana State.
Building Environmental Leaders in Animal Agriculture (BELAA) is a collaborative effort of the National Young Farmers Educational Association, University of Nebraska-Lincoln, and Montana State University. It was funded by the USDA National Institute for Food and Agriculture (NIFA) under award #2009-49400-05871. This project would not be possible without the Livestock and Poultry Environmental Learning Community and the National eXtension Initiative.
Water Quality Regulations and Animal Agriculture
View more presentations from LPELC
Pathways for Effective Manure Nutriment Management Information Sharing and Education Between Agriculture Professionals: A South Dakota Pilot Test
Why Look at Barriers in Nutrient Management Information Flow?
The issue of manure nutrient management has been the subject of controversy and new policies in recent years as the non-point source discharge of nutrients and bacteria is substantial if manure is not managed properly. Unfortunately, there are barriers between organizations and individuals that prevent the flow of important, timely information between audience types and limits the impact and usefulness of research results. These barriers may be in the form of institutional language differences, job descriptions, or a mismatch between information outputs and inputs.
What did we do?
A national team of researchers, Extension specialists, consultants and government staff developed a survey to quantify the role, programming, and barriers to information flow between organizations and individuals regarding manure nutrient management. The electronic survey was disseminated via cooperating agencies, organizations and personal contacts to technical service providers, producers, university personnel, regulatory personnel, private sales or service enterprises and other professionals who contribute to manure nutrient management in South Dakota. Respondents were asked to indicate the relevance of information sources (inputs), information products (outputs) and collaborators (links), as well as barriers to their use. The relevance selections were transformed into scalar data and an analysis of variance was performed on the average relevance scores to test for differences based on input/output/link type and organization type.
What have we learned?
There were 139 surveys started, and 80 surveys completed. Data from partially completed surveys were, however, included in the analysis. The main categories of self-identified respondents were NRCS (n=36), Producers (n=29), University personnel (n=15) and Regulatory personnel (n=9). The remaining categories respondents were grouped into an Other category (n=22). The average relevance score for each of the information sources, information products and collaborations listed in the survey were consistent (no significant difference between organization types). As sources of information, consultation, eXtension and field days were ranked most relevant, with classroom and social media being least relevant. Similarly, consultation, field days and eXtension were ranked the most relevant means of sharing information; social media was ranked least relevant. Barriers to information sources and products were specific to the activity or product. The select ion “No barriers to use” was not an indicator of relevance. All organization types deemed producers the most relevant collaborator, followed by state, university and federal agencies.
Future Plans
The South Dakota-based survey was a pilot test for a nationwide survey being conducted in 2015. From feedback and data review, the survey has been refined and shortened to elicit the key input, output and collaborator data. With the national data in hand later in 2015, the project team looks forward to linking information producers and users in effective pathways for manure nutrient management information transmission, and ultimately, adoption.
Authors
Erin Cortus, Assistant Professor and Environmental Quality Engineer at South Dakota State University erin.cortus@sdstate.edu
Nichole Embertson, Nutrient Management Specialist, Sustainable Livestock Production Program, Whatcom Conservation District; Jeffrey Jacquet, Assistant Professor, Sociology and Rural Studies, South Dakota State University
Additional information
Anyone interested in participating on the Pathways Project team are invited to contact Erin Cortus (erin.cortus@sdstate.edu) or Nichole Embertson (NEmbertson@whatcomcd.org).
Acknowledgements
The nationwide team who contribute to and guide the Pathways project are gratefully acknowledged. Funding provided through the South Dakota SARE Mini-Grant Program supported data collection and analysis for the survey pilot test.
The authors are solely responsible for the content of these proceedings. The technical information does not necessarily reflect the official position of the sponsoring agencies or institutions represented by planning committee members, and inclusion and distribution herein does not constitute an endorsement of views expressed by the same. Printed materials included herein are not refereed publications. Citations should appear as follows. EXAMPLE: Authors. 2015. Title of presentation. Waste to Worth: Spreading Science and Solutions. Seattle, WA. March 31-April 3, 2015. URL of this page. Accessed on: today’s date.