With high input costs in 2022, many farmers are looking for affordable sources of nutrients. Poultry litter is in high abundance in areas of intense poultry production, such as North Carolina. However, a common concern for farmers is whether poultry litter will carry weed seed onto their farms. With the need to better distribute nutrients throughout these areas, the transport of poultry litter is necessary. Overcoming the concern about weed seeds is critical to improve these nutrient imbalances. Therefore, a germination study was conducted on 61 random poultry litters collected across North Carolina to determine the presence of viable weed seeds.
What Did We Do?
A series of 61 poultry litters were submitted to NC State University for testing, collected from industry representatives and Extension Agents across the state. Poultry litters were diluted with potting media to allow for germination of any existing weed seeds at a 9:1 (potting media:litter) ratio on a dry weight basis. Germination studies were then conducted using 20 g of the potting media-litter mix, replicated 5 times. Positive controls included potting media alone, and potting media mixed with poultry litter to verify there was no inhibitory effect of the poultry litter on germination. Both positive controls were spiked with one of three weed species at varying rates: 50 mustard, 50 rye, or 30 sicklepod. Additionally, three subsamples (20 g) of 10 of the poultry litters were wet sieved using three sieves with 2.8-, 1.0-, and 0.4-mm mesh sizes and dried at 35 °C. Seeds were counted under a dissecting microscope, and when located, seeds were removed and tested for viability using the imbibed seed crush test as described by Borza et al. (2007).
What Have We Learned?
Germination studies suggest small numbers of viable weed seeds, as only one seed germinated from unspiked samples. However, total weed counts suggest there can be high total seed numbers in the litters, with an average seed content of 1.17 seeds/100-g. Additionally, approximately 15% of the seeds collected were viable.
Future Plans
We intend to continue researching this topic and hope to further understand the impact of stockpiling, litter management, and handling on viable weed seeds in litter sources.
Authors
Stephanie B. Kulesza, Nutrient Management and Animal Waste Specialist, NC State University
Corresponding author email address
Sbkulesz@ncsu.edu
Additional authors
Ramon Leon, Weed Biology and Ecology Specialist, NC State University
Miguel Castillo, Forage Specialist, NC State University
Stephanie Sosinski, Forage Lab Technician, NC State University
The authors are solely responsible for the content of these proceedings. The technical information does not necessarily reflect the official position of the sponsoring agencies or institutions represented by planning committee members, and inclusion and distribution herein does not constitute an endorsement of views expressed by the same. Printed materials included herein are not refereed publications. Citations should appear as follows. EXAMPLE: Authors. 2022. Title of presentation. Waste to Worth. Oregon, OH. April 18-22, 2022. URL of this page. Accessed on: today’s date.
Stream Restoration at Mercer County Elks Golf Course, 2019
Grand Lake St. Marys (GLSM), located in Ohio, has experienced harmful algal blooms for decades. In 2010, a massive algal bloom shut down the Lake for the entire summer season. In 2011, the GLSM watershed was declared “distressed,” requiring a new set of rules imposed upon livestock producers in the watershed. These rules required each farm that produced over 350 tons of solid manure or 100,000 gallons of liquid manure per year to create and maintain a nutrient management plan. There was also a winter manure application ban enacted, which prohibits manure application from December 15 to March 1 of each year. These rules still apply to the watershed today.
What Did We Do?
Coldwater Creek Treatment Wetlands, established 2016 (Photo Summer 2021)
An influx of federal and state funds was poured into the watershed to assist the approximately 135 farms with constructing additional manure storage and other best management practices to improve manure management. Over 130 manure storage structures, 80 feedlot covers, 15 waste treatment systems, 20 leachate collection systems and 5 mortality compost structures were built from 2011 through 2019.
KDS Separator Pilot (Swine Manure Solids), March 2018
Other local efforts to improve water quality in GLSM include the restoration and creation of new wetlands to treat stream flow prior to entering GLSM. Since 2010, we have more than doubled the acreage of wetlands along the south side of the lake and have seen an incredible diversification of wildlife in the area. Additional best management practices have also been installed, such as stream restoration projects, saturated buffers, tile phosphorus filters, double cropping, cover crops and much more. Mercer County has also expended a considerable amount of effort to research manure nutrient recovery technologies throughout the last six years. Manure nutrient recovery is challenging due to cost; however, many technologies can achieve a 90+% recovery of phosphorus from manure.
What Have We Learned?
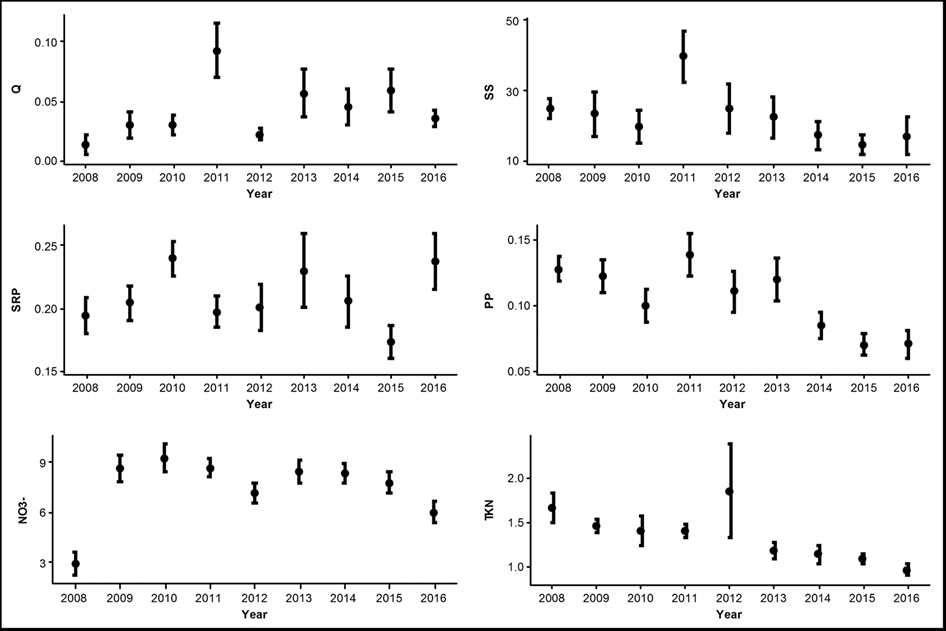
Long-term monitoring data is collected on two streams feeding GLSM, Chickasaw Creek (installed in 2008) and Coldwater Creek (installed in 2010). The data from Chickasaw Creek was used to determine the effects of the best management practices installed along with the effects of the winter manure application ban. The data showed a reduction of 10-40% of nitrogen and phosphorus because of these improved practices (Figure 1).
Figure 1. Nutrient Reduction Trends Pre and Post Distressed Watershed (Pre-Condition 2008-2011; Post-Condition 2012-2016) Jacquemin, etal (2016).
Future Plans
Nutrient management planning is an ongoing effort in the Grand Lake St. Marys watershed and will continue as long as the watershed remains distressed. Research and collaboration continue on manure nutrient recovery and development and adoption of technologies. Monitoring of stream and effectiveness of treatment wetland will also continue to ensure that maintenance and management is conducted appropriately. Additional conservation projects, including wetlands, stream restoration and more are planned in the coming years.
Author
Theresa A. Dirksen, PE, Mercer County, Ohio Agriculture & Natural Resources Director
Additional Information
Jacquemin, Stephen J., Johnson, Laura T., Dirksen, Theresa A., McGlinch, Greg. “Changes in Water Quality of Grand Lake St. Marys Watershed Following Implementation of a Distressed Watershed Rules Package.” Journal of Environmental Quality, January 12, 2018.
Jacquemin, Stephen J., McGlinch, Greg, Dirksen, Theresa, Clayton, Angela. “On the Potential for Saturated Buffers in Northwest Ohio to Remediate Nutrients from Agricultural Runoff.” PeerJ, April 12, 2020.
Dr. Stephen Jacquemin, Wright State University Lake Campus
Mercer Soil and Water Conservation District
Grand Lake St. Marys Restoration Commission
The authors are solely responsible for the content of these proceedings. The technical information does not necessarily reflect the official position of the sponsoring agencies or institutions represented by planning committee members, and inclusion and distribution herein does not constitute an endorsement of views expressed by the same. Printed materials included herein are not refereed publications. Citations should appear as follows. EXAMPLE: Authors. 2022. Title of presentation. Waste to Worth. Oregon, OH. April 18-22, 2022. URL of this page. Accessed on: today’s date.
Intensive animal husbandry produces large volumes of liquid manure with significant amounts of phosphorus, ammonium, and potassium as they pass through the feed of farm animals. As a result, direct land application of manure, the current common approach, causes environmental concerns such as soil over-fertilization and groundwater and surface water contamination, which leads to eutrophication. Manure nutrient management is, therefore, necessary to address these problems. While most engineering options are focused on phosphorus and ammonium recovery, few studies have pursued recovery methods for potassium. In this talk, we present an electrochemical technology using a sacrificial magnesium anode and a stainless-steel cathode for simultaneous recovery of phosphorus and potassium in the form of potassium-magnesium-phosphate (KMgPO4·xH2O, K-struvite).
Mg2+ + K+ + HnPO4n-3 + 6H2O = KMgPO4*6H2O + nH+
K-struvite has the potential to be used as a slow-release fertilizer and this technology will add flexibility to the manure management strategies currently available by diversifying the recoverable by-products.
What Did We Do?
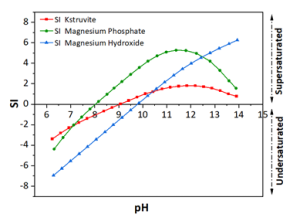
Figure 1. Calculated saturation index values as a function of pH. The water matrix contains 3000 mg/L potassium, 1000 mg/L phosphate, and magnesium with Mg:P ratio of 1.4.
To predict the thermodynamic stability of K-struvite, a thermodynamic model was developed based on the average ion concentrations of phosphorus, and potassium measured in real liquid pig manure (Figure 1). According to this model, magnesium phosphate is a possible by-product of K-struvite precipitation. Also, the probable formation of magnesium hydroxide was enhanced with increasing pH value due to the increase in hydroxide ion concentration. As a result, the ideal range for precipitation of K-struvite lies at pH values between 10 and 11.
To understand the role of pH on K-struvite formation, a 50 mM KH2PO4 solution was used to perform the preliminary batch electrochemical experiments. A constant voltage of -0.8 V vs. the Ag/AgCl reference electrode was applied to the pure magnesium anode using a potentiostat. One experiment was performed on the natural pH of the initial solution, 4.5, while potassium hydroxide was used to raise the initial pH of the second experiment to 9.5.
What Have We Learned?
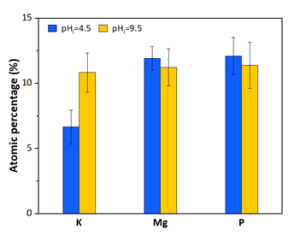
Figure 2. The EDS results obtained of the recovered precipitates (a) pH=4.5, (b) pH=9.5 in 50 mM KH2PO4.
Energy-dispersive x-ray spectroscopy (EDS) of the recovered precipitates (Figure 2) indicate that by raising the initial pH from 4.5 to 9.5 the amount of potassium is increased in the precipitates. Also, due to the equimolar ratios of K:Mg:P at pH=9.5, the produced precipitates are likely K-struvite, while the pH= 4.5 sample likely contains some amount of magnesium phosphate.
This process also eliminates the disadvantages of the commonly used chemical precipitation methods, including magnesium salt dosing, and adding base to the system for pH control, due to in situ magnesium corrosion and hydroxide production at the magnesium anode surface. These advantages could potentially reduce the operating cost of the system and eliminate the addition of unnecessary salinity to wastewater through magnesium salt dosing.
Future Plans
Further investigation by using multiple characterization techniques (e.g., x-ray diffraction (XRD) and Fourier transform infrared spectroscopy (FT-IR)) is necessary to identify the exact nature of precipitates. The initial experiments will be repeated at additional pH values to further understand the role of pH on the precipitation of K-struvite in the simplified synthetic wastewater and to further detail the characterization of the composition and morphology of K-struvite precipitates. These experiments are valuable , particularly because there are few literature reports that detail the physical and chemical structure of K-struvite.
Authors
Presenting author
Amir Akbari, Ph.D. Candidate, Department of Chemical and Biomedical Engineering, Pennsylvania State University
Corresponding author
Lauren F. Greenlee, Associate Professor, Department of Chemical and Biomedical Engineering, Pennsylvania State University
Corresponding author email address
greenlee@psu.edu
Additional Information
Once completed, future publications and data repository information will be available at https://sites.psu.edu/greenlee/
Acknowledgements
The authors would like to thank the U.S. Department of Agriculture, NIFA AFRI Water for Food Production Systems (#2018-68011-28691) for providing the funding support of this research through the “Water and Nutrient Recycling: A Decision Tool and Synergistic Innovative Technology” project.
The authors are solely responsible for the content of these proceedings. The technical information does not necessarily reflect the official position of the sponsoring agencies or institutions represented by planning committee members, and inclusion and distribution herein does not constitute an endorsement of views expressed by the same. Printed materials included herein are not refereed publications. Citations should appear as follows. EXAMPLE: Authors. 2022. Title of presentation. Waste to Worth. Oregon, OH. April 18-22, 2022. URL of this page. Accessed on: today’s date.
Recent deaths associated with hydrogen sulfide exposure from manure systems have highlighted the need for increased awareness to reduce health risks. While information on some aspects of hydrogen sulfide release from manure are available, there is limited information on the characteristics when agitating manure storages and in manure processing buildings that result in concentrations that are dangerous to human health. This project aimed to gather data on emissions from manure storages and processing to assess risks and develop mitigation strategies for these risks.
What Did We Do?
Our research team acquired over 20 days of field data (at multiple livestock farms) to assess the air concentrations from manure storages with and without agitation, for hydrogen sulfide, methane, ammonia, and particulate matter. The emissions were measured over the course of eight hours using numerous sets of sensors around the manure storage during agitation for each sampling event. Each sampling event had one backpack that was worn by a researcher with a set of sensors to represent the concentrations relevant to someone working in the area. Five additional sensor sets were placed around the manure storage. Some sensor sets remained in the same position throughout sampling (e.g., at the location of the agitation equipment controls) while others were moved around the storage. Researchers also measured the concentrations of these gases inside a manure processing room to assess the concentration changes with different air exchange rates. During each event manure samples were collected as well as weather data to relate to the manure emissions data.
What Have We Learned?
This research assessed the environmental and design conditions of manure systems that may lead to increased concentrations of gases that have human health implications. The results indicate critical operating parameters on how to manage manure systems to limit risk from gases produced from manure processing and storage areas. More details on the study results will be available soon and will be presented at the conference.
This work is supported by Foundational Program CARE 2019-68008-29829 from the USDA National Institute of Food and Agriculture.
The authors are solely responsible for the content of these proceedings. The technical information does not necessarily reflect the official position of the sponsoring agencies or institutions represented by planning committee members, and inclusion and distribution herein does not constitute an endorsement of views expressed by the same. Printed materials included herein are not refereed publications. Citations should appear as follows. EXAMPLE: Authors. 2022. Title of presentation. Waste to Worth. Oregon, OH. April 18-22, 2022. URL of this page. Accessed on: today’s date.
In Ohio, the surface application of swine manure to soft red winter wheat in late March or early April is a common practice. This process makes good use of the ammonium nitrogen in the manure and provides an in-season window to apply manure to a growing crop. The savings in purchased nitrogen fertilizer can help offset most of the manure application expense.
The Maumee River in Northwest Ohio drains into the Western Lake Erie Basin and has been the ongoing focus of concern as phosphorus carried to the lake continues to be cited as a cause of harmful algal blooms. The surface application of manure, without follow up incorporation tillage, could be banned if water quality problems persist. This could jeopardize the application of manure to wheat and the application of manure to forages between cuttings. The purpose of this research project was to determine if manure could be subsurface applied to wheat using a Grassland Applicator toolbar and produce similar yields to surface applied manure or commercial fertilizer. If this method of manure application was successful, it could become a viable option for livestock farmers and commercial manure applicators wanting to apply manure to wheat in the Maumee River watershed.
Subsurface applied manure to wheat is not common practice in Ohio. Wheat plants and plant roots are damaged as the Grassland Applicator travels across the wheat field. This study sought to document yield losses if they occurred.
What Did We Do
This one-year study was designed to determine if manure could be subsurface applied to wheat and produce similar yields to surface applied manure or commercial fertilizer. Three livestock farmers with available wheat fields were contacted for on-farm manure plots. Each of the three farmers had slightly different comparison plots so we will refer to them as the Haselman Farm, the Maag farm, and the Leopold farm.
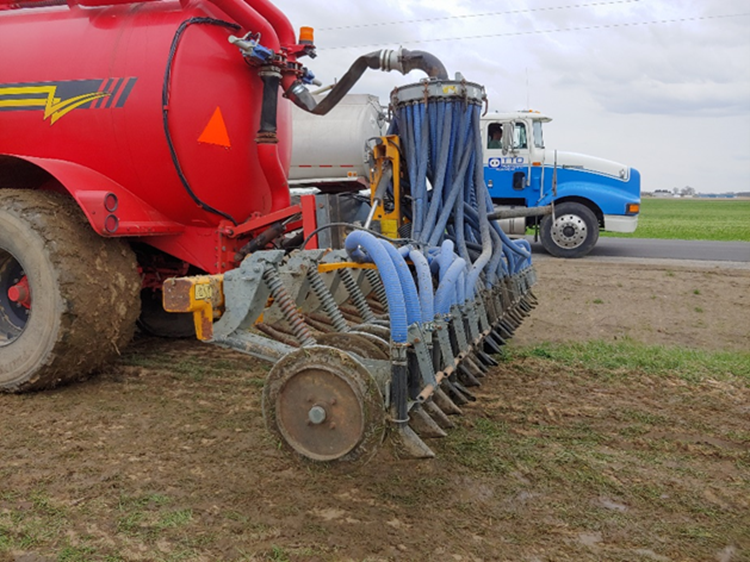
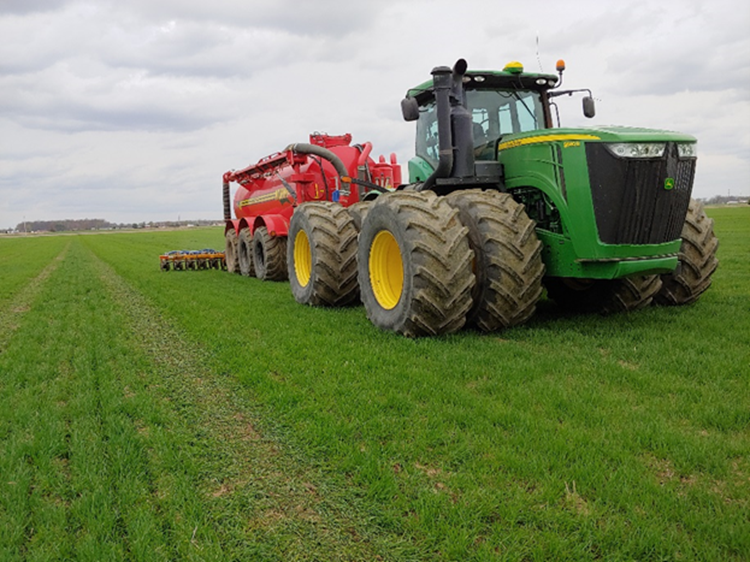
A 20-foot wide Grassland Applicator toolbar was attached to a 7,350 gallon manure tanker and used to subsurface apply manure to soft red winter wheat fields in early April. The manure tanker was owned by a commercial manure applicator and the livestock producers paid the commercial applicator for the manure application. The Grassland Applicator toolbar was owned by one of the livestock farmers.
The Haselman field compared subsurface applied manure to surface applied manure. Liquid swine finishing manure was both surface applied and subsurface applied in 40-foot (two 20-foot passes with the toolbar) treatments that were 1,050 feet long. Four treatments of subsurface applied manure were compared to four treatments of surface applied manure in a randomized block design. The surface application was accomplished by raising up the Grassland Application toolbar so that it just grazed the soil surface. This field was a certified organic field.
A history of manure samples showed 25 pounds of available nitrogen per 1,000 gallons in the swine finishing manure. The subsurface application involved slicing the soil every 7.5 inches to a width of approximately three eights of an inch and having a boot to place the manure over the soil opening. The soil slices were approximately three and a half inches deep. This field was organic and the wheat had been planted as a surface seeding and incorporated with shallow tillage the previous fall so there were no rows to follow. Due to the width of the dual tires on the application tractor and the flotation tires on the manure tanker, we estimated 40% of the wheat was flattened during the application process. The wheat was in the V4 stage of growth when the surface and subsurface manure treatments were applied. The field was harvested in early July using a John Deere combine with a 30-foot header.
On the Maag field, the subsurface manure treatment was compared to 100 pounds per acre of nitrogen applied as 28%Urea Ammonium Nitrate (UAN). On this field, the manure applicator traveled at a slight angle (approximately 10%) to the direction the wheat was planted to avoid having the toolbar follow the row. Both the manure and the 28%Urea Ammonium Nitrate treatments were applied the same day. As with the Haselman field, we estimated 40% of the wheat was flattened during the application process. This was the last of the three fields treated and the wheat was in the late V5 stage of growth due to weather delays and the commercial applicator having other manure application commitments. The 28% UAN was applied with an applicator with a 120 foot boom width.
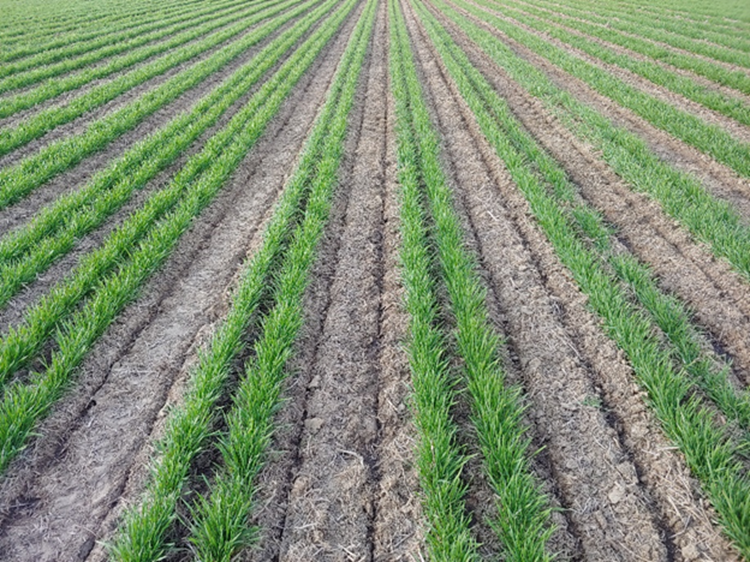
The Leopold field involved wide-row wheat in a field that was transitioning into organic status. The wheat had been planted in twin rows that were five inches apart and left 22.5 inches for equipment to travel between the twin rows. The Grassland Application toolbar was connected to a smaller tractor and tanker with wheels designed to travel between the wheat rows. As a result, there was very little wheat run over and minimal plant damage from the application toolbar. Previous manure samples from this swine nursery indicated 17 pounds of available nitrogen per 1,000 gallons. The subsurface manure application rate was 6,000 gallons per acre to get 102 pounds of available nitrogen. This was compared to 6,000 gallons of surface applied manure.
Figure 1: Closeup view of the Grassland Applicator toolbar.
Figure 2: Manure application to V4 stage wheat.
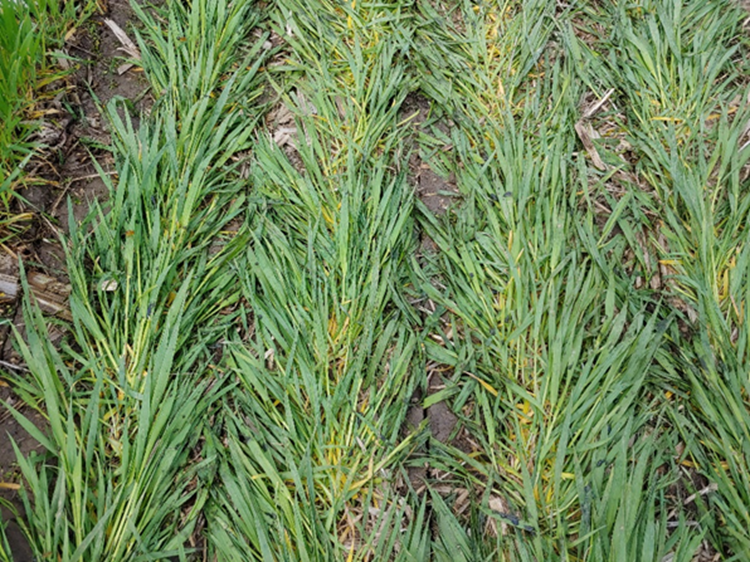
Figure 3: V5 stage wheat flattened by the manure tanker. Soil slices are the Grassland Applicator toolbar.
Figure 4: Wide-row wheat with subsurface nursery manure application.
Manure samples were collected and analyzed during the application process.
Table 1. Average nutrient analysis of swine manure applied.
Swine Finishing Manure
Swine Nursery Manure
Nutrient
Pounds per 1,000 gallons
Pounds per 1,000 gallons
Total Nitrogen
26.2
18.1
Ammonium Nitrogen (NH4)
24.4
16.5
Organic Nitrogen
1.2
1.0
Available Nitrogen
25.0
17.0
Phosphorus (P2O5)
7.1
4.3
Potash (K2O)
10.9
8.2
What Have We Learned
In the Haselman organic wheat field, the subsurface applied manure yielded less than the surface applied manure. The thought process is that the damage to the wheat plants and roots caused by the Grassland Applicator toolbar is responsible for this reduction. The wheat plants were in Feeks growth stage four and handled the tractor and tanker damage well. The tractor and manure tanker tracks through the field were visible but did not appear to cause much damage to the wheat.
In the Maag Farm where subsurface applied manure was compared to commercial fertilizer the subsurface applied yields were higher than the commercial fertilizer yields. This field was in Feekes growth stage five when the treatments occurred. The damage from the manure tanker tires was easy to see for over three weeks as plant growth was badly stunted. The size of the wheat heads in these tracks were much smaller than the undamaged areas of the field. Damage from the tractor tires seemed minimal even though the wheat was more advanced than we wanted.
In the Leopold field wide-row wheat plot, the incorporated manure outyielded the surface applied manure. The tractor tires and the Grassland Applicator toolbar caused minimal damage to the wheat plants. This field was also in Feekes growth four.
Table 2. Wheat yields for treatments comparing nitrogen applied as UAN at planting to side-dressed hog manure. Subscript letters a and b indicate yields that year were statistically different using ANOVA at 0.05 probability level.
Yield in Bushels per Acre
Treatments
Haselman Farm
Maag Farm
Leopold Farm
Subsurface applied finishing manure
95.4
102.6
Surface applied swine finishing manure
93.2
28% Urea Ammonia Nitrate
96.9
Subsurface applied swine nursery manure
82.1
Surface applied swine nursery manure
79.3
Least Significant Difference (0.05)
3.35
13.95
7.33
Coefficient of Variability
1.01
3.99
3.99
The subsurface application of manure using the Grassland Applicator produced wheat yields statistically similar to surface applied manure in the Haselman field. The surface applied manure had less damage to the wheat plants due to the applicator coulters not cutting into the soil.
In the Maag field the subsurface applied manure produces slightly higher yields (although not statistically higher) to the commercial fertilizer. The damage to the wheat field was severe where the tires of the tanker all but killed the wheat plants. The wheat was almost to elongation (Feekes growth stage six) and this field was the most advanced of the three fields studied. The damage from the tractor tires was not severe but the plant damage from the extreme weight of the tanker tires was evident. There was a delay in getting the commercial manure applicator to the field and this resulted in the wheat being more advanced than planned. Wheat heads from plants in the tire tracks were half the size of those where just the tractor track traveled. Wheat heads from the manured treatments also appeared to be larger than the wheat heads from the commercial fertilizer treatments.
In the Leopold field the surface applied manure was slightly less than incorporated manure. Since there was minimal plant damage to the wide-row wheat from the toolbar or the tractor, incorporating the manure may have saved more of the nitrogen compared to the surface applied manure.
Rainfall in the area of the three research fields from April 1st to June 15th was measured at 6.86 inches. Field conditions were unusually dry during application time which helped reduce damage from the tractor and manure tanker tires.
Future Plans
In this study the subsurface application of liquid swine finishing manure and liquid swine nursery manure produced wheat yields similar to surface applied manure and commercial fertilizer. We intend to continue this study in 2022 and 2023 with these farmers to gather additional data.
To avoid the damage from the manure tanker tires, a more ideal situation would be to connect the Grassland Applicator tool bar to a drag hose. This would be a more efficient method to apply manure and cause less field damage and compaction. We also plan to use the toolbar to eventually apply manure to forages between cuttings.
Authors
Arnold, G., Field Specialist, Manure Nutrient Management Application, Ohio State University Extension
Additional Information
Sundermeier, A. (2010). Nutrient management with cover crops. Journal of the NACAA, 3(1). Retrieved from https://www.nacaa.com/journal/index.php?jid=45
Vitosh, M. L., Johnson, J. W., & Mengel, D. B. (2003). Tri-state Fertilizer Recommendations for Corn, Soybeans, Wheat and Alfalfa. Purdue Extension, Lafayette, IN.
Zhang, W., Wilson, R. S., Burnett, E., Irwin, E. G., & Martin, J. F. (2016). What motivates farmers to apply phosphorus at the “right” time? Survey evidence from the Western Lake Erie Basin. Journal of Great Lakes Research, 42(6), 1343–1356. https://doi.org/10.1016/j.jglr.2016.08.007
Facebook Page: Ohio State University Environmental and Manure Management
The authors are solely responsible for the content of these proceedings. The technical information does not necessarily reflect the official position of the sponsoring agencies or institutions represented by planning committee members, and inclusion and distribution herein does not constitute an endorsement of views expressed by the same. Printed materials included herein are not refereed publications. Citations should appear as follows. EXAMPLE: Authors. 2022. Title of presentation. Waste to Worth. Oregon, OH. April 18-22, 2022. URL of this page. Accessed on: today’s date.
The overall purpose of this research was to demonstrate the volume, weight and moisture reduction from composting pen pack cattle manure so that organic nutrients can be transported farther from the livestock barn. Simultaneously, through laboratory analysis, the goal was to measure the nutrient density of the compost from the start of the process to the finish. The reduction in volume will allow cattle farmers to store more manure in their dry stack (manure) barns to be land-applied at more ideal times, thus avoiding winter application on frozen and/or snow-covered ground.
Due to the overwhelming weight and volume logistics of unprocessed (raw) manure in general, often the manure is land-applied to fields relatively close to the livestock barn. This phenomenon has historically resulted in some fields or areas within fields that have high or luxury levels of soil test phosphorus and potassium. Manure is a great source of nutrients and organic matter for crop production. Avoiding application of manure on fields that are farther from the livestock barn can result in lower soil health and missed economic opportunity for these fields. Once a drier, more nutrient-dense compost is created, a second purpose of the research is to promote transfer of the compost to fields that are farther from the livestock barn or to fields with lower soil test phosphorus or potassium levels.
A final purpose of the research is to utilize compost in corn production systems to evaluate its benefit when applied at the same nutrient rate as its raw manure or commercial fertilizer counterparts. When manure or compost are added to a crop production system, the health and biology of the soil are improved.
What Did We Do
The study began by working with local cooperators who currently raise cattle and manage manure nutrients. This peer learning group included five (5) cooperators. Each cooperator was asked to build at least one windrow of pen pack (solid, dry bedded) manure removed from their cattle barn. The windrow was not to exceed 6 feet in height by 12 feet in width and could be of any length. All manure was weighed at the start of the composting process and then at the end of the process to measure weight reduction. To measure volume, windrows were measured (height x width x length) at the start and finish; cooperating farmers recorded ‘trucks in’ and ‘trucks out’. The five cooperators built eight (n=8) windrows for the purpose of this study.
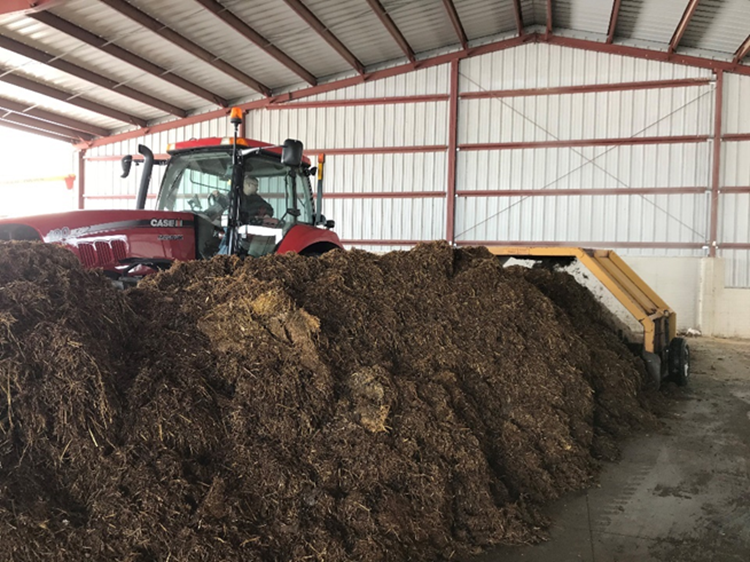
For baseline data, all cooperators were asked to dedicate one windrow for weekly mechanical compost turning inside a dry stack barn for eight (8) weeks. Any additional windrows composted were to address research questions raised by cooperators. Two ‘additional’ windrows were turned every 2 weeks and a third ‘additional’ windrow was turned weekly, but in an outdoor setting. Mechanical composting was achieved with an HCL Machine Works pull-type compost turner (Figure 1). The compost turner accomplished two key things: consistently mixing compost ingredients (manure, sawdust, wheat straw), and adding oxygen into the composting system. The compost turner was pulled by a Case IH 190 Magnum tractor equipped with a continuously variable transmission (CVT). The CVT allowed for critical ultra-slow speeds (.05-.15 mph) necessary for early mixing passes with the compost turner and raw ingredients.
Figure 1. A pull-type compost turner (6 foot x 12 foot) used for this study
Another significant part of the research was manure nutrient analysis. Every windrow site (n=8) had 3 samples pulled for analysis: once at the start of composting, after every compost turn (6-8 turns on average) and when the compost was land applied or at the last turn. Key nutrients analyzed were nitrogen, phosphorus, potassium, sulfur and calcium. Additionally, temperatures were monitored using a 36” dial compost thermometer (Figure 2) prior to every turn to ensure adequate composting temperatures (120-140 deg F ideally) were maintained. Each windrow also had a HOBO temperature logger inserted in the center of the pile for temperature logging every 15 minutes for the duration of the process.
Figure 2. Compost thermometers (36”) were used to double-check pre-turn temperatures each week
Finally, cooperators were asked to work with the researcher to develop a replicated field trial in field corn utilizing the finished compost product from their farm. Generally, the goal of the field trials were to compare a ‘normal’ rate of manure against a half rate of compost (Figure 3). Yield and moisture data from field trials were collected and analyzed.
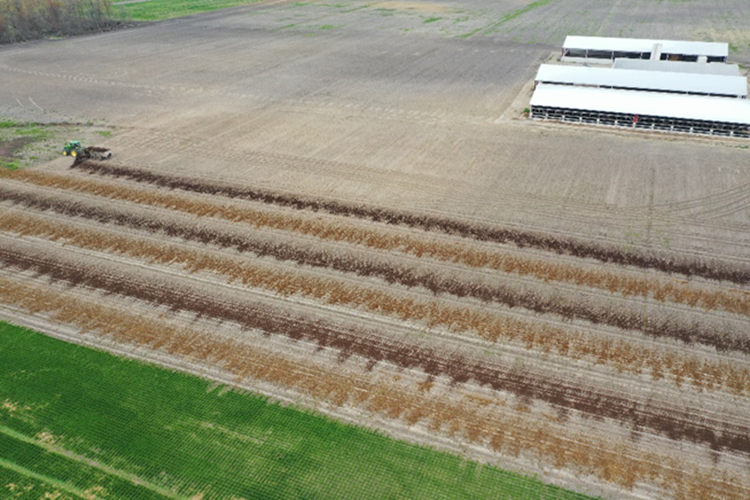
Figure 3. Land application of manure (light in color) and compost (dark in color) for replicated strip trials in corn.
What Have We Learned
This research began with an aggregated 258 tons of unprocessed (raw) pen pack cattle manure among 8 sites (windrows) and yielded 121 tons of finished compost, a 53% reduction in weight. However, the volume reduction was less significant than the reduced weight. The number of ‘trucks in’ versus ‘trucks out’ resulted in 28% reduction in volume. The average initial moisture of raw manure was 66% as compared the average final moisture of 48%.
Cooperators turned compost for a minimum of five weeks with some turning up to eight weeks. The average number of turns was seven weeks for each of the eight windrow sites.
The starting nutrient analysis of the manure on a per ton basis was 8 lbs total nitrogen (TKN), 8 lbs phosphorus (P), 14 lbs potassium (K), 1.5 lbs sulfur (S), and 4.5 lbs Calcium (Ca). The finished compost averaged 7.5 lbs TKN, 20 lbs P, 31 lbs K, 3 lbs S, and 12 lbs Ca per ton. Except for total nitrogen, nutrient density more than doubled for these key nutrients as a result of the composting process (Figure 4). It is assumed that nitrogen was consumed in the composting process resulting in increased organic matter and organic carbon.
Figure 4. Density of key nutrients doubled for phosphorus, potassium, sulfur and calcium from the start of composting to the finished product (n=8 sites)
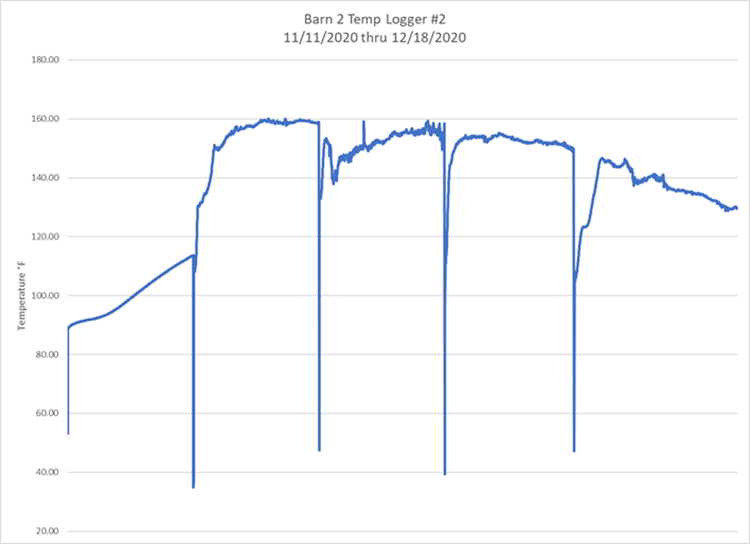
Temperatures were monitored weekly and temperature data indicated that only one windrow dropped below 100 degrees Fahrenheit during the 8-week process. This windrow was smaller than the others and the compost was happening in below freezing temperatures that occurred in the month of February 2021.
Figure 5. Buried temperature loggers monitored compost temperatures throughout the research. Temperature drops resulted when loggers were removed for compost turning and then replaced
Finally, three replicated field trials were conducted in field corn to compare full rates of manure versus half rates of compost (Tables 1, 2, 3). One more comprehensive trial included a university recommended fertilizer rate as well (Table 4). On average, the compost was hauled 4.5 miles from the livestock barn, thus giving some promise to improved transport of manure/compost to farther field locations. The results below are from one year of data at each respective site and should be interpreted as such.
Table 1: Site 1 – Corn for grain
Treatments
Harvest Moisture (%)
Yield (bu/acre)
10 tons/ac MANURE
17.5
252 a
5 tons/ac COMPOST
17.8
245 a
LSD: 11.5, CV 2.0
Table 2: Site 2 – Corn for grain
Treatments
Harvest Moisture (%)
Yield (bu/acre)
Check (no manure or compost)
18.0
258 a
6 tons/ac MANURE
17.9
259 a
3 tons/ac MANURE
18.1
258 a
LSD: 9.7, CV 2.1
Table 3: Site 3 – Corn for silage
Treatments
Harvest Moisture (%)
Yield (bu/acre)
10 tons/ac MANURE
57.8
23.8 a
5 tons/ac COMPOST
57.8
22.7 a
LSD: 1.7, CV 3.1
Table 4: Site 4 – Corn for grain
Treatments
Harvest Moisture (%)
Yield (bu/acre)
Fertilizer (22-52-120-12s/ac)
17.6
190 b
10 tons/ac MANURE
17.7
213 a
5 tons/ac MANURE
17.5
202 ab
LSD: 14.9, CV 4.3
Future Plans
Future plans include adding 4-5 more windrow sites before this 2023 grant expires. In 2022 and 2023, the hope is to compare static windrows versus those that are turned mechanically. In the first 8 sites, compost turning was based on time (weekly or bi-weekly turn). In the future, oxygen level or temperatures should be evaluated to help determine timing of turning. From a crop yield perspective, measuring soybean yields in the year following corn where the compost, manure or fertilizer was applied would be informative for growers as they make decisions about improving placement (transport) of manure or compost further from the livestock barn or to fields that have low soil test phosphorus or potassium. Finally, a complete economic analysis of the composting plus further transport needs to be conducted via a case study model.
Authors
Eric A. Richer, Assistant Professor and Extension Educator, Ohio State University Extension
richer.5@osu.edu
Additional Authors
-Jordan Beck, Water Quality Extension Associate, Ohio State University Extension
-Glen Arnold, Field Specialist, Manure Nutrient Management, Ohio State University Extension
This work is supported by a Great Lakes Sediment and Nutrient Reduction Program grant. Thanks to the five cooperating farmers who participated in this research study with Ohio State University Extension. Thanks to Stuckey Brothers Farms for use of compost turner and Redline Equipment for rental of Case IH 190 Magnum tractor.
The authors are solely responsible for the content of these proceedings. The technical information does not necessarily reflect the official position of the sponsoring agencies or institutions represented by planning committee members, and inclusion and distribution herein does not constitute an endorsement of views expressed by the same. Printed materials included herein are not refereed publications. Citations should appear as follows. EXAMPLE: Authors. 2022. Title of presentation. Waste to Worth. Oregon, OH. April 18-22, 2022. URL of this page. Accessed on: today’s date.
The purpose of this presentation is to provide a complete overview of ODA’s Division of Livestock Environmental Permitting (“ODA-DLEP”). ODA-DLEP regulates any livestock facility in Ohio that has the following number of animals or greater:
700 mature dairy cows
1,000 beef cattle or dairy heifers
2,500 swine weighing more than 55 pounds
10,000 swine weighing less than 55 pounds
82,000 layers
125,000 broilers or pullets
500 horses
55,000 turkeys
What Did We Do
Ohio Department of Agriculture’s Division of Livestock Environmental Permitting (“ODA-DLEP”) regulates the siting, construction, and operation of Ohio’s largest livestock facilities, referred to as Concentrated Animal Feeding Facilities (“CAFF”). ODA-DLEP’s primary objective is to minimize any water quality impacts, including both surface and ground waters, associated with the construction of new or expanding CAFFs, as well as implementation of best management practices once a CAFF becomes operational. These best management practices include management of manure, insect and rodent control, mortality management, and emergency response practices. ODA-DLEP issues Permits to Install (for construction) and Permits to Operate (for operations).
In addition, ODA-DLEP conducts routine inspections of each CAFF at least once a year, responds to complaints, and participates in emergency response. Inspections are conducted to review a CAFF’s compliance with Ohio Revised Code 903 and Ohio Administrative Code 901:10, the laws and regulations governing Concentrated Animal Feeding Facilities.
Finally, ODA-DLEP administers the Certified Livestock Manager program. Any individual in the State of Ohio that manages 4,500 dry tons of solid manure or 25 million gallons of liquid manure is required to be a Certified Livestock Manager (“CLM”).
What Have We Learned
Livestock operations continue to get larger and more concentrated and as a result, regulations are necessary to ensure proper handling and management of manure, particularly with land application of manure.
Future Plans
Over the past several years, DLEP has started to see more interest in manure treatment technologies. This could include, but is not limited to, anaerobic digestion, nutrient recovery, solids separation, and wastewater treatment. Technologies like this could greatly alter the landscape of the livestock industry by fundamentally changing the way manure is handled and how nutrients from manure are applied. DLEP does have regulations in place to account for manure treatment technologies. However, regulations, and specifically changes to regulations, cannot maintain the same pace as these technological advancements.
Authors
Samuel Mullins, Chief of ODA-Division Livestock Environmental Permitting
Samuel.mullins@agri.ohio.gov
The authors are solely responsible for the content of these proceedings. The technical information does not necessarily reflect the official position of the sponsoring agencies or institutions represented by planning committee members, and inclusion and distribution herein does not constitute an endorsement of views expressed by the same. Printed materials included herein are not refereed publications. Citations should appear as follows. EXAMPLE: Authors. 2022. Title of presentation. Waste to Worth. Oregon, OH. April 18-22, 2022. URL of this page. Accessed on: today’s date.
Rising chloride contamination in ground and surface waters is a growing concern in Minnesota. Previous studies estimate 87% of the chloride load originated from road salts, fertilizers, and wastewater treatments plants, and 6% from livestock manure. However, these estimates may be outdated as the livestock industry and manure application practices have evolved since these estimates of manure chloride concentrations were calculated in 2004. It also remains unclear how varying soil types affect the movement of chloride leaching following manure application. The aim of this study is to understand the movement of manure-based chloride from liquid and solid manures in Minnesota soils through a series of intact core leaching studies. Specifically, this project examines the magnitude of chloride leaching from swine and turkey manure application and compares it with synthetic potassium chloride fertilizer and a no nutrient control. The soil cores represent fine and medium textured soil.
What Did We Do?
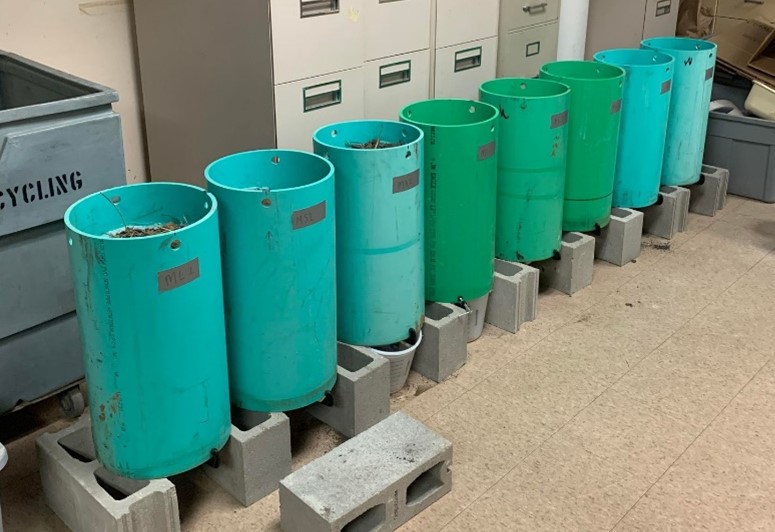
Collected 24 12-inch soil columns from medium and fine-textured soils in Minnesota (Figure 1).
Collected swine and turkey manure from Minnesota farms
Analyzed soil pre- and post-leaching study for nutrient analysis (Cl−, Bray P, NH4+, NO3−, K, Organic Matter, pH, and Exchangeable Ca, Mg, Na, K)
Analyzed manure samples for nutrient analysis pre-application (Total N, P2O5, K2O, Cl−)
Added water to cores until they reached field capacity
Applied manure using N-based application rates, and fertilizer using a K-based rate to 3 replicates
Simulated 2-in rainfall events on days 4, 12, and 18 post nutrient application
Collected and analyzed leachate for Cl−, NH4+-N, and NO3−-N
Figure 1: Setup of 12-inch PVC soil cores for leaching study
What Have We Learned?
How chloride concentration varies based on manure type and species
How the total amount of chloride applied via fertilizer application to cores varies by treatment
How manure-based chloride moves through soil
How fine and medium textured soil influences the movement of manure-based chloride
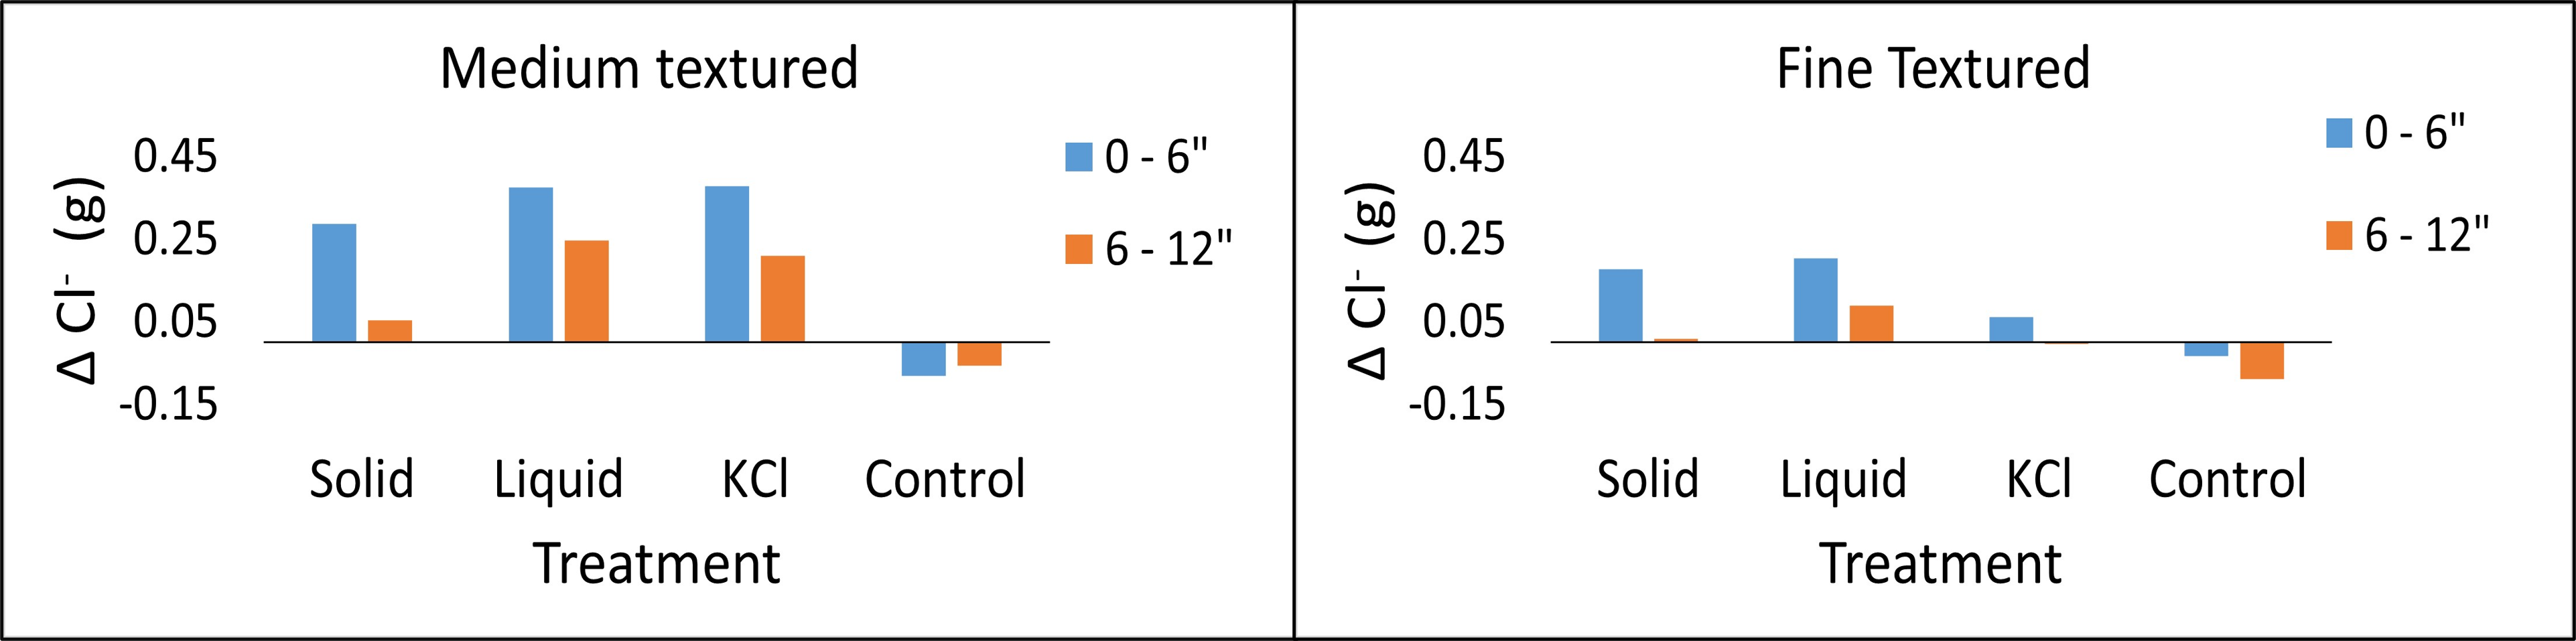
How chloride storage changed by soil type following the experiment (Figure 2)
Medium textured soils had a greater change in chloride storage in both top and bottom layers compared to fine textured soils
Manure additions increased chloride storage in both medium and fine textured soils
Control soil cores experienced a loss in chloride storage following leaching
Figure 2: Change in soil chloride storage in each medium textured (left) and fine textured (right) soils by treatment. Positive values indicate a net gain in soil chloride, while negative values indicate a net loss in soil chloride following leaching.
Table 1: Total Cl− concentration of liquid swine manure (lbs/1000 gallons), solid turkey litter, and synthetic KCl (lbs/ton) followed by total weight (g) of Cl− added per core via application.
Treatment
Cl− (lbs/1000 gallons)
Cl− (lbs/ton)
Cl− added per core (g)
Liquid
26
–
1.49
Solid
–
2.7
0.179
KCl
–
940
0.576
Control
–
0
0
Future Plans
Our group would like to complete a second round of this study the following year on newly identified liquid and solid manure and an additional coarse textured soil type. Future attempts in creating chloride-based mass balances for the state of Minnesota will benefit from this study.
Authors
Matthew Belanger, Graduate Research Assistant, Dept of Soil, Water, and Climate, University of Minnesota
This project is funded through the University of Minnesota Water Resource Center’s Watershed Innovation Grants Program. We’d also like to thank Scott Cortus, Eddie Alto, Todd Schumacher, Dr. Pedro Urriola, and Thor Sellie for their assistance.
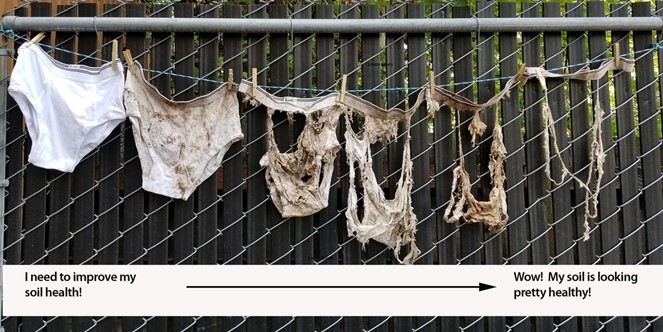
The use of livestock manure as a soil amendment to benefit soil health by improvements to soil physical, chemical, and biological properties, has been documented. However, quantification of the impact of improved soil health metrics on nutrient cycling has lagged. The soil your undies experiment has been implemented in the past to visually demonstrate microbial activity (Figure 1). However, this demonstration is seldom quantified, and does not have the capacity to statistically show that the effects of different management practices are distinct. The goal for this study was to quantify the degradation of fabric on a similar experiment, using cotton fabric on agricultural soils through photographic editing software. This study was designed to assess a visual method for quantifying carbon cycling in soil, observed through the degradation of buried organic materials.
Figure 1. Soil your undies soil health demonstration. Credit Clackamas Soil and Water Conservation District.
What Did We Do?
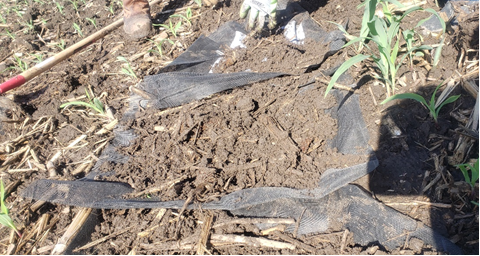
White, 100% cotton fabric cloths were cut into 29.21 × 29.84 cm (871.62 cm2) (11.5 x 11.75 in, 135 in2) pieces and placed flat inside a non-degradable mesh bag (48 cm × 48 cm, 18.9 in x 18.9 in). Sixty of the mesh bags were buried at 5 cm (2 in) depth in a field planted with corn in May of 2021 (Figure 2). The sixty bags were arranged in 12 plots to which one of three soil treatments (swine slurry, swine slurry + woodchips, and control plots with no amendments) with four replications per treatment were also applied. Swine slurry was applied at a rate of 39,687.06 L-ha-1 (4,242 gal-ac-1) and woody biomass was applied at a rate of 21.52 Mg-ha-1 (9.6 tons-ac-1).
Figure 2. Fabric and mesh bag burial in research plots
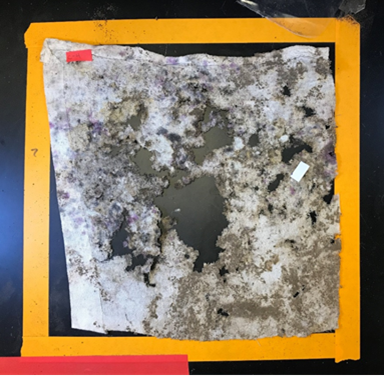
Five times during the growing season (25, 54, 81, 99 and 128 days after establishment), one bag was retrieved from each plot and returned to the lab for analysis. For each bag, soil was gently removed from the surface of the mesh and then the bag was cut open to observe the cotton fabric remaining. All the fabric pieces were photographed after retrieval. Photographs of the fabric were taken with an iPad mounted on a tripod. Fabric samples were photographed in a premeasured area of 29.21 × 29.84 cm (11.5 x 11.75 in) on a black surface (Figure 3).
Figure 3. Fabric sample placement inside pre-measured area (29.21 × 29.84 cm) for photographing
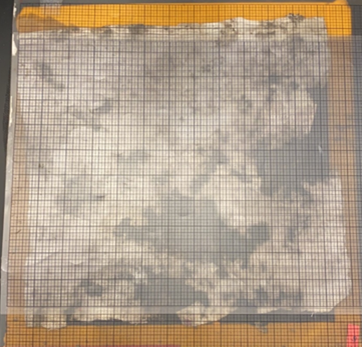
Manual evaluation of percent fabric degradation for each sample was performed by overlaying a clear plastic grid (Figure 4) with primary graduations (darker lines) of 2.54 cm (1 in) and secondary graduations (lighter lines) of 6.4 mm (0.25 in) on fabric samples and counting grid squares that were void of fabric.
Figure 4. Grid overlayed on fabric sample for manual evaluation of percent fabric degradation
Each photograph was assessed using Adobe Photoshop 2020 and the free license program ImageJ. Briefly, each image was opened in the respective program and the initial fabric area (871.62 cm2) (135 in2) was delineated in the program, based on the premeasured area included in the photo to set a scale for the degradation measurement. The image was converted to black and white, and brightness and contrast were adjusted as needed to remove glare on the black background that might be misread by the program as fabric. Then, all the pixels within a specific color range – which was previously defined as fabric – were selected using the native editing tools in the two programs and this area was compared to the pixels in the initial fabric area to determine the percentage of fabric remaining.
What Have We Learned?
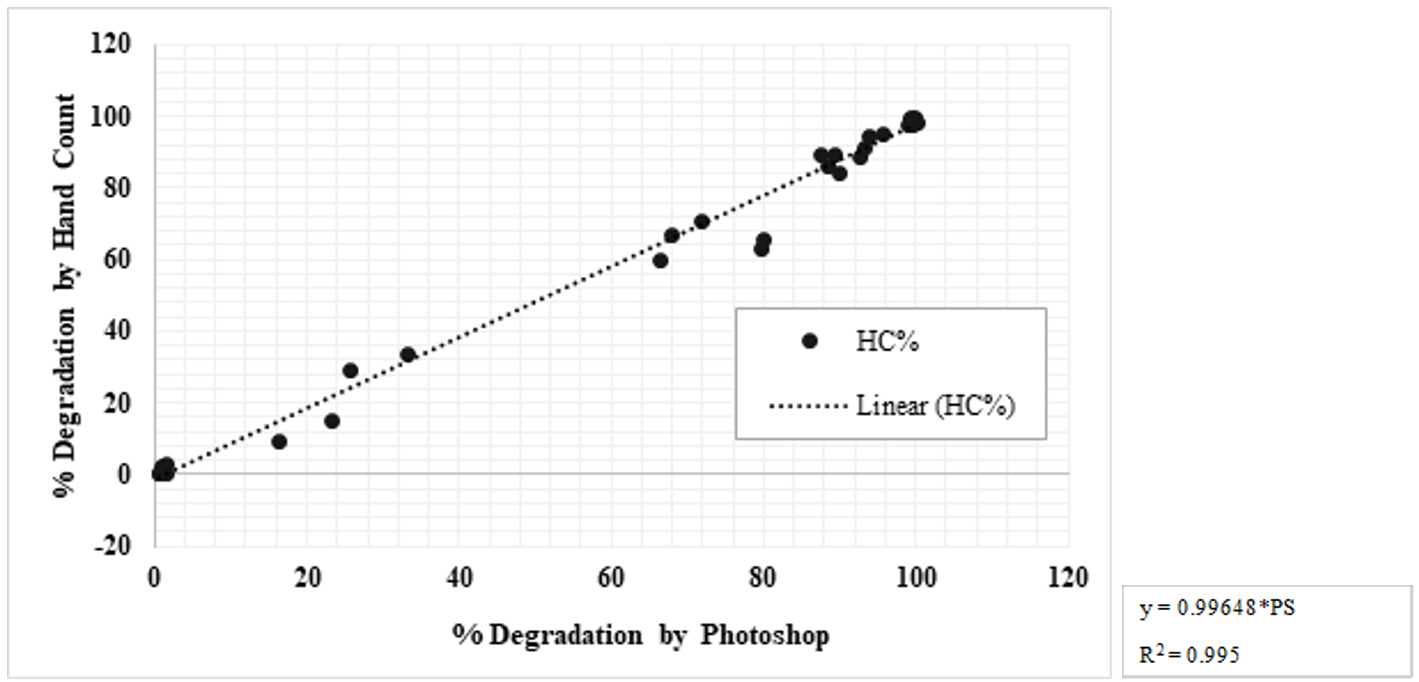
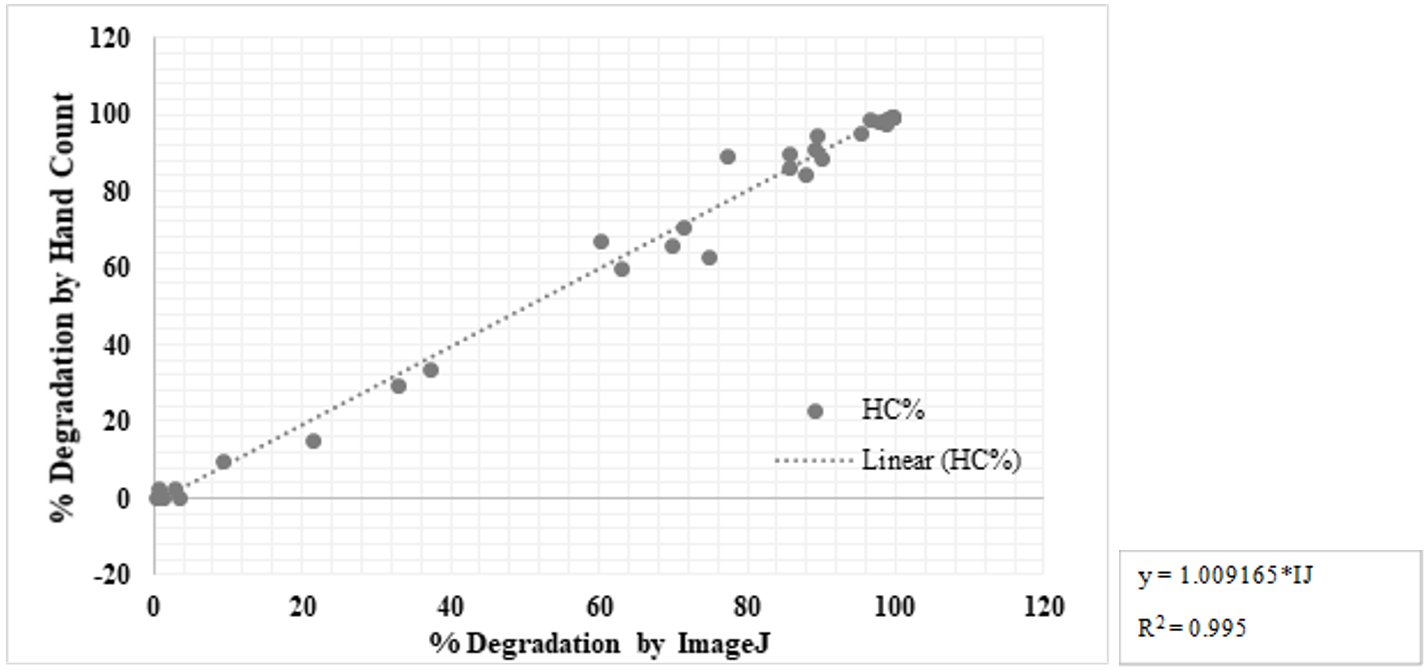
The three methods for estimating the area of the fabric did not show significant differences among each other, which means estimates of fabric degradation obtained with Photoshop and Image J accurately reflect manual hand counts, suggesting that these are reliable visual methods for determining the area of the remaining area of fabric (Figure 5, 6).
Figure 5. Linear regression model for degradation estimation via Photoshop relative to degradation value obtained by hand countFigure 6. Linear regression model for degradation estimation via ImageJ relative to degradation value obtained by hand count
Future Plans
Future work will seek to validate this method according to standard measures of soil health and biological activity and ensure that the method has enough sensitivity to demonstrate statistical differences between soil treatments. Future studies should also focus on making the process of area estimation with the software an easier, less laborious process. Creating a cellphone app to determine degradation quickly and without the need for a computer could increase the adoption of the fabric degradation assessment method in field settings.
Authors
Amy Schmidt, Associate Professor, University of Nebraska-Lincoln
Karla Melgar Velis, Graduate Research Assistant, University of Nebraska-Lincoln
Mara Zelt, Research Technologist, University of Nebraska-Lincoln
Andrew Ortiz Balsero, Undergraduate Research Assistant, University of Nebraska-Lincoln
Acknowledgements
Funding for this study was provided by the Nebraska Environmental Trust and Water for Food Global Institute at the University of Nebraska-Lincoln. Much gratitude is extended to collaborating members of the On-Farm Research Network, Nebraska Natural Resource Districts, Nebraska Extension Agents and Michael Hodges and family for providing the land, manure, and effort for this research project. Much appreciation to members of the Schmidt Lab who supported field and laboratory work: Juan Carlos Ramos Tanchez, Nancy Sibo, Andrew Lutt, Seth Caines and Jacob Stover.
Manure from beef feedlot productions can be managed through a diversity of strategies. When choosing from the possible scenarios the main factors influencing the decision are financial, logistical or from a regulatory fulfillment focus, however it is necessary to consider the environmental impact generated from the manure management system in order to generate less burdens on behalf of meat production. One of the most reliable methodologies for this matter is Life Cycle Assessment (LCA), which considers every input and output throughout the process and will calculate environmental emissions quantitatively. In this study we compared various LCA studies of beef lot manure management processes, with the aim of understanding the different systems´ hotspots and global emissions so that these can be considered when establishing a manure management system in similar facilities.
What Did We Do?
We gathered LCA studies published from peer-reviewed scientific journals that assessed the environmental impact of beef manure management. The search terms taken into account were “LCA and beef manure” and “LCA and feedlot manure”. To enable comparison between studies the following criterion were considered for inclusion: a) manure collected from intensive feedlot facilities b) results reporting at least global warming potential.
In order to categorize emissions generated from the entire manure life cycle we established four stages of manure management: Feedlot, transport, storage/transformation and use/disposal. Next, we identified which of these stages were taken into account in each study and if emissions were reported for stages individually as well as globally. Lastly, a comparison between LCAs was conducted for which we converted the functional units reported in the references to 1 ton of manure (dry basis). With this we can visualize the emissions generated from every ton of dry manure that enters the system despite the functionality to which it´s destined.
What Have We Learned?
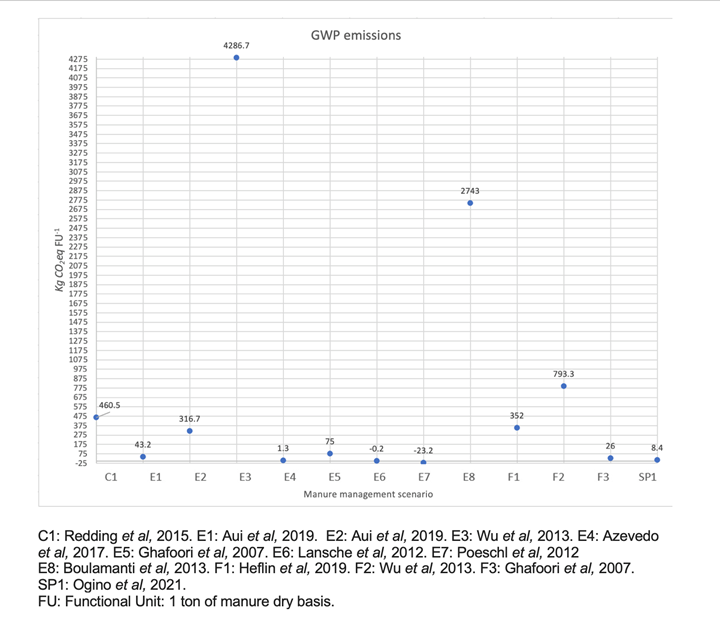
The final review included 14 references which resulted in 19 scenarios evaluated, ranging from 2007 to 2021. Initially we noted that the system with the greatest number of evaluations performed was the transformation of manure into an energetic resource (E), with 12 of the 19 scenarios being focused on energy generation through manure treatment processes, emphasizing that the current trends are not only leaning towards a better manure use but also cleaner energy sources. On the counter part, composting (C) and stockpiling (SP) are the two least evaluated scenarios through LCA (just once in the articles present in this review). Manure composting and stockpiling aren´t perceived as innovative solutions when aiming to mitigate emissions, but shouldn´t be left aside when performing evaluations, since they´re the most applied techniques for feedlot manure management.
The energetic evaluations represented both, the most (E3) and the least emissions (E7) through the whole process. This is because bioenergetic sources, such as the one generated from manure transformation, frequently are given environmental credits and therefore negative emission values considering the substitution of other energetic resources. In this review 10 of the 12 energetic scenarios considered emission reduction by substitution, but not because the actual process generated less amount of greenhouse gases in itself. Energy production from manure is, in many cases assessed as a life cycle for transformation and excluding other stages of the entire management system. In fact, apart from the kind of treatment only 21.4% of all the LCAs considered in this study included all four stages. Since two of them (Lansche et al, 2012; Van Stappen et al, 2016) mentioned that the best mitigation emission option was to reduce storage time, and one (Giwa et al, 2017) reported the largest emissions coming from transportation we can assume that both, storage and transport are important stages when looking at sources of emissions and should not be left aside.
The difference between emissions between different manure management systems can be as extreme as 4,000X depending on system boundaries, allocation procedures, emission factors, environmental credits, amongst others. When evaluating a manure management system, it is necessary to consider every stage and so that emission reduction can be addressed in the whole process hotspots and not only during the transformation of organic matter.
Future Plans
To conduct an attributional LCA of beef feedlot manure management system as a case study. With this we will contribute more data to contrast composting or stockpiling scenarios and address the weight of the different manure management in a feedlot facility. Also, we will report eutrophication potential and water depletion, as their importance in the environmental impacts of manure management is well known and should be considered when decisions are being made.
Authors
Andrea Wingartz, National Autonomous University of Mexico
Corresponding author email address
anwiot@gmail.com
Additional author
PhD. Rafael Olea Pérez, National Autonomous University of Mexico
Manage Cookie Consent
To provide the best experiences, we use technologies like cookies to store and/or access device information. Consenting to these technologies will allow us to process data such as browsing behavior or unique IDs on this site. Not consenting or withdrawing consent, may adversely affect certain features and functions.
Functional
Always active
The technical storage or access is strictly necessary for the legitimate purpose of enabling the use of a specific service explicitly requested by the subscriber or user, or for the sole purpose of carrying out the transmission of a communication over an electronic communications network.
Preferences
The technical storage or access is necessary for the legitimate purpose of storing preferences that are not requested by the subscriber or user.
Statistics
The technical storage or access that is used exclusively for statistical purposes.The technical storage or access that is used exclusively for anonymous statistical purposes. Without a subpoena, voluntary compliance on the part of your Internet Service Provider, or additional records from a third party, information stored or retrieved for this purpose alone cannot usually be used to identify you.
Marketing
The technical storage or access is required to create user profiles to send advertising, or to track the user on a website or across several websites for similar marketing purposes.

 Germination studies suggest small numbers of viable weed seeds, as only one seed germinated from unspiked samples. However, total weed counts suggest there can be high total seed numbers in the litters, with an average seed content of 1.17 seeds/100-g. Additionally, approximately 15% of the seeds collected were viable.