Oftentimes fall manure application is associated with significant offsite transport of nitrogen and phosphorus into nearby bodies of water and the atmosphere. Mechanisms of losses include leaching, runoff, sediment transport, and volatilization processes. This is becoming more common as there has been a trend of increased wet springs that create difficult planting conditions. This prolonged period without an active root system leaves more time for nutrient loss from fall-applied manure to occur.
A strategy to offset nutrient losses in the fall and early spring is to plant a cover crop. The uptake of nutrients during this time in the field, which would otherwise be left fallow, allows for nutrients to be stored in the tissue of the cover crops, minimizing nutrient loss risk. Upon terminating the cover crops, the decomposing residues can supply nutrients to the succeeding row-crop. However, cover crop adoption is low in the upper Midwest US stemming from a short cover crop growing season due to the cold climate. This is especially the case for crops utilizing manure. A strategy to expand the cover crop growing season may be to interseed a cover crop into a maturing row-crop prior to harvest. Previous studies investigating the integration of manure and cover crops have seeded the cover crop after manure application. We wanted to measure the impacts of first planting a cover crop then applying manure once the cover crop has had ample time to get established. This may help expand the cover crop growing season and potentially limit the offsite transfer of pollutants to our water and air.
What Did We Do?
A small plot study was started in fall 2019 at the University of Minnesota West Central Research and Outreach Center near Morris, MN. We tested the effect of nitrogen source and cover crops on soil health, nutrient cycling, and agronomic responses using a randomized complete block design with split plots.
Cover crop mixtures of cereal rye and annual ryegrass were interseeded near corn’s fifth leaf collar (V5) growth stage, physiological maturity (R5 to R6 growth stage), or drilled after corn harvest. Dairy manure was sweep-injected to minimize soil disturbance in early and late fall, when soil temperatures were above and below 10°C (50°F), respectively. Non-manured plots received urea in the spring prior to corn planting. Urea applied plots (no manure) with no cover crops served as the control. Soil samples were taken throughout the cover crop and row-crop growing season from the 0-15, 15-30, and 30-60 cm (0-6, 6-12, and 12-24 in) soil layers. Cover crop biomass samples were taken in the late fall prior to the first frost event and prior to cover crop termination in the spring.
What Have We Learned?
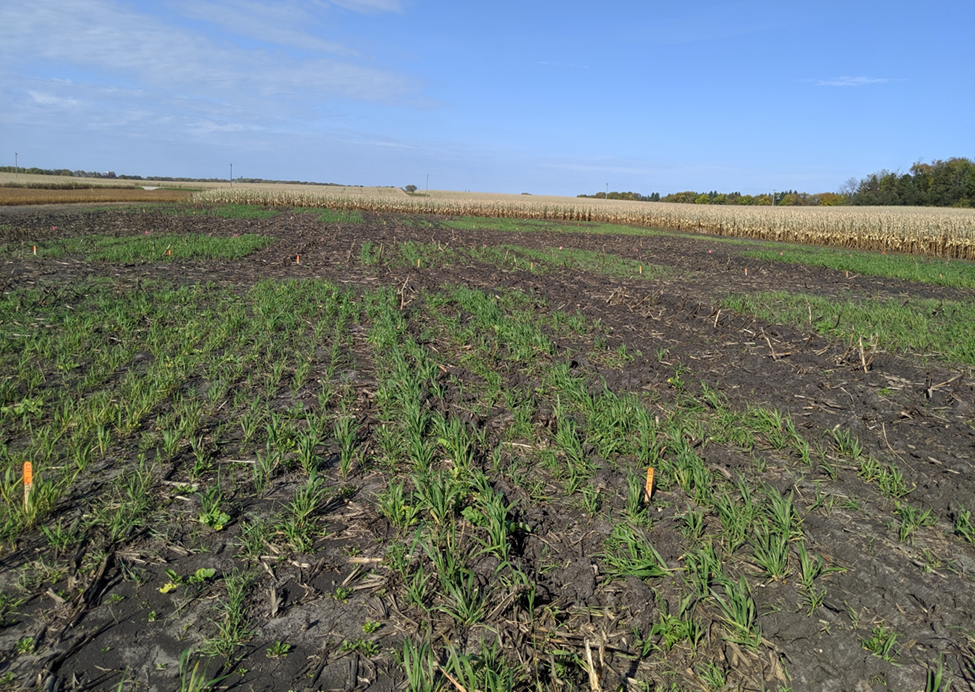
Sweep injection is a reliable method to apply liquid manure to a field with an established stand of cover crops with minimal noticeable damage to the cover crops in the spring (Figure 1). Planting cover crops as soon as possible ensures more biomass is produced; planting after harvest consistently had lower cover crop yield than interseeding. Spring cover crop yield, right before termination, was highest when planted near physiological maturity [110 kg ha-1 (98 lb ac-1)] compared to drilling after harvest [87 kg ha-1 (78 lb ac-1)]. Nutrient source had a significant effect on silage yield. Manure, either applied in the early or late fall, had greater silage yield [58.5 and 58.7 Mg ha-1 (26.1 and 26.2 ton ac-1), respectively] than spring applied urea [53.6 Mg ha-1 (23.9 ton ac-1)]. Plots with cover crops interseeded at V5 had greater silage yield [59.5 Mg ha-1 (26.5 ton ac-1)] than all other treatments [54-56 Mg ha-1 (24-25 ton ac-1)] except no cover crops [57.8 Mg ha-1 (25.8 ton ac-1)].
Figure 1. Cover crops planted prior to late manure application. Photo was taken in the spring at cover crop termination.
Future Plans
Soil samples collected throughout the study are currently being analyzed for nutrient content and other soil health parameters. Results from this study will be used to develop best management practices for integrating cover crops and liquid injected manure in the upper Midwest.
Authors
Manuel J. Sabbagh, Graduate Research Fellow, University of Minnesota
Corresponding author email address
sabba018@umn.edu
Additional authors
Melissa L. Wilson, Assistant Professor, University of Minnesota; Paulo H. Pagliari, Associate Professor, University of Minnesota
This work is supported by the Conservation Innovation Grants program at the Natural Resources Conservation Service of the USDA, the Minnesota Corn Research and Promotion Council, and the Foundation for Food and Agriculture Research.
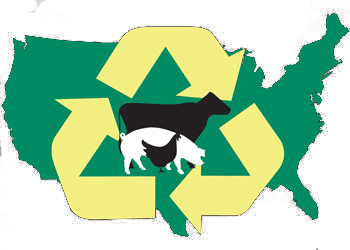
This Sustainable Agriculture Systems project is called “Idaho Sustainable Agriculture Initiative for Dairy (ISAID).” Its main purpose is to create a bioeconomy around dairy manure and its byproducts, generating a circular use and economy of nutrients (Figure 1). Idaho is currently the third largest milk-producing state in the USA (USDA-NASS, 2021). Idaho dairy farms typically operate as confined operations that concentrate a significant amount of manure and nutrients in relatively small areas. Over the years, this situation has increased the concentration of nutrients in farms surrounding dairies. Meanwhile, distant farms may not benefit from using those nutrients (Leytem, et al. 2021). Except for its exceptional fertilizer and soil amendment value (USEPA, 2015), dairy manure is seen as a nuisance that needs to be managed well. Manure handling and use generate expenses for the producers and may be a nuisance for the neighboring communities and a potential environmental risk for the areas surrounding dairy production (Berg, et al. 2017; Moore and Ippolito, 2009; Sheffield, et al. 2008). This multidisciplinary project aims to create bioproducts from manure to significantly change the nutrient balance and the economic impact for producers in the region. Implementing the various strategies included in the project will help export nutrients to in-need areas within the region or outside the watershed altogether. In addition, increased income from manure processing would allow for better management and reduction of overall costs associated with nutrient management in the region. The ISAID project includes three main areas that are integrated to generate the highest impact possible. Research, Extension, and Education are the distinctive areas of work. Still, these areas don’t work as silos, having a lot of integration to get the most of everybody’s work in the project.
What Did We Do?
Figure 1. Dairy bioeconomy
A group of 25 researchers in diverse areas of expertise obtained a USDA-NIFA Sustainable Agricultural Systems grant to conduct long-term (five years or more) projects. On the research side, the multifaceted studies that are under development include: use of amendments in manure composting to increase compost quality and value, reducing air emissions; nutrients’ extraction from various fractions of manure treatment to concentrate specific nutrients for individual commercialization (including nitrogen, phosphorous, and carbon); generation of hydrochar and biochar from dairy manure; bio-plastics production; cover crops use to increase nutrient extraction and soil health; fine-tuning fertilizer guides for crops using manure, compost, and other bioproducts. Analysis of each product’s economic and social impact separately and as a multi-prong approach. The extension component includes outreach to livestock and crop producers, local authorities, and communities to communicate the applicability of researched technologies and techniques, their impacts, benefits and challenges. The development of programs to train producers, allied industry, their workforce government employees on the diverse applications resulting from the project. The education component includes the participation of graduate and undergraduate students in all facets of the project and the development of educational programs for undergraduate and graduate students on topics associated with manure and nutrient management, bioeconomy, and on-farm application and management of these technologies and techniques.
What Have We Learned?
This project just finished the first of its five years; most of the projects are in the inception phase. We are generating baseline data and linking together diverse processes to determine possible interactions and needed extension and instructional needs. The corresponding poster includes a detailed list of projects associated with the grant, their corresponding principal investigators, and any recent advances. Some examples of project outcomes include the Water Machine that extracts phosphorous from waters with high nutrient content. Ammonia extraction from dairy wastewater. Enhanced composting using zeolites, pumice, biochar, and balanced carbon. Cover crops and corn silage as dual and double cropping. Hydrochar production from dairy manure and bioplastics. We are working on obtaining stakeholders’ input through diverse methods to help assess the needs of the industry and communities and guide the evolution of the research, extension, and education processes.
Future Plans
The project will continue to gather data and evolve. Collaborations and graduate student inquiries about inclusion in some projects are welcomed. We will offer updates at various conferences, including the next Waste to Worth.
Authors
Mario E. de Haro Martí, Extension Educator, University of Idaho Extension, Central District
Leytem, A. B., Williams, P., Zuidema, S., Martinez, A., Chong, Y. L., Vincent, A., Vincent, A., et al. 2021. Cycling Phosphorus and Nitrogen through Cropping Systems in an Intensive Dairy Production Region. Agronomy, 11(5), 1005. MDPI AG. http://dx.doi.org/10.3390/agronomy11051005
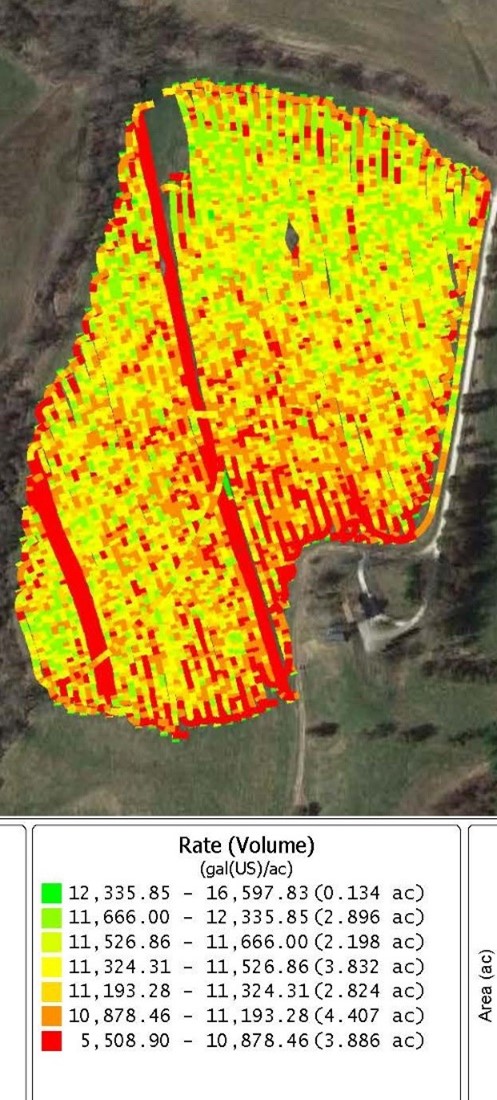
Manure, fertilizer, and other commercially available precision ag maps are not accurately calculating application rates in turns and turnarounds. This is significant in turn areas, such as field borders or in small fields. In areas where equipment turns or reverses with a k-turn, more product is applied to the inside turn than the outside turn, resulting in more time and application, and significantly changing the application rates in the turn area. The current version of software supplied with GPS equipment UConn Extension purchased in 2020 does not sum material application rates vertically when overlap occurs. The software also does not adjust application rates on the inside and outside of turns to reflect the change in application area covered during a discrete-time interval. The photo on the left is an example of an as-applied map from the commercial software. The line drawing on the right in the callout box displays the order of the tractor’s movement during the application. The lines represent the path of the tractor using a dragline to apply manure as it performs a K-turn at the end of the pull. The lines are formed by connecting the GPS coordinates recorded each second. The red line represents the tractor traveling North until it reached the end of the pass. The green line represents the travel path as the tractor backs up to make the K turn. The blue line is the path of the tractor as it again travels forward to complete the turn and head South again. The blue and green lines do not connect because a tractor backed up to some point northeast of the end of the green line, stopped and resumed moving forward again, all during the one-second interval between the ends of the green and blue lines.
The graphic below is the complete map for the field in the example above. If you look closely, you will see a large number of overlaps where a yellow or orange color passes over a darker red color. This should result in the overlapped region changing to one of the green colors if the rates were being summed vertically by the software.
What Did We Do?
When we realized the maps created by the software were inaccurately representing the results, we began by contacting the company’s tech support center. After exchanging emails and several phone conversations with different individuals, the company indicated that their software was unable to calculate the values we needed. Since the software we had purchased didn’t do what we needed we started asking around to all of the commercial applicators of manure and fertilizer that we knew in the region to see if the software they used provided the functionality we needed in New England. We could find no commercial software package that included the calculations needed to allocate the material correctly in our small fields.
Finding no commercially available software we embarked on what turned out to be a long and arduous process to develop a methodology to create adequate spreading maps ourselves. As faculty members, we have access to ESRI ArcMap which we have used for years to generate field boundary maps, calculate hauling distances between fields and storages, and map farmstead layouts for projects. We incorrectly assumed that ArcMap would have a ready-made solution for our problem. The process wasn’t as simple as playing connect the dots of the GPS coordinates. The GPS antennas on farm equipment are usually located on the cab of the truck or tractor to protect the antenna and in the case of the tractors to make the GPS available to other pieces of equipment such as planters. The material being applied usually comes out of the back, or side of the spreader some distance from the antenna. Then most application equipment throws the material even further behind the equipment with spinning disks or through pressure pumps, adding even more distance between the antenna and where the material actually hits the ground. To determine these distances accurately we measured numerous pieces of equipment and took a series of measurements between the equipment itself and where the material lands. In the case of manure spreaders, this can be a messy proposition. Once these measurements were completed, it was back to the computer to try to put these on a map. After hand digitizing a couple of hundred data points by drawing reference lines and using measuring tools in ArcMap to generate new points representing the distances behind and to the left and right of the equipment centerline, we finally had polygons to work with. Since we knew the amount of material applied each second, and ArcMap has the necessary tools to calculate the areas of the individual polygons, we could now divide the weight by the area to provide a weight or gallons per square foot of application area. ArcMap also has the tools needed to calculate the cumulative applied material for the overlapped areas by summing vertically through the polygons and summing the rate per square foot value of each layer.
Turns present a different challenge, but the turns cause extreme differences in application rates, so accurate maps require calculating the different application rates on the inside versus the outside of turns. The drawing above illustrates the path of a spreader, in this case a dragline moving North on the right side of the figure, making a 180 degree turn at the end of the row, and heading back south. The numbers in the section of the curve on the upper right reflect the application rates per acre for a fictional piece of equipment with the following characteristics. The descriptive data is real, but it comes from multiple equipment companies. For this example, we used a dragline toolbar that is 60 feet wide with the left and right halves represented by the three arrows on the lines pointing north and south. The dragline has 16 injectors and is fed by a pump capacity of 5,500 gallons per minute. We spent some time watching videos of spreaders at equipment company websites and timing, with a stopwatch, different spreaders as they made turns. This example uses 13 seconds for the toolbar, to make a 180-degree turn. A 5,500 gallon per minute pump pumps 91.7 gallons per second, or a total of 1192 gallons as the vehicle turns around. We divide 1192 in half to separate the left and right sides of the toolbar and you have 596 gallons applied inside and outside the centerline during the turn. Now we need to turn our attention to the area that was covered. The area of a circle is given by the formula Pi times the square of the radius. The area of the 180-degree turn for the inside of a 60-foot toolbar is given by the formula (3.141593 X (30X30))/2 or 1,414 square feet. Using the same formula, the area of the larger 60-foot radius is 5655. To get the actual area covered by the outside half of the toolbar we need to subtract the area of the 30-foot radius half-circle from the 60-foot radius half circle which comes out to 5,655-1,414 = 4,241. Now that we have the areas, we can divide the left and right areas into gallons.
596/1,414 = 0.421 to convert that to gallons per acre multiply by 43,560 = 18,339
596/4,241 = 0.141 X 43,560 = 6,142 or almost exactly 1/3 the amount per acre applied to the inside of the curve.
Given the spreading patterns of modern farm equipment and farmers wanting to ensure complete coverage in a field, overlaps are inevitable. If we are really going to follow the 4R’s of nutrient management, we need better as applied maps that will allow us to know where the manure went, and better more agile fertilizing equipment to only apply fertilizer in the areas of fields that truly need the fertilizer – now that we can identify them on accurate maps. This includes the ability of equipment to lower flow rates on the inside of turns and increase the flow rates on the outside of turns automatically to provide more even spreading rates across the entire field.
What Have We Learned?
Current spreading maps are inadequate for small New England farms. Application overlaps and spreading differentials on the inside and outside of turns result in inaccurate application rates. Current equipment does not account for these differing rates along the turn radii. We have worked out an algorithm and a process to correct for both the turn issue and the overlap issue for straight application such as self-propelled spreaders or toolbars attached to the 3-point hitch of a tractor. The algorithm still needs to be adjusted to connect the polygons representing turns with curved lines rather than the straight lines we currently use. This will improve accuracy incrementally, albeit measurably, since the turn radiuses and the distances involved will only add or remove a few square feet from each polygon which in our hand calculation doesn’t affect the rate per acre more than a few hundred gallons at a time. We understand the math involved to calculate accurate spreading locations and areas for towed equipment if we have adequate measurements of that equipment and with the caveat that the spreader being towed is always moving forward. In certain cases, such as semi-tractor trailers it is possible for the truck cab, with the GPS attached, to be moving in a circular path – while the rear bogey of the trailer spins in place – which can cause the rear wheels on the trailer to back up during a tight turn. We haven’t worked out the math on this, and so far, we have found no practical way to calculate this given the state of the equipment. For semi-trailers we would recommend that GPS antennas be mounted at the front and the rear of the trailers. We need two points to determine the straight line between the points so we can calculate the left and right application distances for where the material hits the ground.
The as-applied map on the next page shows how the current version of our software creates a much more accurate application map from GPS data. This is the same section of the field shown in the first graphic from the commercial software. As you can see our solution calculates the areas of overlap and sums the application rates vertically through the layers. If you look closely at the figure, you will see 3-digit numbers representing the calculated positions of the Left, Right, and Center XY coordinates of the points where the material is hitting the ground each second. The single-digit numbers reflect the number of times that an individual polygon was applied with manure during the turn maneuver.
<7,500
7,500 – 12,500
12,500 – 25,000
25,000 – 100,000
>100,000
gal/ac
880
2060
6600
2211
1427
ft2
7
16
50
17
11
percent
13,177
Sum ft2 Applied
2350
Total ft2
The table above is calculated using the application rates and the areas of the polygons in the as-applied map. It basically provides a report card of the application. The farm intended to apply 10,000 gallons per acre to meet the fertilizer needs of the crop. We placed an arbitrary interval of 2,500 gallons above or below the target rate as an acceptable variation in the application rate. This allowed us to calculate that ~15.6% of the area applied received the “correct” rate. Approximately 6.7% of the area received too little manure and 77.7% of the area received too much manure. In addition, we calculated that the small area on the inside of the turn that received the most manure per acre received 103,383 gallons per acre, rather than the desired 10,000 gallons per acre.
Future Plans
This year we plan to validate our algorithms for the self-propelled and the farm tractor 3-point hitch mounted spreaders. We hope to expand the algorithm to tractor towed combinations when we receive data from 2 more farms that installed equipment this winter on their equipment. We will validate our algorithm’s accuracy by applying manure to fields that have had collection pans pre-located throughout the field. Once we have the spreading map, we can overlay it onto the data from the collection pans that we will geolocate with handheld RTK GPS equipment before applying the manure. We would also like to rent a pair of RTK GPS loggers to mount on the front and the rear of a semi tanker to verify the movement of the trailer during extreme turns.
Hopefully, we can develop a mathematical model for the semi turns because the alternative – putting 2 farm equipment type GPS antennas on a trailer, will get expensive.
Authors
Richard A. Meinert, Cooperative Extension Educator, University of Connecticut
Corresponding author email address
Richard.Meinert@uconn.edu
Additional author
Qian Lei-Parent, Research Associate, Department of Extension, University of Connecticut
Acknowledgements
Funding to purchase the GPS equipment provided by a USDA NRCS CT CIG Grant.
In this webinar, presenters share their expertise in sampling and cleanout for lagoons and anaerobic digesters and considerations in planning these operations. This presentation was originally broadcast on January 21, 2022. Continue reading “Cleanout for Lagoons and Anaerobic Digesters”
This webinar focuses on how we can manage our manure application better tominimize compaction effectsand maximize manure’s capability to help combat compaction. This presentation was originally broadcast on December 17, 2021. Continue reading “The Interplay Between Manure and Compaction”
In this webinar, we discuss the manureshed vision, the geographic barriers to manureshed recycling, the social networks underlying manureshed management at multiple scales, and provide examples of industry-specific manureshed solutions. This presentation was originally broadcast on May 21, 2021. Continue reading “Manuresheds: Advancing nutrient recycling in US agriculture”
This webinar explores where, how, and when it makes sense to merge manure digesters with natural gas pipelines. The webinar shares national, project specific and farm-level perspectives. This presentation was originally broadcast on April 16, 2021. Continue reading “Coupling Manure Digesters with Renewable Natural Gas Systems”
Manage Cookie Consent
To provide the best experiences, we use technologies like cookies to store and/or access device information. Consenting to these technologies will allow us to process data such as browsing behavior or unique IDs on this site. Not consenting or withdrawing consent, may adversely affect certain features and functions.
Functional
Always active
The technical storage or access is strictly necessary for the legitimate purpose of enabling the use of a specific service explicitly requested by the subscriber or user, or for the sole purpose of carrying out the transmission of a communication over an electronic communications network.
Preferences
The technical storage or access is necessary for the legitimate purpose of storing preferences that are not requested by the subscriber or user.
Statistics
The technical storage or access that is used exclusively for statistical purposes.The technical storage or access that is used exclusively for anonymous statistical purposes. Without a subpoena, voluntary compliance on the part of your Internet Service Provider, or additional records from a third party, information stored or retrieved for this purpose alone cannot usually be used to identify you.
Marketing
The technical storage or access is required to create user profiles to send advertising, or to track the user on a website or across several websites for similar marketing purposes.

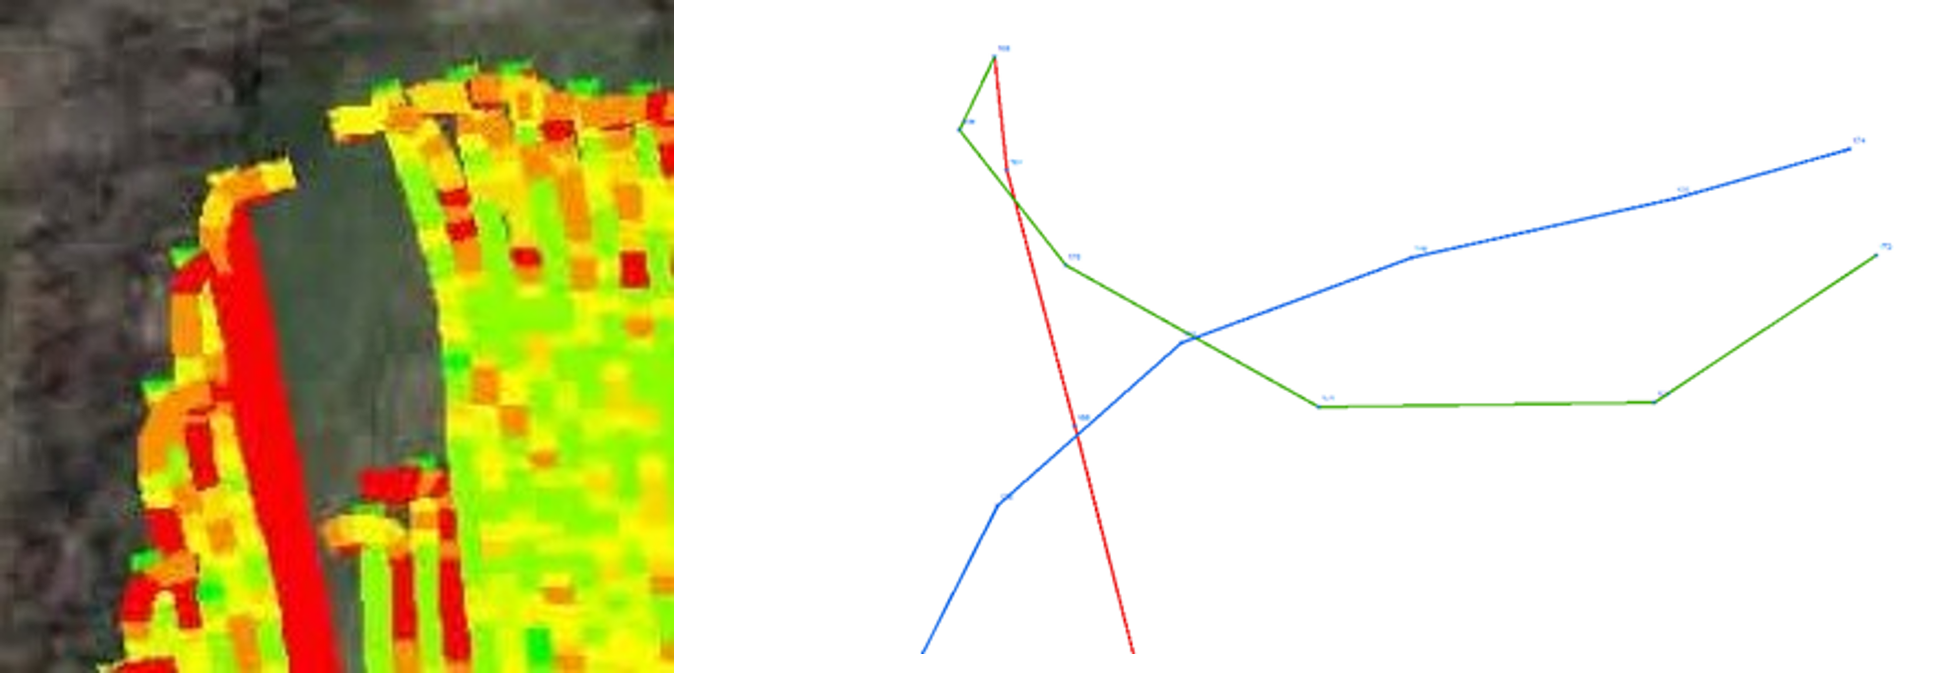 movement during the application. The lines represent the path of the tractor using a dragline to apply manure as it performs a K-turn at the end of the pull. The lines are formed by connecting the GPS coordinates recorded each second. The red line represents the tractor traveling North until it reached the end of the pass. The green line represents the travel path as the tractor backs up to make the K turn. The blue line is the path of the tractor as it again travels forward to complete the turn and head South again. The blue and green lines do not connect because a tractor backed up to some point northeast of the end of the green line, stopped and resumed moving forward again, all during the one-second interval between the ends of the green and blue lines.
 North on the right side of the figure, making a 180 degree turn at the end of the row, and heading back south. The numbers in the section of the curve on the upper right reflect the application rates per acre for a fictional piece of equipment with the following characteristics. The descriptive data is real, but it comes from multiple equipment companies. For this example, we used a dragline toolbar that is 60 feet wide with the left and right halves represented by the three arrows on the lines pointing north and south. The dragline has 16 injectors and is fed by a pump capacity of 5,500 gallons per minute. We spent some time watching videos of spreaders at equipment company websites and timing, with a stopwatch, different spreaders as they made turns. This example uses 13 seconds for the toolbar, to make a 180-degree turn. A 5,500 gallon per minute pump pumps 91.7 gallons per second, or a total of 1192 gallons as the vehicle turns around. We divide 1192 in half to separate the left and right sides of the toolbar and you have 596 gallons applied inside and outside the centerline during the turn. Now we need to turn our attention to the area that was covered. The area of a circle is given by the formula Pi times the square of the radius. The area of the 180-degree turn for the inside of a 60-foot toolbar is given by the formula (3.141593 X (30X30))/2 or 1,414 square feet. Using the same formula, the area of the larger 60-foot radius is 5655. To get the actual area covered by the outside half of the toolbar we need to subtract the area of the 30-foot radius half-circle from the 60-foot radius half circle which comes out to 5,655-1,414 = 4,241. Now that we have the areas, we can divide the left and right areas into gallons.
