The purpose of this research was to identify trade-offs among soil erosion, soil health, and crop production when using cover crops with manure application.Continuous corn silage cropping systems in Wisconsin leads to overall removal of N from the system unless manure is applied. However, this cropping system allows for the planting of cover crops or a winter silage crop post harvest, which may lead to increases in soil N over time. Cover crops are valuable in these corn-silage based rotations as they also provide ground cover after harvest and can reduce N leaching after fall manure application.
What did we do?
The cropping system investigated was a continuous corn silage system with fall manure application. The experiment was a randomized complete block split-plot design where the whole plot treatments were no cover, rye as a cover (chemically terminated) or as a forage (harvested) crop and the split plot treatment was depth.The objective of this study was to determine the effect of cover cropping on potentially mineralizable nitrogen (PMN) over a growing season using a 7-day anaerobic incubation (2015 and 2016 season), a long-term aerobic incubation (2015 season), and N uptake by corn.
What have we learned?
There were no statistical differences in short-term PMN among cover crop treatments at any time point in 2015 or 2016. However, the cover crop treatments led to a yield reduction compared to no cover crop use in both years. Thus, our study showed significant effects of cover cropping on agronomic factors like corn yield and N uptake but these same differences were not measurable in the soil N.
Future Plans
This work will continue to evaluate the long-term effects of cover crop use on soil health.
This material is based upon work that is supported by the National Institute of Food and Agriculture, U.S. Department of Agriculture, under award number 2013-68002-20525. Any opinions, findings, conclusions or recommendations expressed in this publication are those of the author(s) and do not necessarily reflect the view of the U.S. Department of Agriculture.
The authors are solely responsible for the content of these proceedings. The technical information does not necessarily reflect the official position of the sponsoring agencies or institutions represented by planning committee members, and inclusion and distribution herein does not constitute an endorsement of views expressed by the same. Printed materials included herein are not refereed publications. Citations should appear as follows. EXAMPLE: Authors. 2017. Title of presentation. Waste to Worth: Spreading Science and Solutions. Cary, NC. April 18-21, 2017. URL of this page. Accessed on: today’s date.
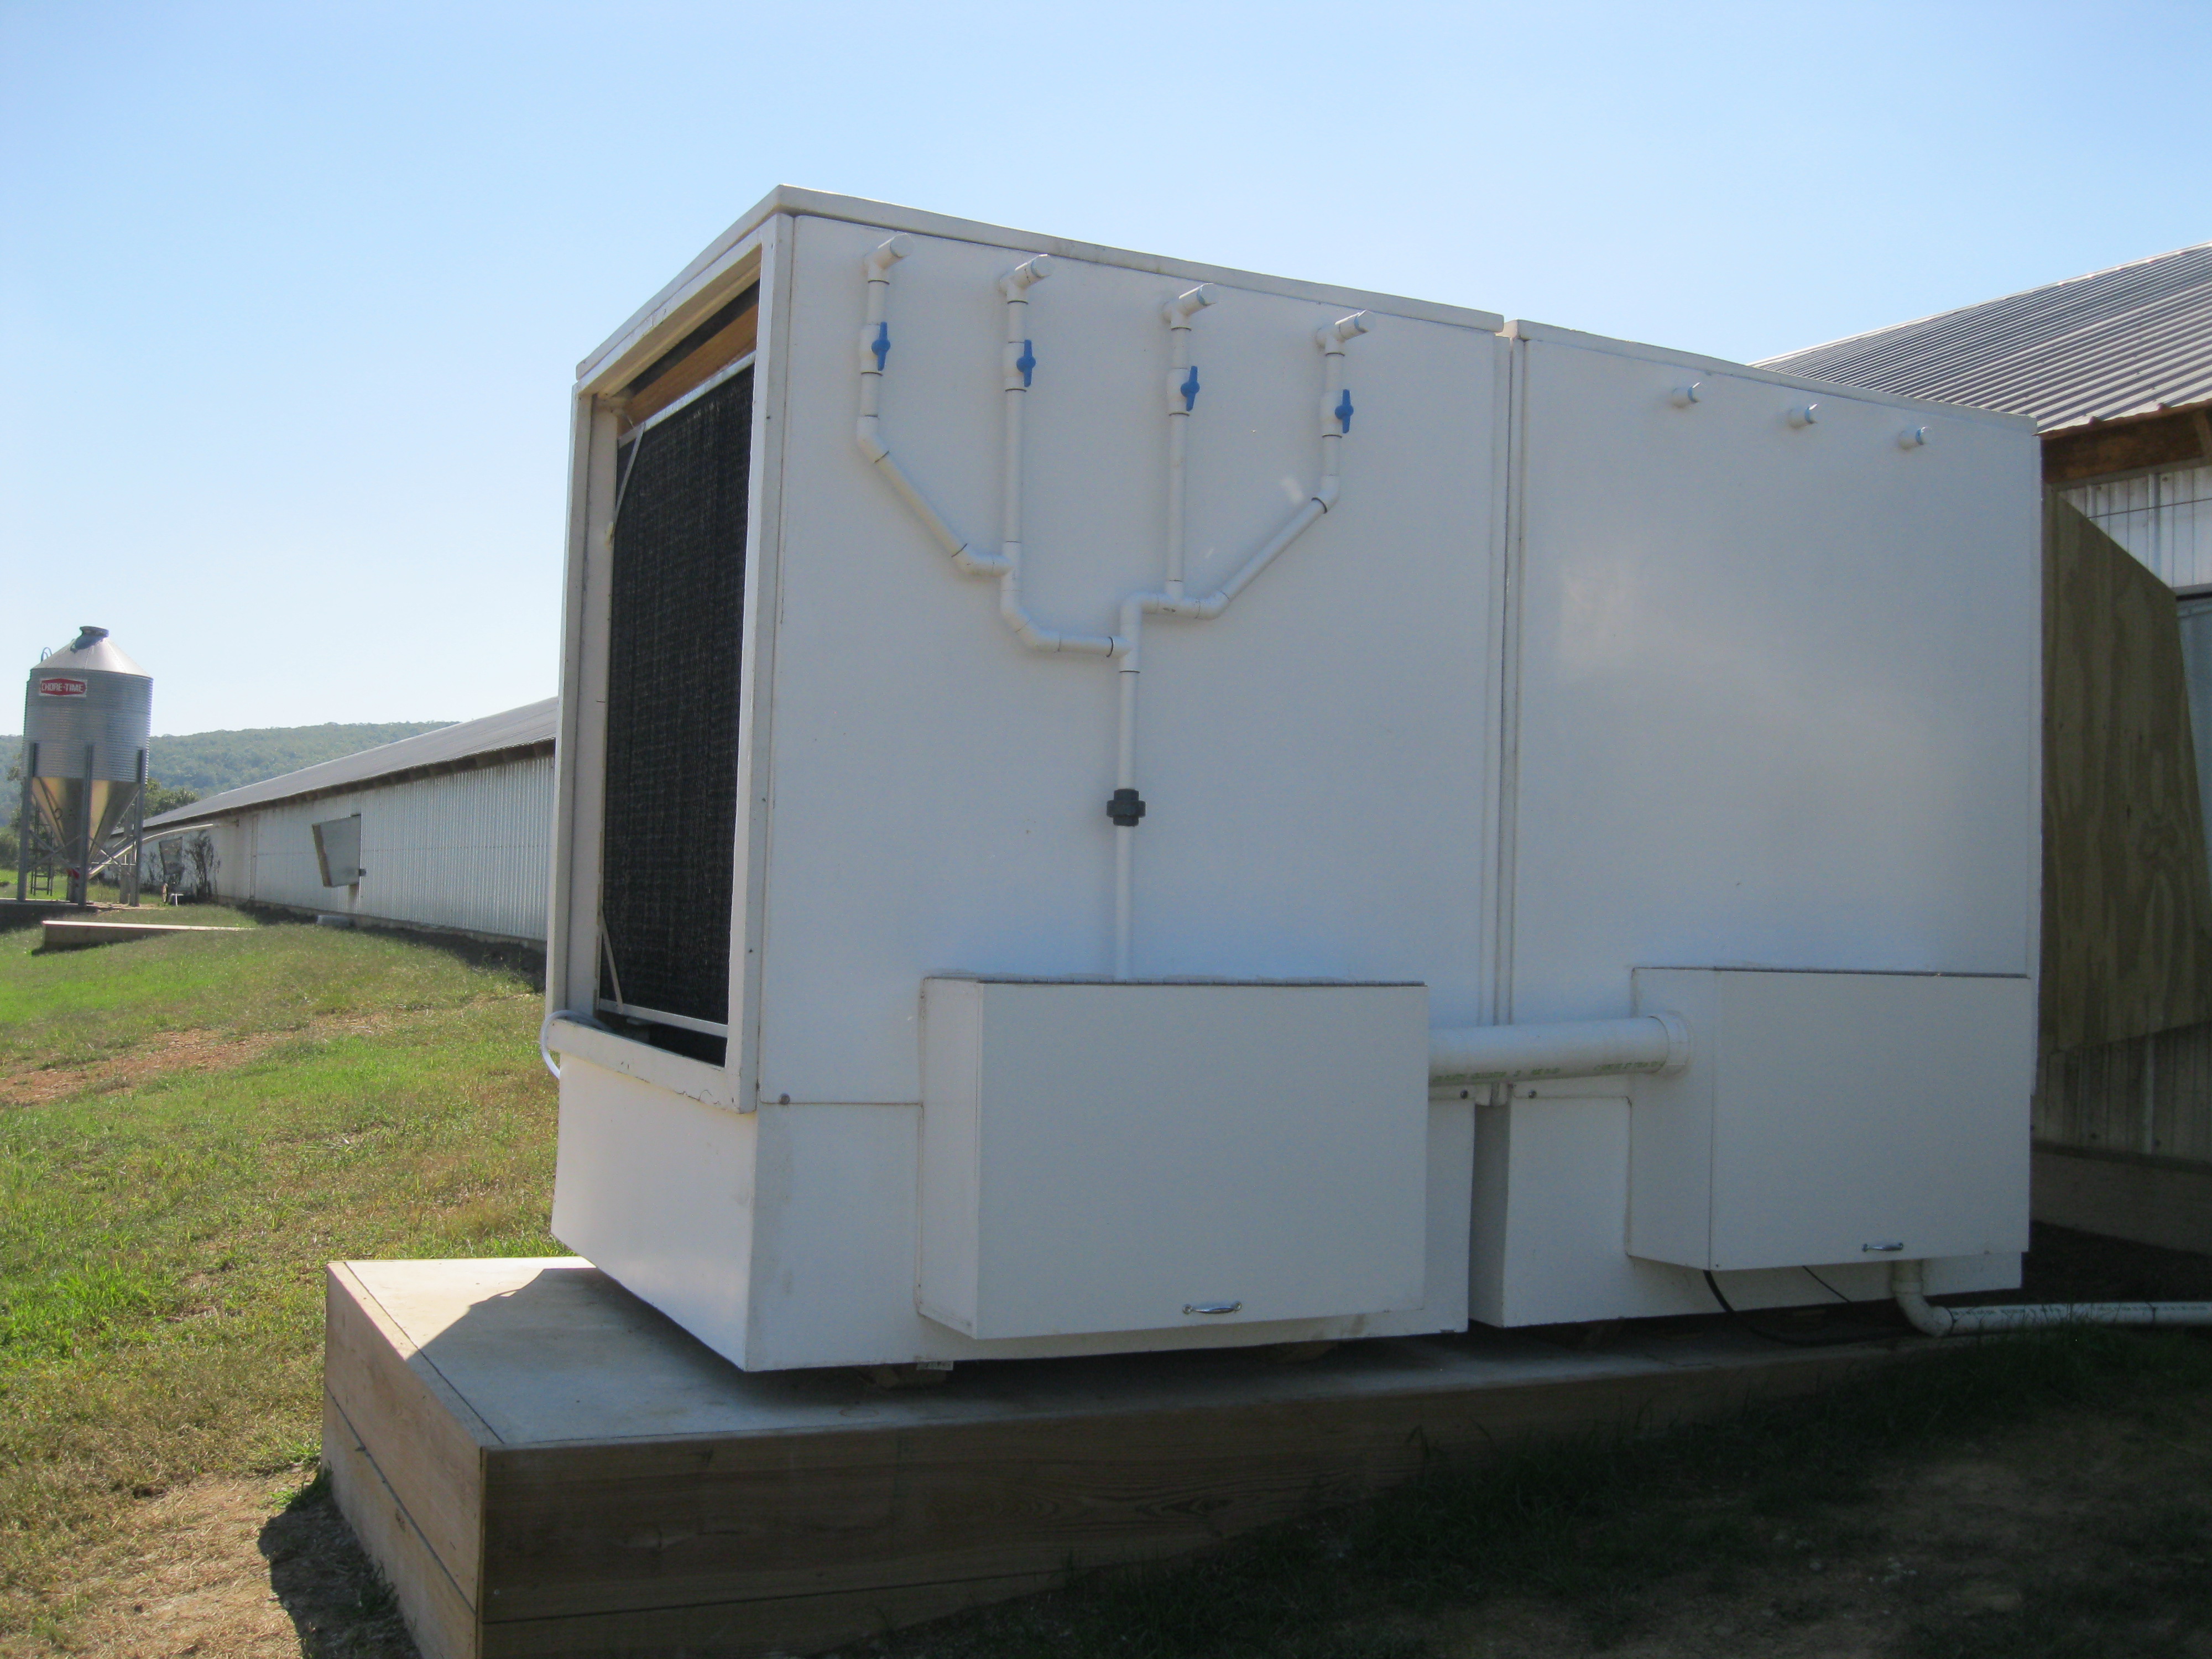
Over half of the nitrogen (N) excreted from broiler chickens is lost to the atmosphere as ammonia (NH3) before the manure is removed from the barns, resulting in air and water pollution and the loss of a valuable fertilizer resource. A two stage exhaust scrubber (ARS Air Scrubber) was developed by scientists with USDA/ARS to trap ammonia and dust emissions from poultry and swine facilities. One objective of this study was to determine the fertilizer efficiency of N, which is mainly present as ammonium (NH4), captured from the exhaust air from poultry houses using acid scrubbers, when applied to forages. The second objective was to determine if any of the scrubber solutions resulted in a decrease in phosphorus (P) runoff or soil test P.
What did we do?
This study was conducted using 24 small plots (1.52 x 6.10 m) located on a Captina silt loam soil at the University of Arkansas Agricultural Experiment Station. There were six treatments in a randomized block design with four replications per treatment. The treatments were: (1) unfertilized control, (2) potassium bisulfate (KHSO4) scrubber solution, (3) alum (Al2(SO4)3.14H2O) scrubber solution, (4) sulfuric acid (H2SO4) scrubber solution, (5) sodium bisulfate (NaHSO4) scrubber solution and (6) ammonium nitrate (NH4NO3) fertilizer dissolved in water. The four scrubber solutions, which were obtained from scrubbers attached to exhaust fans on commercial poultry houses, and the ammonium nitrate solution were all applied at an application rate equivalent to 112 kg N ha-1. Forage yields were measured periodically throughout the growing season. A rainfall simulation study was conducted five months after the solutions were applied to determine potential effects on P runoff.
What have we learned?
Forage yields (Mg ha-1) followed the order: potassium bisulfate (7.61), sodium bisulfate (7.46) > ammonium nitrate (6.87), alum (6.72), sulfuric acid (6.45) > unfertilized control (5.12). These data indicate that forage yields with scrubber solutions can be equal to or even greater than that obtained with equivalent amounts of N applied as commercial fertilizer. This is likely due to the presence of other nutrients, such as K in acid salts, like potassium bisulfate. Nitrogen uptake followed similar trends as yields, although there were no significant differences among N sources.
Total P loads in runoff were 37, 25, 20, 19, 17, and 14 g P ha-1, for sulfuric acid, potassium bisulfate, sodium bisulfate, unfertilized control, ammonium nitrate, and alum. The alum solution resulted in significantly lower P loads than H2SO4. This was likely due to a decrease in the water extractable P (WEP) in the soil, since alum was also shown to significantly reduce WEP compared to the unfertilized control. None of the treatments affected Mehlich III extractable P.
Future Plans
Currently research is underway on using acid-tolerant nitrifying bacteria to generate the acidity needed to capture ammonia in the exhaust air from animal rearing facilities.
The authors are solely responsible for the content of these proceedings. The technical information does not necessarily reflect the official position of the sponsoring agencies or institutions represented by planning committee members, and inclusion and distribution herein does not constitute an endorsement of views expressed by the same. Printed materials included herein are not refereed publications. Citations should appear as follows. EXAMPLE: Authors. 2017. Title of presentation. Waste to Worth: Spreading Science and Solutions. Cary, NC. April 18-21, 2017. URL of this page. Accessed on: today’s date.
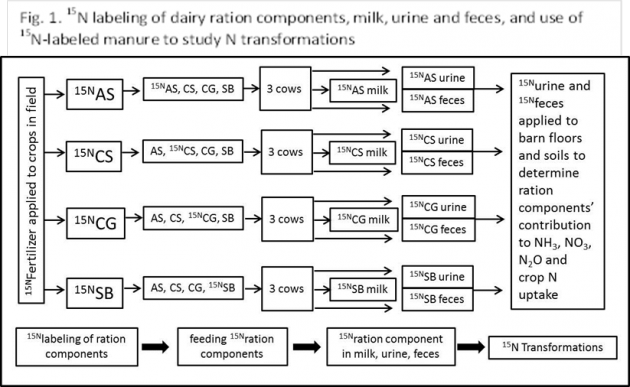
Of the total nitrogen (N) consumed by dairy cows on confinement farms (cows fed in barns), a general range of 20% to 35% is secreted in milk and the remaining N is excreted in manure. The N contained in manure is either recycled through crops after field application, or lost to the environment. To better understand the synergistic nature of feed N and manure N management and environmental N loss from dairy farms, a series of cow, laboratory and field experiments (Figure 1) was undertaken to quantify the relative amounts of N contained in individual ration components that are secreted in milk, excreted in urine and feces, taken up by crops after manure application to soil, and lost as ammonia (NH3) and nitrous oxide (N2O) from dairy barns and soils.
What did we do?
Alfalfa silage, corn silage, corn grain and soybeans were enriched in the field with the stable isotope 15N. Each 15N-enriched component was then fed individually (soybeans were solvent-extracted and the resultant soybean meal was fed) to twelve mid-lactation cows (3 cows per 15N-enriched ration component) as part of a total mixed ration (TMR). The masses of milk, urine and feces produced by each cow were recorded and sampled during the 4 day 15N feeding period, and for 3 days thereafter. This presentation will provide information on the 15N enrichment level of each ration component, the relative amount of each consumed component’s 15N that was secreted in milk and excreted in feces and urine. We will also present the results of a field trial that measured the relative contribution of each ration component’s manure N to corn N uptake during the first and second year after manure application. We will end with explanation of some of the experimental procedures we will use for measuring gaseous N losses after manure applications to barn floors and soils.
What have we learned?
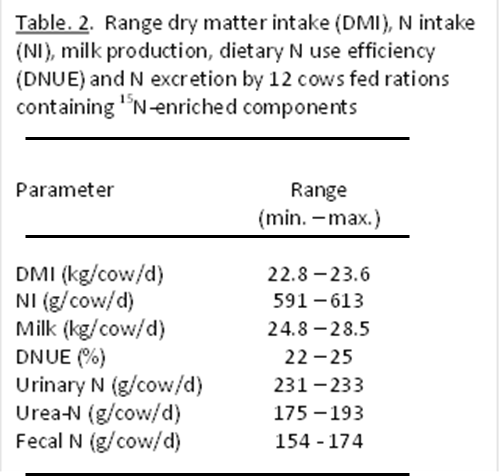
Here we present some preliminary information on 15N labeling of ration components, the TMR that was fed, and some animal responses. Concentrations of fiber, total N and 15N in the ration components are provided in Table 1.
Highest 15N incorporation was achieved with corn (silage and grain) and lowest with alfalfa and soybean. This was due to 15N dilution by the atmospherically-fixed N by these legumes. The methods we used to ensile the 15N-enriched corn and alfalfa, the milling of 15N-enriched corn grain and the extraction of 15N-enriched soybeans to produce soybean meal did not appear to impact TMR intake, milk production or N excretion by dairy cows, as indicated by the narrow range (and non-significant differences among TMR containing the 15N-enriched components) in dry matter intake, N intake, milk production, dietary N use efficiency (relative amount of N intake secreted as milk N) and N excretion in urine, urea and feces (Table 2).
Future Plans
Feces and urine from each 15N enriched ration component will be applied to laboratory emission chambers that simulate barn floors and field soil surfaces, and 15NH3, 15NH4 15NO3 and 15N2O will be measured. Manure-soil incubations, greenhouse and field trials are underway to determine each ration N component contribution to crop N uptake.
Authors
J. Mark Powell, Soil Scientist, USDA-ARS US Dairy Forage Research Center mark.powell@ars.usda.gov
Tiago Barros, Marina Danes, Matias A. Aguerre and Michel A. Wattiaux Dep. Dairy Sci., University of Wisconsin, Madison, Wisconsin USA
The authors are solely responsible for the content of these proceedings. The technical information does not necessarily reflect the official position of the sponsoring agencies or institutions represented by planning committee members, and inclusion and distribution herein does not constitute an endorsement of views expressed by the same. Printed materials included herein are not refereed publications. Citations should appear as follows. EXAMPLE: Authors. 2015. Title of presentation. Waste to Worth: Spreading Science and Solutions. Seattle, WA. March 31-April 3, 2015. URL of this page. Accessed on: today’s date.
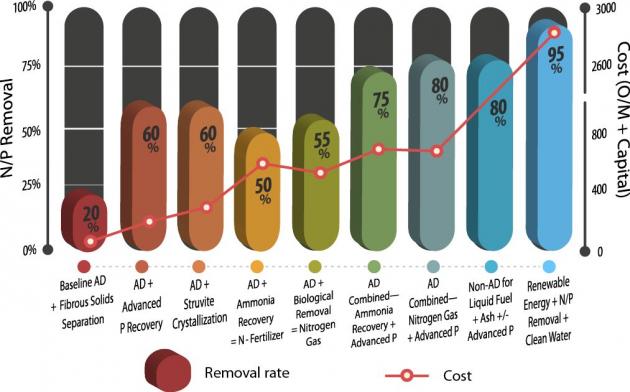
This presentation highlights existing and emerging recovery technologies that can be combined with energy recovery from dairy manure. A variety of technologies is in development, specifically tailored for solids, phosphorus, nitrogen, salt and combinations thereof. Data regarding estimated performance and cost as well as summary graphs are presented. Attention is focused on in-series treatment with anaerobic digesters, but mention is given to incorporation with other renewable energy/fuel technologies.
What did we do?
The presentation focused on information from pilot and commercial demonstration of nutrient recovery (NR) technologies, with sources including literature, pilot reports, company literature, project feasibility studies, and interviews. This presentation attempts to identify broad approaches, identify strengths and weaknesses of those approaches, as well as specific situations where each might be most appropriate. Individual case studies have been included so as to offer more detailed information about representative technologies.
What have we learned?
This presentation estimated a range of performance and cost achievements for each of these broad approaches to NR. Ranges are not necessarily indicative of individual technologies but rather represent an approximate average based on best available data in conjunction with some assumptions. Several factors made these performance and cost estimates challenging. In some cases, technologies are already operating in the dairy sector at commercial scale. In many cases, technologies are operating at a pre-commercial scale, or are used commercially in other sectors such as wastewater treatment facilities. This required assumptions to be made based on informed estimates. Also, because technologies are often applied within a single manure management system, it is clear that costs would vary significantly if applied in other situations. For example, an NR technology that operates well on dilute flush manure would likely require pretreatment at additional cost if applied to scraped manure. Finally, limited data were available, particularly in regard to costs. This is mostly due to proprietary concerns or unwillingness to cite specific costs due to rapidly changing technologies. These factors mean that performance and cost ranges should be viewed as “best estimates” based on the data currently available to researchers. It is meant to provide a broad view of the industry as a whole, and should not be used for individual technology purchase or investment decisions.
Future Plans
There are many other factors that will be important in developing the path forward for the dairy industry with respect to nutrient recovery, form and function of recovered nutrient products for example. Ongoing development of dairy NR technologies should therefore aim to develop products that fit seamlessly into existing fertilizer delivery systems while providing a form that meets transportation and market needs, at price points that are competitive with synthetic fertilizers. Development within such a competitive environment requires not only a sustained effort, but also national and capable partners, a lesson that has been identified during development of a market for high-value peat moss replacement from AD.
A look at the bigger picture, using analytical tools such as life cycle analysis, is also important. Comparison of the performance capabilities and costs of these two approaches are one point of comparison, but a more in-depth comparison may also include consideration of resource management and sustainability, including features such as energy balance, greenhouse gases, and eco-system benefits.
Authors
Jingwei Ma, Research associate at Washington State University mjw@wsu.edu
Craig Frear, Assistant Professor at Washington State University, Georgine Yorgey, Research associate at Washington State University, Chad Kruger, Director at Washington State University Center for Sustaining Agriculture & Natural Resources (CSANR)
This research was supported by funding from USDA National Institute of Food and Agriculture, Contract #2012-6800219814; National Resources Conservation Service, Conservation Innovation Grants #69-3A75-10-152; Biomass Research Funds from the WSU Agricultural Research Center; the Washington State Department of Ecology, Waste 2 Resources Program; US Environmental Protection Agency Grant # RD-83556701; and the Water Environment Research Foundation.
The authors are solely responsible for the content of these proceedings. The technical information does not necessarily reflect the official position of the sponsoring agencies or institutions represented by planning committee members, and inclusion and distribution herein does not constitute an endorsement of views expressed by the same. Printed materials included herein are not refereed publications. Citations should appear as follows. EXAMPLE: Authors. 2015. Title of presentation. Waste to Worth: Spreading Science and Solutions. Seattle, WA. March 31-April 3, 2015. URL of this page. Accessed on: today’s date.
The purpose of this project was to evaluate changes in carbon (C), nitrogen (N), and phosphorus (P) in samples from identical locations taken ten years apart from Horicon Marsh in Dodge County, Wisconsin.
The area surrounding the marsh is primarily agricultural and has the potential to contribute nutrients to the marsh, affecting the fertility of the soils and changing the ecosystem.
What did we do?
We hypothesized that carbon, nitrogen, and phosphorus would show significant increases over the ten-year interval between samplings.
Sample sites were positioned every ¼ mile along east-west transects throughout the marsh. A soil core was obtained at each sample site in the winter of either 2002 or 2003. The same sites were revisited and new samples collected in winter of either 2012 or 2013, ten years after the initial visits. The top five centimeters of each soil core were oven dried at 105°C for 72 hours.
Total carbon and nitrogen were analyzed by combustion using a PerkinElmer 2400 series II CHNS/O Analyzer. Total phosphorus was analyzed by the Olsen P-extraction method on a QuikChem FIA+ 8000 series Lachat analyzer.
A paired t-test (α=0.05) was used to compare nitrogen and phosphorus values. Carbon data were compared with a Mann-Whitney ranked sum test at the 95% confidence interval.
What have we learned?
Carbon and nitrogen did not increase significantly over the time period. Carbon is generally bound in soil organic matter; in histic wetland soils, changes attributable to land use might be difficult to detect due to the already high organic matter content. Nitrogen accumulation was likely mitigated by denitrification processes.
Phosphorus concentrations were greater in the second set of samples. Phosphorus adsorbs tightly to sediment and organic material, which would prevent its removal by flowing water. Changes in land use, especially row crop agriculture in the Horicon marsh area, could contribute runoff inputs of soil particles carrying phosphorus with them. This may explain significantly increased phosphorus levels between the start and end of the study period.
Future Plans
Future studies might quantify land use changes, their extent, and their impacts on the marsh ecosystem; analyze spatial patterns of phosphorus accretion to determine if it is cycling equally throughout the marsh; and determine the impact of denitrifying bacteria and anaerobic conditions on nitrogen accumulation. Additional research could include testing the water column of the marsh for dissolved nutrients; and sampling the Rock River at its inlet to and outlet from the Horicon Marsh to determine nutrient flux to the stream from the marsh.
The authors are solely responsible for the content of these proceedings. The technical information does not necessarily reflect the official position of the sponsoring agencies or institutions represented by planning committee members, and inclusion and distribution herein does not constitute an endorsement of views expressed by the same. Printed materials included herein are not refereed publications. Citations should appear as follows. EXAMPLE: Authors. 2015. Title of presentation. Waste to Worth: Spreading Science and Solutions. Seattle, WA. March 31-April 3, 2015. URL of this page. Accessed on: today’s date.
There is growing evidence that soil nutrient cycling is sustained during the non-growing season in the northern regions of Canada. However, the extent of the transformations and loss of fall-applied manure N is not well documented. The NH4-N fraction of liquid dairy cattle manure, liquid swine manure, and ammonium sulfate was enriched with 15N radioactive isotope, and all N sources were applied to bare sandy loams in early November at sites located in contrasted climate (mean annual temperature 1 to 10°C; mean annual precipitation 300 to 1300 mm; mean snow cover depth <5 to 70 cm). The experiment was replicated over two years at each site. Soils were sampled on the week of application, in November, and at intervals until next May. The recovery of applied 15N in soil NH4-N, NO3-N and organic N pools was measured in the 0-30 cm depth. Soil temperature was also monitored at the 5, 20 and 50 cm depths. Although the transformation of applied ammonium was delayed in colder areas, the transformation of 15NH4-N was generally completed by April, generally before seeding of the next crop. Both nitrification and immobilization of fall-applied 15NH4-N occurred throughout the non-growing season at all sites. As a result, residual 15N was essentially recovered as NO3-N and organic N in the following spring. In most cases, more than 50% of fall-applied 15N was not recovered in the following spring. In general, more 15NH4-N was immobilized with manures than ammonium sulfate, possibly because of the presence of fresh carbon in the manure. As a result, more 15N was recovered in the spring with the manure, and this was particularly obvious at the warmer sites. We conclude that a significant portion of fall-applied NH4-N may be lost during the non-growing season, even in areas with cold and long winter period.
Purpose
It is now recognized that biological processes involved in nitrogen (N) cycling are sustained in agricultural soils under frozen conditions (Clark et al., 2009; Maljanen et al., 2007; Virkajärvi et al., 2010), and that a significant portion of N present in soils in the fall may be transformed and lost during the non-growing season (Jayasundara et al., 2010; Chantigny et al., 2014). However, the extent to which fall-applied N fertilizer, and especially manure-N, can be lost as a function of local winter conditions (e.g. snow cover depth, frost penetration) is not known. Climate models are currently predicting that global warming will result in reduced snow fall, deeper frost penetration and more freeze-thaw cycles in soils of North America (Henry, 2008). This will have impacts on soil biological processes (Groffman et al., 2001), but it is not possible to predict how it may influence the fate of fall-applied N. Our objective was to use a multi-site approach to determine the extent of transformation and loss of fall-applied N during the non-growing season under contrasted winter conditions.
What did we do?
Pig slurry and dairy cattle slurry were enriched with 15N by adding a small amount of ammonium sulfate (99 atom% 15N). This approach allowed tracing of the readily available fraction of manure N (ammonia-N) in the soil N pools. Ammonium sulfate labelled at 5 atom% 15N was also included in the experiment as a no-carbon control treatment. The three treatments were applied to bare loamy soils (top 10 cm) in late fall (first week of November) at four sites located in different climatic zones of Canada: Pacific Maritimes [Mean annual temperature (MAT), 10.5°C; Mean annual precipitation (MAP), 1755 mm; average snow depth (ASD), < 1cm]; Prairies [MAT, 5.7°C; MAP, 383 mm; ASD, 3 cm]; Mixed Wood Plain [MAT, 6.3°C; MAP, 914 mm; ASD, 13 cm]; Boreal Shield [MAT, 4.2°C; MAP, 1213 mm; ASD, 44 cm]. The experiment was repeated in 2009-10 and 2010-11 at all sites. Soils were sampled to 30 cm depth on the week of application, and at intervals until early May to determine the amount of manure N recovered in the NH4, NO3 and organic (immobilized) N pools, as a function of time since application.
What have we learned?
Fall-applied N was transformed and lost throughout the non-growing season at all sites (Fig. 1). Losses were rapid at the warmest site (Pacific Maritimes), and more gradual at the other sites where colder soil temperatures were recorded. Yet, six months after application (late April – early May) only 10 to 50% of fall-applied 15N was recovered in the top 30 cm of soil suggesting very significant loss of manure N during this period. Immobilization and nitrification of applied 15NH4 occurred throughout the non-growing season at all sites (data not shown), and 15N recovered in the next spring was essentially present as NO3 and organic N. At two sites, a greater proportion of applied 15N was recovered in the spring with the manures than ammonium sulfate, and more of this residual 15N was in the organic form in the manure treatments. This suggests that carbon present in the manure stimulated immobilization and retention of fall-applied N in soil. Overall, the results indicate that the readily available fraction of fall-applied N is at high risk of loss during winter, and that changes in soil conditions induced by global warming may not have a great influence on this process or on the manure-N transformation during winter.
References
Chantigny M.H., Angers D.A., Rochette P., Pomar C., Pelster D.E. 2014. Evidencing overwinter loss of residual organic and clay-fixed nitrogen from side-dressed, 15N-labelled pig slurry. Can. J. Soil Sci. 94:1-8.
Clark K., Chantigny M.H., Angers D.A., Rochette P., Parent L.E. 2009. Nitrogen transformations in cold and frozen agricultural soils following organic amendments. Soil Biol. Biochem. 41:348-356.
Groffman P.M., Driscoll C.T., Fahey T.J., Hardy J.P., Fitzhugh R.D., Tierney, G.L. 2001. Colder soils in a warmer world: A snow manipulation study in a northern hardwood forest ecosystem. Biogeochemistry 56, 135-150.
Henry, H.A.L. 2008. Climate change and soil freezing dynamics: Historical trends and projected changes. Climatic Change 87, 421-434.
Jayasundara, S., Wagner-Riddle, C., Parkin, G., Lauzon, J., Fan, M.Z. 2010. Transformations and losses of swine manure 15N as affected by aopplication timing at two contrasting sites.
Maljanen M., Kohonen, A.R., Virkajärvi P., Martikainen P.J. 2007. Fluxes and production of N2O, CO2 and CH4 in boreal agricultural soil during winter as affected by snow cover. Tellus, Series B: Chem. Phys. Meteor. 59, 853-859.
Virkajärvi P., Maljanen M., Saarijarvi K., Haapala J., Martikainen P.J. 2010. N2O emissions from boreal grass and grass-clover pasture soils. Agric. Ecosyst. Environ. 137, 59-67.
Future Plans
Now that we evidenced the significance of losses of fall-applied N from soils during the winter period under varied climatic conditions, we are initiating field work to determine best practices for fall application of manure (e.g. early vs. late fall application; use of additives to delay nitrification of manure ammonia) that will mitigate losses and help efficiently transferring applied N to crop in the next spring.
Corresponding author, title, and affiliation
Martin H. Chantigny, Soil Scientist, Agriculture and Agri-Food Canada, Quebec
Frank J. Larney, Agric. and Agri-Food Canada, Lethbridge; Shabtai Bittman, Agric. and Agri-Food Canada, Agassiz; David Lapen, Agric. and Agri-Food Canada, Ottawa; Denis A. Angers, Philippe Rochette, Agric. and Agri-Food Canada, Quebec
This project was financially supported by the Sustainable AGriculture Environmental Systems (SAGES) Initiative of Agriculture and Agri-Food Canada
The authors are solely responsible for the content of these proceedings. The technical information does not necessarily reflect the official position of the sponsoring agencies or institutions represented by planning committee members, and inclusion and distribution herein does not constitute an endorsement of views expressed by the same. Printed materials included herein are not refereed publications. Citations should appear as follows. EXAMPLE: Authors. 2015. Title of presentation. Waste to Worth: Spreading Science and Solutions. Seattle, WA. March 31-April 3, 2015. URL of this page. Accessed on: today’s date.
Why Study Nitrous Oxide Emissions and Manure Application?*
It is now accepted that soil nitrous oxide (N2O) emissions occur under freezing conditions (Sommerfeld et al., 1993; Pelster et al., 2012), and that overwinter N2O emissions may represent a substantial portion of the total annual emissions from agricultural soils in northern countries (Maljanen et al., 2007; Wagner-Riddle et al., 2007; Virkajärvi et al., 2010). However, the temporal dynamics during winter are poorly documented, and the question whether manure application in the fall may increase winter N2O emissions is under debate. In addition, the possible influence of soil texture in regulating N2O emissions during winter has been overlooked. Our objective was to compare N2O emissions above the snow cover on sandy and clayey soils with and without pig slurry applied in the fall.
What did we do?
The study was carried out for three consecutive winter periods (2010-2013) on a sandy loam and a silty clay soil. Soil N2O concentration and emission were monitored weekly from November to May using soil probes and static chambers, respectively. The static chambers were made of 20-cm diameter white PVC pipe. The chamber base (15 cm height) was permanently inserted to 10 cm depth. Pig slurry was applied within half of the chamber bases (5 per soil type), whereas the other half remained unamended (Control treatment). The manure was immediately incorporated into the top 5 cm of soil using hand tools; soil in control chambers was similarly disturbed. Additional sections of PVC pipe (10 cm height) were secured on the top of each chamber base as the snowpack developed, and were removed stepwise in the spring during snowmelt. The chamber base was therefore emerging above the snow cover at time of chamber deployment. On each sampling date, the accumul ation of N2O within the chamber headspace was monitored at 6-min intervals during 18-min deployments. Soil air was also collected weekly through soil probes installed at 7.5 cm depth. Air samples were withdrawn with a syringe and transferred to pre-evacuated vials. Gas samples in vials were analyzed for N2O within 48 h using a gas chromatograph.
Martin H. Chantigny, Philippe Rochette & Denis A. Angers, Agriculture and Agri-Food Canada, Québec;
Claudia Goyer, Agriculture and Agri-Food Canada, Fredericton, Canada
Table 1. Range of cumulative N2O-N emission, magnitude of emissions, and emission factors measured for three consecutive winter periods.
Sandy loam
Silty clay
Cumulative emission
(kg N2O-N/ha)
0.1 to 2.0
0.6 to 1.6
Magnitude of emissions
(% of total annual emission)
32 to 67
10 to 27
Emission factor
(% N applied)
0.3 to 3.0
0.9 to 2.4
What have we learned?
Nitrous oxide was produced in soils and emitted in all years, with a low in late fall (Nov.-Dec.) and significant increases when snow depth exceeded 20 cm (late Dec. – early Jan.) and during spring thaw (late March – early April). Ice formation on and within the soil occurred during freeze-thaw events. This phenomenon generally blocked the emission of N2O but did not prevent its production in the soil. Therefore ice formation resulted in a marked decline in N2O emissions with concurrent increase in soil N2O concentration. The temporal dynamics of N2O emissions was variable among years, and the significance of manure-induced N2O emissions was mainly explained by early winter frost penetration, which was dependent on snow accumulation in late fall. As opposed to N2O emissions measured during the growing season, sandy soils tended to emit as much N2O as clayey soils during the non-growing season. Consequently, the cumulative N2O-N emi ssions in the non-growing season (November-April) accounted for 10 to 25% of total annual emissions in clayey soils, and from 20 to 70% in sandy soils (Table 1). Soils amended with pig slurry in the fall emitted more N2O than soils without, with emissions factors up to 3%, higher than the default IPCC coefficient (1%).
References
Maljanen M., Kohonen, A.R., Virkajärvi P., Martikainen P.J. 2007. Fluxes and production of N2O, CO2 and CH4 in boreal agricultural soil during winter as affected by snow cover. Tellus, Series B: Chem. Phys. Meteor. 59, 853-859.
Sommerfeld, R.A., Mosier, A.R., Musselman, R.C. 1993. CO2, CH4, and N2O flux through a Wyoming snowpack and implications for global budgets. Nature 361:140-142.
Virkajärvi P., Maljanen M., Saarijarvi K., Haapala J., Martikainen P.J. 2010. N2O emissions from boreal grass and grass-clover pasture soils. Agric. Ecosyst. Environ. 137, 59-67.
Wagner-Riddle, C., Furon, A., McLaughlin, N. L., Lee, I., Barbeau, J., Jayasundara, S., Parkin, G., von Bertoldi, B., Warland, J. 2007. Intensive measurement of nitrous oxide emissions from a corn-soybean-wheat rotation under two contrasting management systems over 5 years. Global Change Biol. 13:1722-1736.
Future Plans
Now that we evidenced the significance of N2O emissions from soils during the winter period, we are initiating field work to determine best practices for fall application of manure (e.g. early vs. late fall application; use of additives to delay nitrification of manure ammonia) that will mitigate losses and help efficiently transferring applied N to crop in the next spring.
Authors
Martin H. Chantigny, Soil Scientist, Agriculture and Agri-Food Canada, Quebec martin.chantigny@agr.gc.ca
Philippe Rochette, Denis A. Angers, Agriculture and Agri-Food Canada, Québec;
This project was financially supported by the Sustainable AGriculture Environmental Systems (SAGES) Initiative of Agriculture and Agri-Food Canada
The authors are solely responsible for the content of these proceedings. The technical information does not necessarily reflect the official position of the sponsoring agencies or institutions represented by planning committee members, and inclusion and distribution herein does not constitute an endorsement of views expressed by the same. Printed materials included herein are not refereed publications. Citations should appear as follows. EXAMPLE: Authors. 2015. Title of presentation. Waste to Worth: Spreading Science and Solutions. Seattle, WA. March 31-April 3, 2015. URL of this page. Accessed on: today’s date.
Agricultural operations can pose a threat to the quality of nearby water sources, particularly from nitrogen and phosphorus losses following land application of manure. Biochar application to soils has the potential to ameliorate degraded soils and reduce nutrient leaching to groundwater. The effects of amending sand soil columns with hybrid poplar biochar made by a slow pyrolysis process at 450°C at varying rates (0, 1, 2 and 5% by weight) with repeated dairy manure applications over a 56-week period was examined to evaluate the impact to leachate water quality.
What did we do?
Four biochar treatments and a control were mixed and packed into soil columns by weight to a depth of 20 cm. Leachate from columns were measured in quadruplicate to assess differences in water quality over a 56-week study duration. Each treatment column received an initial manure application followed by additional applications at 14 week intervals, totaling four manure applications. All columns received a 300 mL DI water application once every two weeks.
The total volume of leachate, leachate pH and BOD5 and concentrations of nitrite (NO2-N), nitrite+nitrate (NO2-N+NO3-N), total nitrogen (TN), and total phosphorus (TP) were measured for each column after each leaching event. After the first 14 week cycle (starting with the second manure application), leachate samples were also analyzed for ammonia+ammonium (NH3-N+NH4-N). After each application, manure samples were analyzed for these same parameters. At the end of the study, retention of the same nutrients was determined for mass balance analysis.
Leachate photo
What have we learned?
Increasing levels of biochar amendment to sandy soil with repeated dairy manure application decreased leachate pH throughout the study and decreased peak levels of BOD5 after manure application. Increased levels of biochar also decreased cumulative TN, NH3-N+NH4-N and NO3-N in leachate, but slightly increased TP leaching. Nutrient retention in the columns at the end of the study indicated that N reduction in leachate was not due to increased retention in the columns. These results indicate that biochar could be a viable option to reduce N leaching from agricultural fields or treatment systems. However, more research is needed on the effect of biochar on gaseous N emissions and other biochar/soil interactions before amending soil with biochar can be recommended as a nutrient management strategy.
Future Plans
Future work should focus on uncovering the mechanisms for N cycle changes in soils with biochar amendment, such as tracking N-labelled fertilizers in column leaching and emissions. Due to its high cost, biochar may be a more feasible option for treatment systems, such as filter strips or tile drains, which should be explored as a means to reduce nutrient leaching from agricultural fields in an economical manner. Field trials should also be conducted to determine appropriate biochar amendment methods, effects on plant growth and any differences in leaching and emissions under field conditions.
Authors
Alysa Bradley, PhD Student, Biological Systems Engineering Department, University of Wisconsin-Madison alysa.bradley@wisc.edu
Rebecca Larson and Troy Runge, Assistant Professors, Biological Systems Engineering Department, University of Wisconsin-Madison
Additional information
Alysa Bradley, Biological Systems Engineering Department, University of Wisconsin-Madison, 460 Henry Mall, Madison, WI 53706, alysa.bradley@wisc.edu
Acknowledgements
This material is based upon work supported by the National Institute of Food and Agriculture, United States Department of Agriculture, under ID number WIS01760.
The authors are solely responsible for the content of these proceedings. The technical information does not necessarily reflect the official position of the sponsoring agencies or institutions represented by planning committee members, and inclusion and distribution herein does not constitute an endorsement of views expressed by the same. Printed materials included herein are not refereed publications. Citations should appear as follows. EXAMPLE: Authors. 2015. Title of presentation. Waste to Worth: Spreading Science and Solutions. Seattle, WA. March 31-April 3, 2015. URL of this page. Accessed on: today’s date.
The Science Symposium was focused on the principals and science supporting dairy nutrient management planning in Washington State. Speakers were from UC Davis, Agriculture and Agri-Food Canada-British Columbia, Oregon State University, Washington State University, WA Department of Ecology, Sunnyside Irrigation District and Whatcom Conservation District. Presentations related to WA NRCS Tech Note 14 (Winter Spreading) and the WA NRCS 590 (Nutrient Management Standard). The symposium ended with a panel discussion with the speakers, and concluded with a summary of expected next steps.
The goals of the symposium were to:
1. Learn the latest research regarding the winter spreading of dairy manure on water quality.
2. Identify areas of scientific agreement
3. Develop next steps
Please click on the highlighted presentation name below to view the recorded presentation from the symposium.
Provide EPA’s perspective on nutrient pollution and encourage an open dialogue to help address this problem which is rapidly becoming one of the most challenging environmental problems that we face.
What Did We Do?
Although nutrients, nitrogen and phosphorus in particular, are essential for aquatic life, too many nutrients can create significant problems for our nation’s lakes, streams, and coastal waters. Nutrient pollution can degrade habitat for fish and wildlife, render water bodies unsafe for swimming and other forms of contact recreation, create a public health concern for drinking water supplies, decrease property values, and negatively impact local economies. According to national statistics, more than 45% of streams have medium to high levels of nutrients, approximately four million lake acres have been identified as threatened or impaired, and approximately 78% of assessed coastal areas exhibit signs of eutrophication.
Nutrients can be transported great distances and impact areas far downstream. One of the more prominent examples in the United States is the Gulf of Mexico “dead zone,” which can be larger than the state of Connecticut in some years. The term “dead zone” refers to waters that have been so heavily impacted by nutrient pollution that oxygen levels are depleted to the point where most aquatic life cannot survive. Nutrients are transported to the Gulf of Mexico via tributaries of the Mississippi River from as far away as Montana in the west and Pennsylvania in the eastern portion of this large watershed.
Nutrient pollution is not restricted to the Mississippi River Basin or any one region of the country. Nutrient pollution is widespread, impacting waters across the nation. As we learn more about the impacts of nutrient pollution, especially the potential for some species of algae to produce toxins that can be harmful to both people and animals, states are becoming more aggressive in reducing sources and even posting health advisories when necessary.
So, what has EPA been doing to address nutrient pollution?
Providing states with technical assistance and other resources to help develop water quality criteria for nitrogen and phosphorus;
Working with states to identify waters impaired by nutrients and developing restoration plans;
Awarding grants to states to address pollution from nonpoint sources, such as agriculture and storm water runoff;
Administering a permit program designed to reduce the amount of nitrogen and phosphorus discharged to the environment from point sources;
Providing funding for the construction and upgrade of municipal wastewater treatment plants;
Working with states to reduce nitrogen oxide emissions from air sources;
Conducting and supporting extensive research on the causes, impacts, and best approaches to reduce nutrient pollution; and
Increasing collaboration with other federal partners (e.g., USDA) to leverage financial and technical resources.
And although progress has been made over the past decade, much more is needed. Realizing a need for greater action, In March 2011, EPA issued a memorandum titled “Working in Partnership with States to Address Phosphorus and Nitrogen Pollution through Use of a Framework for State Nutrient Reductions.” This memo emphasized that nutrient pollution continues to have the potential to become one of the costliest and most challenging environmental problems that we face and reaffirmed the agencies commitment to partner with states and stakeholders to make greater progress in reducing nutrient loading to our nation’s waters. If you have not already done so, please join us in protecting and restoring our nation’s waters. For more information visit EPA’s nutrient pollution website at http://www.epa.gov/nutrientpollution/.
Author
Alfred Basile, Biologist, US Environmental Protection Agency Region 8, basile.alfred@epa.gov
The authors are solely responsible for the content of these proceedings. The technical information does not necessarily reflect the official position of the sponsoring agencies or institutions represented by planning committee members, and inclusion and distribution herein does not constitute an endorsement of views expressed by the same. Printed materials included herein are not refereed publications. Citations should appear as follows. EXAMPLE: Authors. 2013. Title of presentation. Waste to Worth: Spreading Science and Solutions. Denver, CO. April 1-5, 2013. URL of this page. Accessed on: today’s date.
To provide the best experiences, we use technologies like cookies to store and/or access device information. Consenting to these technologies will allow us to process data such as browsing behavior or unique IDs on this site. Not consenting or withdrawing consent, may adversely affect certain features and functions.
Functional
Always active
The technical storage or access is strictly necessary for the legitimate purpose of enabling the use of a specific service explicitly requested by the subscriber or user, or for the sole purpose of carrying out the transmission of a communication over an electronic communications network.
Preferences
The technical storage or access is necessary for the legitimate purpose of storing preferences that are not requested by the subscriber or user.
Statistics
The technical storage or access that is used exclusively for statistical purposes.The technical storage or access that is used exclusively for anonymous statistical purposes. Without a subpoena, voluntary compliance on the part of your Internet Service Provider, or additional records from a third party, information stored or retrieved for this purpose alone cannot usually be used to identify you.
Marketing
The technical storage or access is required to create user profiles to send advertising, or to track the user on a website or across several websites for similar marketing purposes.