Phosphorus Recovery from Anaerobic Swine Lagoon Sludge Using the Quick Wash Process

Proceedings Home W2W Home w2w17 logo

Purpose

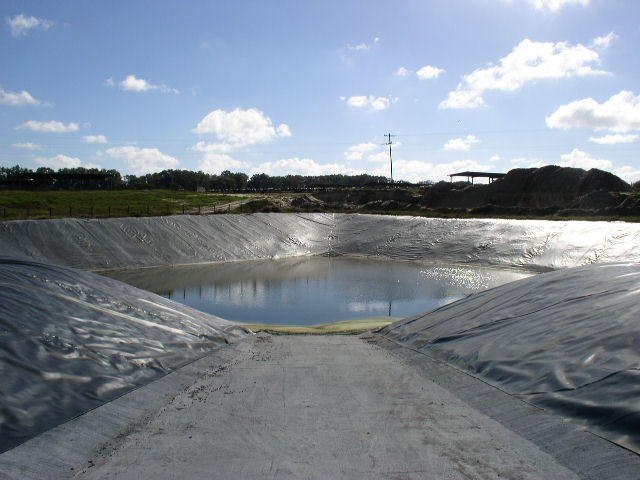
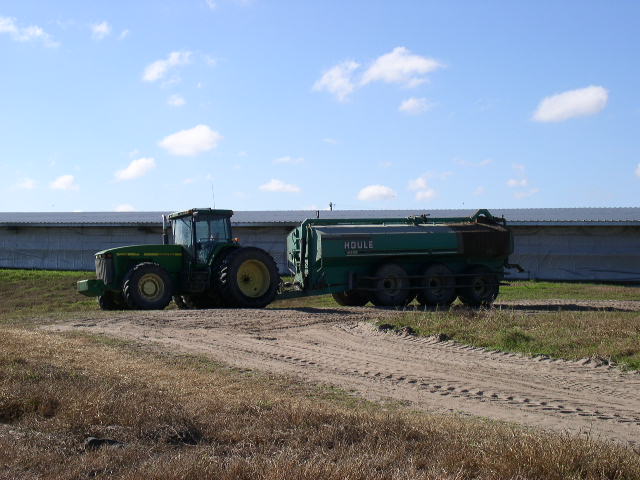
Long term and significant accumulation of sludge in anaerobic swine lagoons reduces its storage volume and ability to treat waste. Usually, excess accumulation of lagoon sludge is removed using pump or dredge. The dredged sludge is then land applied at agronomic rates according to its nutrient content.

The accumulation of phosphorus (P) in the sludge requires the largest area of land application based on crop agronomic requirements. Therefore, nutrient management plans may limit application to crop or pastureland near the animal facility to avoid P build up in excess of soil and crop assimilative capacities. Although dewatered sludge can be moved off the farm, transportation becomes less economical with increasing distances. An option is to extract and recover P in a concentrated form for its economical transfer to P-deficient croplands, for use as fertilizer.

What did we do?

A patented treatment process, called Quick Wash (QW), developed by USDA-ARS for extraction and recovery of P from animal manure solids was tested for recovery of P from anaerobic swine lagoon sludge. With the QW process,Chart of Quick Wash Process 
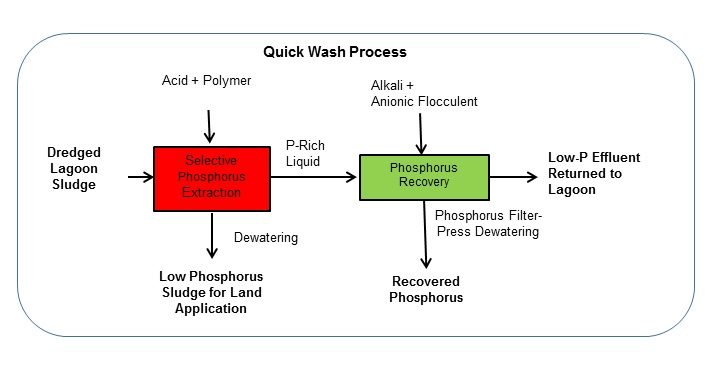
P was extracted in solution from dredged sludge by mixing with sulfuric acid prior to dewatering using polymer enhanced mechanical solid-liquid separation. After that, P was recovered by addition of liquid lime and an anionic flocculent to the separated liquid extract to form a calcium-containing P precipitate. The QW process generated two solid products: 1) sludge solids low in P; and 2) a concentrated P material.

What have we learned?

Picture of recovered phophorus material from lagoon sludge

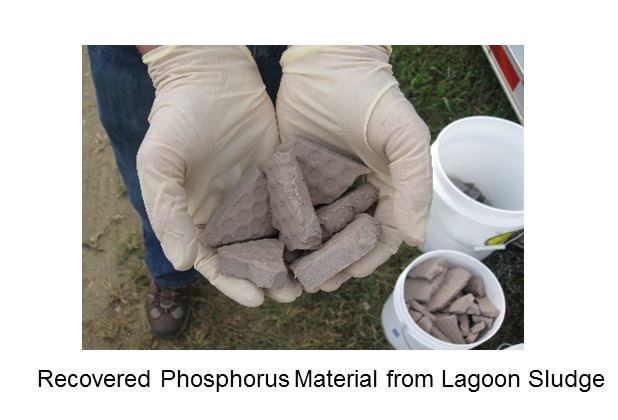
While most of the nitrogen and carbon was left in the washed sludge solids, the QW process extracted and recovered as much as 90 % of the P from sludge. From results of a pilot field test, the P grade of the recovered phosphate was in the range of 24.0% – 30.5 % P2O5. The inclusion of this process in a lagoon sludge management plan offers producers an opportunity to locally land-apply the low-P sludge as a carbon-rich soil amendment and recover P as a valuable product for export from the farm.

Future Plans

USDA granted an exclusive license of the invention to Renewable Nutrients, LLC (Pinehurst, NC) to commercialize in the U.S the process for P recovery from animal and municipal waste streams. Renewable Nutrients is developping commercialization plans for the Quick Wash process that will include the operating and equipment costs of phosphorus recovery from dredged lagoon sludge.

Corresponding author, title, and affiliation

Ariel A. Szogi, Research Leader, USDA-ARS Coastal Plains Soil, Water, and Plant Research Center, Florence, SC.

Corresponding author email

ariel.szogi@ars.usda.gov

Other authors

Matias B. Vanotti; and Paul D. Shumaker – USDA-ARS Coastal Plains Soil, Water, and Plant Research Center, Florence, SC.

Additional information

https://www.renewablenutrients.com/

Acknowledgements

This work is part of USDA-ARS National Program 212; ARS Project 6082-12630-001-00D “Improvement of Soil Management Practices and Manure Treatment/Handling Systems of the Southern Coastal Plain.”

Gas-Permeable Membrane Selection Methodology for Wastewater Treatment and Resource Recovery


Proceedings Home W2W Home w2w17 logo

Purpose 

The use of gas-permeable membranes in wastewater treatment and resource recovery has become an increasingly prevalent research topic. Many of the membranes used for such purposes are expanded PTFE (ePTFE or Teflon), but the specifications, characteristics, and performance under certain conditions of these materials vary widely. In spite of these property differences, we found no documented process or suggested membrane specifications by which one membrane product can be selected over another for a given removal or recovery goal in wastewater. Research we reviewed in this area mostly describe examples of different applications.

Collection of ammonia from waste streams, especially with high concentrations such as animal manures, offers several benefits such as reduction of air pollution precursors, prevention of water pollution, and transformation into higher-value products.

What did we do? 

Tests were selected to evaluate the performance and durability of four different hydrophobic, gas-permeable membranes specific to the application under consideration—ammonia recovery from wastewater—but can be used with slight modification for testing recovery of other compounds of interest.

The four Teflon membranes selected differed in material density and wall thicknesses, specifications important for variability in handling, durability, and mass transfer (HDKW: high density, thick wall; LDKW: low density, thick wall; LDNW: low density, thin wall; HDNW: high density, thin wall). Membrane specifications and properties are provided in Table 1. The different membranes were examined in this study spanned across several trials. Experimentation reared data on different membranes’ weep pressure, as well as the airflow rate through the membranes as a function of applied pressure to the membrane. Data were also collected on the rate of transfer of ammonia from the gas phase across the membrane into the aqueous phase over a 24-hour period.

Table 1. Properties of gas-permeable hydrophobic membranes.

I. Weep Pressure Test

The weep pressure is that pressure at which the membrane loses its hydrophobicity and allows liquid to pass. Results are used to estimate the maximum differential pressure the membrane can withstand without compromising membrane integrity. This test of each membrane material was completed in triplicate using prepared sections of each of the four membrane materials. Membranes were first soaked in 0.1 mM sulfuric acid for 24 hours. A section of each membrane material was connected at the end of a column of vinyl tubing and filled with the 0.1 mM H2SO4 solution at a pressure of 0.5 PSI. Pressure was increased by 0.5 psi increments every 24 hours by applying air pressure through a manifold. Pressure was increased until a drop of liquid was found weeping from one or more of the membranes.

II. Air Flow Test

We determined the resistance to airflow through each membrane as an indication of the relative resistance of the various membranes to mass transfer of gas molecules of interest. A section of each of the four materials were connected to a compressed air source through a flow meter and pressure gauge. The pressure was recorded as the airflow rate was increased incrementally to 25 PSI, well past the maximum weeping pressure, or until the flow rate seemed to taper off. The procedure was repeated three times using the same section of each membrane material. The results are shown in Figure 1.

Figure 1. Air flow through hydrophobic membranes

III. Mass Transfer Test (Gas to Liquid Exchange)

A final test was conducted to estimate if the differences in membrane composition and performance of earlier tests impact the mass transfer of the gas of interest across the membrane. A single section of each of the four membrane materials was installed through bulkhead fittings as shown in Figure 2 into a chamber such that deionized (DI) water could be circulated through each individual membrane while all four membranes were exposed to the same NH3 concentration inside the chamber. NH4Cl was combined with NaOH inside the chamber to produce NH3 gas.

Figure 2. Chamber and membranes used for mass transfer test

What have we learned? 

The results of the mass transfer experiments revealed there are only small differences in ammonia transfer rates among the different membranes, leaving the membrane selection to rely on other results. The weep pressure of the low density membranes was lower than that of the high density membranes but was sufficient to avoid backwards movement of the two fluid phases. The higher airflow rate and lower pressure of the low density thin walled material was the determining factor in selecting this membrane. From these tests, this membrane will survive handling and installation and will provide little resistance to ammonia transfer from wastewater.

Future Plans   

The experiments and conclusions involved in this study are some of the first of their kind for this application, therefore leaving much research to still be done surrounding membrane selection for other material recovery processes. Data gathered in this particular study can serve as a guideline for further research pertaining to optimal membrane characteristics for the recovery of target products from effluent.

Corresponding author, title, and affiliation        

Jacqueline Welles, Undergraduate Research Assistant, Biological and Agricultural Engineering, North Carolina State University

Corresponding author email    

jswelles@ncsu.edu

Other authors   

Elizabeth Gordon, Undergraduate Research Assistant, Biological and Agricultural Engineering, North Carolina State University John J. Classen, Ph.D., Associate Professor, Biological and Agricultural Engineering, North Carolina State University Mark Rice, E

Additional information              

Primary author: Jacqueline Welles – North Carolina State University

Email: jswelles@ncsu.edu

Lead investigator: John Classen, PhD, North Carolina State University

Email: john_classen@ncsu.edu

Acknowledgements       

Funding for this project was provided by NRCS CIG Award Number 69-3A75-12-183. The authors are grateful for the analytical work of the BAE Environmental Analysis Laboratory, Dr. Cong Tu, manager.

Utilization of Woody Biomass and Manure as Agricultural Soil Amendments in Nebraska


Proceedings Home W2W Home w2w17 logo

Purpose 

While Eastern Redcedar are native to Nebraska and much of the Central U.S., the ability of these trees to thrive in many soils and under a broad range of climatic conditions has contributed to their designation as an invasive species. Cedar tree proliferation negatively impacts agriculture by reducing groundwater availability, compromising grazing land, impeding forage production for cattle, and altering surface water flows. Agricultural crop and livestock producers depend on affordable access to water, healthy and productive soils, and quality grazing land to remain profitable. Land treatment practices that return organic matter to soil improve soil health, which in turn positively impacts crop productivity, soil water holding capacity, soil fertility, and grazing land forage quality and productivity. This project is investigating the use of two readily available by-products in Nebraska, livestock manure and cedar tree wood chips,  as amendments on agricultural land to improve soil productivity metrics. The overall goal of this project is to demonstrate a value-added use for woody biomass to offset the cost of tree management activities and encourage landowner management of cedars.

What did we do? 

Crop year 2016 was the first year of the Woody Biomass and Manure Project. Six treatments were applied to 12-m x 10-m plots within cooperators’ fields following the 2015 harvest:

1. woody biomass (WB1), 6 ton/ac

2. woody biomass (WB2), 12 ton/ac

3. woody biomass with liquid N (WBLN), 6 ton/ac

4. woody biomass with swine manure (WBSM), 6 ton/ac

5. woody biomass with cattle manure (WBCM), 6 ton/ac

6. control (Cont), no amendments

Manure and liquid nitrogen treatments received less than 30 lbs ac-1 of N in the fall. The experiment is a completely randomized block design with four replications of each treatment, for a total of 24 plots, at each of the sites. Since the plots were established within existing crop fields, the producers were encouraged to continue their current management strategies. Both sites were irrigated, and fertilizer was applied uniformly across all plots using the pivot throughout the growing season.

Soil was sampled for chemical and biological properties in the spring and fall of 2016 and sent to a commercial lab for analyses. Rye was sampled by hand harvesting 0.25 square feet from four locations within each plot for a total of 1 square foot. Corn was sampled by hand harvesting six plants from each plot. Stand counts were also completed. WATERMARK sensors were installed at three depths (1, 2, and 3 ft) in two replications of four treatments (WBCM, WB1, WB2, Cont) at both sites. Additionally, temperature sensors were installed at a depth of 1 ft. A total of 16 plots were monitored (8 plots per site with 2 replications of 4 treatments).

What have we learned? 

Soil biological and chemical characteristics have not been affected during the first year. There were no differences in the amount or type of soil microbes due to treatment. WBCM and WBLN had greater soil nitrate than WB1 and WBSM early in the spring. Additionally, WBCM had greater soil K than the other treatments. Other than these two instances, there were no differences in organic matter, pH, and macronutrients. However, this is not surprising since measurable changes in soil properties typically occur over many years and manure application rate was relatively low. More importantly, though, is that microbial populations were not decreased by the cedar mulch.

Cedar mulch applications did not decrease biomass yield of corn and rye when applied with nitrogen. In fact, in the rye, WBLN had the greatest biomass yields followed by WBCM, WB1, WBSM, and Cont. WB2 had the lowest rye biomass, which was probably due to nitrogen tie-up by the wood chips due to the initially higher C:N ratio. There was no treatment effect for corn biomass or stand counts.

At the site planted to corn at a depth of one foot, the three woody biomass treatments monitored (WB1, WB2, and WBCM) were significantly wetter and cooler than the control from mid-June until mid-July. WBCM was also wetter at a depth of two feet than the control. Unfortunately, due to rodent activity, statistical analyses at the rye site and other times of the growing season are not possible. The differences in soil moisture and temperature are probably due to shading and the physical barrier to evaporation that the wood chips supply. The increased soil moisture under the woody biomass treatments could reduce irrigation.

Future Plans  

In order to apply for competitive funding, we need more supporting data. We are going to increase monitoring of soil moisture and temperature, so that three replications of all six treatments are monitored at both sites. Additionally, a greenhouse study will be conducted to provide water quality data and rate of decomposition of the wood chips.

Corresponding author, title, and affiliation       

Linda Schott, Extension Graduate Research Assistant, University of Nebraska-Lincoln

Corresponding author email   

linda.rae.schott@gmail.com

Other authors   

Amy Schmidt, Assistant Professor, University of Nebraska-Lincoln; Amy Timmerman, Associate Extension Educator, University of Nebraska-Lincoln; Adam Smith, Assistant Forester, Nebraska Forest Service

Additional information               

More information can be found at: manure.unl.edu

Acknowledgements       

This project is funded by the Nebraska Forest Service. We would like to thank the Middle Niobrara Natural Resource District, especially Mike Murphy, Travis Connot, and Zach Peterson, for their assistance to this project. We would also like to thank the Nebraska Forest Service, especially Richard Woollen, Adam Smith, and Heather Nobert, for their assistance to this project. Additionally, this project would not be possible without our two farmer cooperators, Leonard Danielski and Greg Wilke.

Manure Treatment and Natural Inactivation of Porcine Epidemic Diarrhea Virus in Soils

Proceedings Home W2W Home w2w17 logo

Purpose

The porcine epidemic diarrhea virus (PEDv) outbreak in North America has substantially impacted swine production, causing nearly 100% mortality in infected newborn piglets. Because manure may remain a source of reinfection, proper manure management practices to limit outbreaks need to be developed and evaluated. Two laboratory studies simulating manure pit treatment with increasing amounts of quicklime were conducted to determine PEDv susceptibility to increasing pH. Additionally, two laboratory soil incubation studies contrasting manure liming, multiple soil types, and two antecedent soil moistures were conducted over several months with incubation conditions mimicking the climates in Minnesota, Missouri, and Oklahoma to determine whether current manure application practices reduce the potential for PEDv reinfection via manure-amended soil. Quantitative PCR and live swine bioassays were used to enumerate PED virus and to determine whether manure and soil samples contained infectious PEDv.

What did we do?

Quicklime-Manure Slurry Incubations: An initial short-term manure slurry study was conducted on fresh PEDv-positive manure slurry collected in 2015 from the shallow pit of a commercial swine facility in southeast Nebraska. Manure was sampled prior to treatment (0 h) and then distributed among glass beakers (250 mL) to accommodate triplicates of three treatments: liming to pH 10, liming to pH 12, and unlimed manure. Following pH adjustment, aliquots of each sample were collected at 1 and 10 h, immediately neutralized with 10 mM HCl and stored at -80°C for subsequent analysis. In a second manure slurry incubation, triplicate PEDv-positive manure samples collected from a commercial swine operation in south central Nebraska site in December 2016 were mixed in equal portion (w:v) with distilled water to mimic manure slurry consistency observed in swine production pit storages. Quicklime was added stepwise (0.25 g addition) to each manure slurr! y sample with continuous stirring to gradually increase manure slurry pH. After each addition of quicklime, pH was measured and an aliquot of manure slurry was collected for subsequent quantitative PCR PEDv enumeration and infectivity in a pig bioassay.

Long-term manure and soil incubation. Initial tests determined appropriate initial soil moisture contents (representing a ‘dry’ and ‘moist’ soil condition) and manure:soil ratios (1 g slurry:3 g soil) to best represent the manure:soil within an injection furrow when slurry is injected into soil, and appropriate liming source (ag lime vs. quicklime). PEDv-positive manure slurry collected from a commercial swine operation in southeast Nebraska was divided between two 3-L containers, one for limed treatment (LIME) and the other for the control, or no-lime, treatment (CNL). Quicklime (30 g) was added to one 3 L portion (equivalent to an application of 80 lbs. quicklime per 1000 gallons of slurry) to achieve a final pH of 12. Both treated and untreated slurry stocks were incubated at room temperature for 24 hours. Distilled water was added to two soils, a silty clay loam (pH 7.0) and a loamy fine sand (pH 6.9), to attain 10% and 30% water holding capacity! (dry and moist soil condition). Thirty grams (dry weight) of soil was apportioned to multiple 50 mL screw top conical tubes and a cavity was made in the center of the soil by pressing a 10 mL pipet tip into the soil. Ten mL of slurry (LIME or CNL) were then added to each soil tube via pipet. Four replicate tubes were immediately frozen at -80°C for each combination of soil, moisture, and manure treatment to represent initial soil application (day 0). The tubes were loosely capped and placed into one of three incubators operated independently throughout the trial to simulate soil temperatures between November 1 and May 1 at one of three geographic locations: southern Minnesota, northern Missouri, and central Oklahoma (Figure 1). Twenty replicate tubes were created for each combination of soil, moisture, incubation, and manure treatment, and a set of four tubes were collected for each treatment combination on days 30, 60, 90, 120 and 150 of the incubation and immediately transfer! red to a -80°C freezer for storage.

Molecular detection and quantification of PEDv. Prior to analysis, soil and manure samples were removed from -80°C storage and allowed to thaw at room temperature. The RNA in each sample was extracted using the RNA PowerSoil Total RNA Isolation kit (Mo Bio, Carlsbad, CA). PEDv was detected in samples by reverse transcription and quantitative polymerase chain reaction (RT-qPCR).

Swine bioassay. To confirm that conditions yielding a PCR negative result actually inactivated the PED virus and rendered the manure non-infectious, a live pig bioassay was conducted with the limed and non-limed manure slurry samples from the initial short-term manure slurry incubation (quicklime addition). Fifteen pigs, approximately 21 days old, were sourced from a high-health facility whose dams tested negative for PEDv antibodies and virus by PCR. Piglets were tested for PEDv upon arrival and confirmed negative. Piglets were randomly assigned to individual housing in BSL-2 rooms at the University of Nebraska-Lincoln Life Sciences Annex as follows: control (3 piglets), pH 10 (6 piglets), and pH 12 (6 piglets), and allowed to acclimate for three days. Each pig was then administered a 10-mL oral gavage of manure slurry: three piglets in the control room received one of the three un-limed slurry samples; six piglets in the pH 10 room received one of the six limed (pH 10) sl! urry samp les (three limed for 1 h and three limed for 10 h); and six pigs in the pH 12 room received one of the six limed (pH 12) slurry samples (three limed for 1 h and three limed for 10 h). Piglets were monitored for fecal shedding of PEDv for four days until control animals began to demonstrate clinical signs of PEDv infection, at which time all piglets were humanely euthanized. Fecal swabs, and duodenum, ileum, jejunum, and cecum samples were collected from each animal and fixed in formalin. All fecal and tissue samples were analyzed for the presence of detectable PED virus by immunohistochemistry and PCR.

PEDv, log # g soil

What have we learned?

Manure Slurry Incubation: Manure limed to pH 10 and pH 12 for 1 and 10 h yielded no detectable PEDv RNA. Live swine bioassay results confirmed that these samples were not infective while control samples resulted in PEDv infection of piglets. These results indicate that a final manure slurry pH of 10 (equivalent to 50 lbs. of quicklime added to 1000 gallons manure slurry) is sufficient to reduce PEDv RNA to an undetectable concentration after 1 hour of contact time. All pigs receiving limed manure (pH 10 or 12 maintained for 1 or 10 h) during the live swine bioassay tested negative for PEDv infection while control pigs (un-limed treatment) all tested positive for PEDv infection (Figure 1). The pig bioassay results confirmed that the PCR assay is a reliable predictor for the presence of infectious PEDv in these matrices and that lime addition to achieve pH 10 for just one hour is sufficient to deactivate the virus in stored manure.

Soil Incubations: At the completion of the long-term (150-day) soil incubation, a subset of the frozen samples (LIME and CON soil samples collected on day 0 and 30) was selected for RNA extraction and qPCR analysis. The qPCR results from days 0 and 30 yielded no detectable PEDv RNA in either the limed or un-limed manure-amended soils (Figure 1). Furthermore, manure-amended soils did not differ from soil-only controls even though PEDv RNA was still detectable in the original manure slurry at high concentrations. No differences in PEDv abundance were detected on either day when initial soil moisture (10% vs 30% water holding capacity), incubation condition (MN vs. MO vs. OK), or soil type (silty clay loam and loamy fine sand) were varied. For these soils, the concentration of PEDv in limed or un-limed manure decreased immediately to a non-detectable level. These results indicate that manure-amended soil with pH 6.9 or greater is not a vector for transmission of the PED virus.

A consistent finding from all of the studies is that pH of media (slurry or soil) strongly influences PED virus survival.

Future Plans

Additional studies are underway to identify the lowest pH at which the PED virus is rendered non-infectious in slurry manure.

Corresponding author, title, and affiliation

Amy Millmier Schmidt, Assistant Professor, Departments of Biological Systems Engineering and Animal Science, University of Nebraska – Lincoln

Corresponding author email

aschmidt@unl.edu

Other authors

Stevens, E., A. Schmidt, D. Miller, J.D. Loy and V. Jin

Additional information

Dr. Amy Millmier Schmidt, corresponding author, can also be reach at (402) 472-0877.

Acknowledgements

Funding for this research was provided by the National Pork Board. Gratitude is extended to Ashley Schmit for assistance with laboratory activities and animal care. Special thanks to the Nebraska pork producers who granted access to their farms for collection of PEDv-positive manure.

Integrating Small Scale Digestion Systems in Developing Regions


Proceedings Home W2W Home w2w17 logo

Purpose           

People in developing countries regularly lack access to energy or their energy source is not reliable. Low cost anaerobic digestion systems have the potential to provide methane to be used in a variety of end uses. Unfortunately, many low cost systems are not evaluated and it is unclear if they are living up to the expectations of the end users or those that are promoting or financially supporting their installation.

What did we do? 

We have evaluated multiple small scale anaerobic digestion systems in Uganda and Bolivia to assess their energy production potential, impact of digestate as a fertilizer (using plot studies), pathogen reduction through the digester, and impact to kitchen air quality when biogas stoves replace firewood. Based on feedback we have also designed, tested and implemented a low cost separation system for handling digestate to recycle separated liquids and improve handling of solids. We have also modified an absorption chiller to run on biogas and are in the process of wider spread adoption and evaluation.

What have we learned? 

Throughout this assessment we have learned that many institutional level digestion systems in developing countries are not meeting the biogas demands of the end users. While they like the improved cooking time and reduced air quality impacts in the kitchen, only small households are producing enough gas to realize many of these benefits. Biogas poses a reduction in PM2.5 (fine particulates) within kitchens when compared to firewood stoves. However, when any amount of firewood is used in the kitchens (when there is not enough biogas), much of this benefit is lost. Therefore it is critical to improve the biogas production of these systems.

Maize plot trials show that compared to control plots digestate applied in any form (slurry or separated solids) significantly improves yields. When compared to inorganic fertilizer applications the grain yields are statistically similar but the stover yields increase significantly. End users show a preference for using the separated solids and the reduction in water needed to operate the systems. While these benefits seem appealing, there may be concern for the risks associated with pathogens in the digestate when applied to food crops. While digesters showed a significant reduction in pathogen related to the system retention time, pathogen remained in the effluent and must be handled properly to limit transfer to food and the human health risks after ingestion.

Increasing the end use of biogas beyond cooking to chillers has shown great potential for implementation and has high demand for end users. Systems have been able to provide cooling at multiple locations for extended periods with low biogas demands. Additional materials are needed to provide end users with guidance on troubleshooting and operation.

Future Plans    

Based on the results of these studies we are moving forward with farmer trials of the digestate to assess end user issues and motivations. In addition, we are currently designing a low cost heating system to improve biogas production efficiency in order to meet end user needs or decrease the size of digesters. Finally we are working on an evaluation of chiller biogas needs and providing training on all aspects of the digestion systems.

Corresponding author, title, and affiliation      

Rebecca Larson, Assistant Professor at the University of Wisconsin-Madison

Corresponding author email    

rebecca.larson@wisc.edu

Other authors   

A. McCord, Associate Director at University of Wisconsin-Madison, Vianney Tumwesige, CEO at GreenHeat Uganda, Dorothy Lsoto at W2E Uganda

Additional information              

http://www.greenheatinternational.com/

http://www.waste2energyltd.com/

McCord, A.I., S.A. Stefanos, V. Tumwesige, D. Lsoto, A. Meding, A. Adong, J.J. Schauer, and R.A. Larson. 2017. Biogas and the impacts of fuel choice on institutional kitchen air quality in Kampala, Uganda. Indoor Air. In Review, revisions requested.

McCord, A.I., S.A. Stefanos, V. Tumwesige, D.T. Lsoto, M. Kawala, J. Mutebi, I. Nansubuga, and R.A. Larson. 2017. Anaerobic digestion and public sanitation in Kampala: risks and opportunities. In Review.

Developing a Comprehensive Nutrient Management Plan (CNMP)

Proceedings Home W2W Home w2w17 logo

Purpose

Livestock producers are presented with a number of challenges and opportunities. Developing a quality Comprehensive Nutrient Management Plan (CNMP) can effectively help landowners address natural resource concerns related to soil erosion, water quality, and air quality from manure management. As livestock operations continue to expand and concentrate in certain parts of the country, utilizing a CNMP becomes even more important. Following the NRCS 9-step planning process is critical in developing a good plan. Effective communication is a key element between all parties involved in the planning process. A CNMP documents the decisions made by the landowner for the farmstead area, crop and pasture area, and nutrient management. Information will cover the elements essential for developing a quality CNMP.

What did we do?

Since the CNMP documents the records of decisions by the landowner, it has to be organized in such a fashion that it is understandable to and usable by the landowner. The CNMP is the landowner’s plan. Therefore, the role of the planner is to help landowners do the things that will most benefit them and the resources in the long run. This will take both time and effort. To provide consistency with other conservation planning efforts within NRCS, CNMPs following the same process outlined in the National Planning Procedures Handbook. There are several items that are essential for a quality CNMP to be developed:

• Have a good understanding of potential resource concerns especially soil erosion, water quality and air quality.

• Make the appropriate number of site visits. Trying to do this from the office will likely lead to a poor quality CNMP that may not be implemented.

• Address resource concerns for the Farmstead and Crop and Pasture areas.

• Ensure that all nutrient sources are addressed.

• Follow the 9 steps of planning.

• Decisions are agreed upon by the landowner. The CNMP reflects the landowner’s record of decisions.

• Follow-up to address any questions or concerns.

• Update as necessary. A CNMP is not a static document.

Field

Land application of animal manure without proper land treatment practices

Muddy field with standing water

Proper animal manure storage required to address water quality issues

Picture of lined water bed

Evaluation of storage area to adequately address surface and subsurface
water quality issues

Picture of tractor and tanker spreader

Land application and nutrient management are critical elements for a
properly prepared CNMP

What have we learned?

The quality of CNMPs varies greatly across the country. Some were becoming so large that landowners were having difficulty finding the activities that needed to be completed. The revised CNMP format and process following the NRCS Conservation Planning approach should improve both the quality and usability of the plans developed. Due to statutes in the Farm Bill, all conservation practices recorded in the record of decision of the CNMP, whether receiving financial assistance or not, must be implemented by the end of the established contract period between the landowner and NRCS. Therefore it is important to only include the practices that are going to be implemented. CNMPs should be periodically updated to account for operational changes such as animal numbers, cropping systems, or land application methods.

Future Plans

The CNMP planning process will be evaluated to determine whether landowner objectives are being met and resource concerns properly addressed. Additional evaluations will look at the consistency of the plans generated across the country and the usability by landowners.

Corresponding author, title, and affiliation

Jeffrey P. Porter, P.E.; National Animal Manure and Nutrient Management Team Leader, USDA-Natural Resources Conservation Service

Corresponding author email

jeffrey.porter@gnb.usda.gov

Additional information

References

USDA-NRCS General Manual – Title 190, Part 405 – Comprehensive Nutrient Management Plans

USDA-NRCS Handbooks – Title 180, Part 600 – National Planning Procedures Handbook

Code of Federal Register (CFR) Title 7, Part 1466 – Environmental Quality Incentives Program (1466.7 EQIP Plan of Operations and 1466.21 Contract Requirements)

Webinar

Comprehensive Nutrient Management Plans and the Planning Process – http://www.conservationwebinars.net/webinars/comprehensive-nutrient-management-plans-and-the-planning-process/?searchterm=cnmp

The authors are solely responsible for the content of these proceedings. The technical information does not necessarily reflect the official position of the sponsoring agencies or institutions represented by planning committee members, and inclusion and distribution herein does not constitute an endorsement of views expressed by the same. Printed materials included herein are not refereed publications. Citations should appear as follows. EXAMPLE: Authors. 2017. Title of presentation. Waste to Worth: Spreading Science and Solutions. Cary, NC. April 18-21, 2017. URL of this page. Accessed on: today’s date.

Innovative Business Models for On-farm Anaerobic Digestion in the U.S.

Proceedings Home W2W Home w2w17 logo

Purpose

AgSTAR is a collaborative voluntary program of the Environmental Protection Agency (EPA) and United States Department of Agriculture (USDA). AgSTAR promotes the use of anaerobic digestion (AD) systems to advance economically and environmentally sound livestock manure management. AgSTAR has strong ties to industry, government, non-profit and university stakeholders and assists those who enable, purchase or implement anaerobic digesters by identifying project benefits, risks, options and opportunities.

Anaerobic digestion (AD) continues to be a sustainable manure management opportunity with growing interest in innovative business models for project development.   AD systems provide a number of benefits, including improved nutrient management, locally sourced renewable energy, and diversified revenue streams for farmers.   As energy prices remain low across the country, and interest grows in managing food waste and organics outside of landfills, new business models have been implemented to make these on-farm AD projects viable. This presentation will provide a national overview of the livestock AD sector, explore new AD projects across the U.S., and highlight successful projects with innovative business models.

The presentation will cover several case studies of AD projects on topics including:

  • Third-party ownership and development of projects;
  • Food waste collection and boosting project profitability through tip fees and increased biogas production;
  • Eco-market products from dairy manure fibers; manure-based alternatives to peat moss for the horticulture industry; and
  • Biogas to vehicle fuel; opportunities and financial considerations.

With only 244 operating on-farm AD projects across the U.S., there exists a great opportunity for market share growth at the approximately 8,000 farms that could support a project. This, coupled with the desire for alternative management of organic waste streams, provides a unique opportunity for this sector to grow in the near future.

Pigs in a fieldCows in a field

Corresponding author, title, and affiliation

Nick Elger

Program Manager

AgSTAR & Global Methane Initiative

U.S. Environmental Protection Agency

1201 Constitution Ave NW, Mail code: 6207J

Washington, D.C. 20460

Phone: 202.343.9460

Email: elger.nicholas@epa.gov

https://www.epa.gov/agstar

https://www.globalmethane.org/

Effects of pH on Urease Activity in Swine Urine and Urea Solution

Proceedings Home W2W Homew2w17 logo

Purpose

A major source of pollution and loss of nutrient value from animal manure results from the conversion of urea nitrogen into ammonia by the naturally occurring urease enzyme in solid/liquid waste streams. Studies often focus on either urease inhibition in soil to prevent the volatilization of applied urea fertilizer or recovery of ammonia from wastewater, but few have studied urease inhibition in manure slurry directly from the barn. If the urea in fresh urine can be preserved at the source it would prevent the volatilization of ammonia that represents the loss of a valuable nutrient as well as the adverse effects of ammonia on livestock, humans and the environment. Our study investigated methods of inhibiting urease activity in fresh swine urine to preserve the urea nitrogen content during storage, processing and transport.

What did we do?

The study was comprised of 4 experiments:

1) Jack bean urease was introduced to a 1M aqueous urea solution and fresh swine urine. Samples were taken hourly for five hours and lab tested for total ammoniacal nitrogen (TAN) to compare urease activity of the urea solution with that of actual urine.

2) Using the same 1M urea solution, the effects of pH < 3.0 and pH > 12.0 on urease activity was measured relative to the commercially available inhibitors N-(n-butyl) thiophosphoric triamide (NBPT), salicylhydroxamic acid (SHAM), and Thymol (a phenol obtained from thyme oil or other volatile oils). Each treatment was sampled weekly for Total Kjeldahl Nitrogen (TKN), TAN and pH over six weeks to see which treatment best preserved urea nitrogen.

3) To determine if a smaller pH adjustment would be an effective inhibitor, we compared the activity of urease in a 1M urea solution across a pH range from 4.0 to 11.0. This was done by either lowering the pH of the urea solution with 0.1N sulfuric acid or raising it with 0.5N sodium hydroxide. The samples were tested at 7 days for pH, TKN and TAN.

4) Finally, we explored the effect of pH < 3.0 and pH > 12.0 on urease activity in swine urine to compare the effect with that in the urea solution. The initial pH, TKN and TAN of the swine urine was observed relative to the pH and concentrations of samples taken at 7 days and 14 days.

What have we learned?

Figure 1: A comparison of total ammoniacal nitrogen (TAN) concentrations indicates similar urease activity in swine urine and urea solution

1) The conversion of urea nitrogen to ammonia (as measured by TAN) follows a similar trend in both a urea solution and freshly collected sow urine (Figure 1). This indicates that a urea solution may be an acceptable alternative for testing urease inhibition when fresh urine is not available.

2) In a comparison of NBPT, Thymol, and SHAM to pH < 3.0 and pH > 12.0, it was observed that the high and low pH had the most significant inhibitory effect on urease enzyme activity, as almost none of the TKN in the samples observed over a 6-week study period was converted to TAN, relative to the other inhibitors tested (Figure 2).

Figure 2: Average increase of TAN from urease activity in urea solution using five different inhibitor treatments over a 6-week period

3) Testing a range of nominal pH values between 4.0 and 11.0 it was observed that while urease enzyme remained active over a 2 week period across all values, activity declined with an increase or decrease in pH from the highest activity observed at pH 7.0. However, at a pH below 3.0 the urease enzyme was completely denatured and could not be restored by increasing the pH.

4) When testing high and low pH on swine urine it was observed to have a similar inhibitory effect on urease activity compared with the urea solution, that the effect is lasting over 14 days, and that the high pH is slightly more effective than the low pH (Figure 3).

Figure 3: Analysis of urease activity as indicated by increase in TAN in swine urine at low and high pH. Results indicate urease inhibition treatment is most effective at pH 2.5 and ph &gt; 12.0

Future Plans

A follow up study will be conducted using a pilot scale scraper separation system to collect fresh urine from about 30 swine through a 16 week growing cycle. We will be testing urea preservation using 3 different inhibitor treatments including pH > 12, pH < 3 and the commercial soil urease inhibitor, NBPT. We will also study the effect of UV light on urease activity during the control periods. The experiment will be repeated for each inhibitor over 3 feeding phases to simulate grower farm conditions.

Corresponding author, title, and affiliation

Alison Deviney, Graduate Research Assistant at Biological and Agricultural Engineering Department, North Carolina State University

Corresponding author email

avdevine@ncsu.edu

Other authors

John J. Classen, Ph.D. and Mark Rice, Extension Specialist at Biological and Agricultural Engineering Department, North Carolina State University

Additional information

Alison Deviney

Biological and Agricultural Engineering Department

North Carolina State University

Raleigh, NC 27695

Acknowledgements

Jason Shye and Dan Wegerif, Managing Members

Waste 2 Green, LLC, Cocoa, Florida, USA

Review of Odor Management Planning Templates and Calculators Across the US

Proceedings Home | W2W Home waste to worth 2017 logo

Purpose

Odor is a common and prevalent problem for new and existing livestock operations, and odor is often a source of conflict between neighbors. Odor cannot be removed in entirety from livestock production, but it can be managed. A few states have developed odor management plan guidelines or templates that may be mandatory, or voluntarily for the sake of good stewardship. Our long term goal is to construct an odor management plan template for South Dakota and beyond, and improve producer-neighbor relationships. Towards this goal, we present a review of established tools, templates and odor impact calculators that are in use in the United States.

What did we do?

We sent a questionnaire to four odor management plan (OMP) developers in Minnesota, Michigan, Nebraska and Pennsylvania. The questionnaire asked questions about the development process, users, marketing, and evaluation of odor management planning guides. We compared and contrasted the responses and identified opportunities to build on these past experiences elsewhere. Similarly, based on existing literature and online tools, four odor impact estimation calculators, or footprint tools were reviewed. These include the South Dakota Odor Footprint Tool, Odor From Feedlots Setback Emissions Tool (Minnesota), Odor Footprint Tool (Nebraska), and Purdue Odor Setback Model (Indiana).

What have we learned?

From the questionnaire it was clear that though an odor management plan is not a mandatory requirement in most of the states surveyed, the developers produced these guides for the betterment of the livestock industry of their state. During development of the OMPs, there was little exchange between producers, neighbors or policy makers collectively. Also, the use, evaluation and impact of the OMP templates was not tracked. There was not extensive marketing for the odor management plan guides aside from extension news updates and some presentations.

The pattern or format of the OMPs from the four different states was similar. Documentation of odor sources and record keeping of odor complaints was encouraged in all with a tabulated form. Michigan’s was the only guide to suggest quantitative estimation of odor impact, even though there are some nice and effective tools available to make these calculations for most states and regions. Odor monitoring was suggested in two states and one state suggested third party monitoring keep the assessment unbiased. Table 1 presents an overall review of questionnaire findings for the four states surveyed.

Table 1. Summary of responses for select questions posed to developers of odor management planning (OMP) templates or guides

All four odor footprint tools were compared based on the odor emission estimates and dispersion model incorporation. Two of the tools considered terrain factors in odor dispersion calculations. Additional comparisons are shown in Table 2.

Table 2. Comparison of odor setback/odor footprint estimation tools

Future Plans

Building off of the feedback from OMP developers in other states, we plan to engage multiple interest groups in identifying the scope, use and dissemination of an OMP developed for South Dakota. There will be an emphasis on conflict resolution in the event of odor complaints so that odor complaints can be resolved locally (between neighbors) as much as possible.

Corresponding author, title, and affiliation

Suraiya Akter, Graduate Research Assistant, Agricultural and Biosystems Engineering, South Dakota State University

Corresponding author email

suraiya.akter@sdstate.edu

Other authors

Erin Cortus, Associate Professor and Environmental Quality Engineer, Agricultural and Biosystems Engineering, South Dakota State University

Additional information

erin.cortus@sdstate.edu

Acknowledgements

We would like to thank Dr. Jerry May (MSU), Mr. David Schmidt (UMN), Mr. Karl Dymond (Pennsylvania State), Dr. Richard Koelsh (UNL) for their kind response to the questionnaire.

Are Models Useful for Evaluating or Improving the Environmental Impact of Pork Production?

green stylized pig logo

Models are basically equations that are based on real-world measurements. Measurements are made in different situations and/or different times. Models are used to make comparisons between different choices or look at “what if” scenarios without having to implement each possible option.

Generally, models that are created with large, diverse (but still compatible) data sets containing relevant information are going to be more reliable than models with smaller data sets with smaller data sets. Models can then be used to predict performance or evaluate changes in a system.

There are very good reasons to use models when looking at the environmental footprint of pork production:

  1. Efficiency. It is expensive and impractical to measure actual emissions from every farm or barn.
  2. Decision-making. Models allow farmers and their advisers to look at “what if?”. Prior to making an expensive decision, farmers can evaluate the location, type of building, manure storage, manure treatment, feed ration, etc. and select the best option.
  3. Measure progress trends. Models can be applied at different points in time to see if a farm or industry is making progress in reducing their impacts.

Are there limitations to models?

Yes. By their very nature, models are a simplified representation of a complex system. Modeling is a balance between complexity (how much information does the user need and how much time will it take?) and accuracy (how much is gained by including additional variables?).  The results must be evaluated in their appropriate context. As an example, many TV weather forecasters look at several sources of information, including models when formulating their forecast. While on a given day the forecast may be off (either due to inaccurate analysis or results) it is safe to say that overall, weather forecasting is greatly enhanced by the use of models.

Do you have an example of a model used on pig farms?

One example of a model that is currently looking at the environmental footprint of pork production is the Pork Production Environmental Footprint Calculator.  It currently estimates greenhouse gas (GHG) emissions and the day to day costs of the activities that generate those emissions, but research is underway to expand the model to include land,  and water footprints–leading to a more comprehensive “environmental footprint” model.

The model referenced above can be used for estimating the GHG emissions from the various operations on a pig farm in order to calculate the farm’s cumulative emissions. It shows where the major contributions arise, and provides a test bed for identifying strategies that reduce emissions at least cost. The model requires input information that most producers will know about their operation such as the type of barn, animal throughput, type and quantity of feed ration used, a physical description of the facilities (size of barn, insulation, fans etc.), the time in the barn, temperature profile for that area, type of manure management system (lagoon, dry lot, pit, etc.).  Sample costs for day to day farm activities are provided in the model, but can be updated by the user. The model output includes a summary of feed and energy usage for the simulation, including energy estimates for temperature control (both heating and ventilation) as well as costs.

Authors: Jill Heemstra, University of Nebraska jheemstra@unl.edu and Rick Fields, University of Arkansas rfields@uaex.edu

Reviewers: Dr. Jennie Sheerin Popp, University of Arkansas, Dr. Karl Vandevender, University of Arkansas

For More Information:

Acknowledgements

This information is part of the program “Integrated Resource Management Tool to Mitigate the Carbon Footprint of Swine Produced In the U.S.,” and is supported by Agriculture and Food Research Initiative Competitive Grant no. 2011-68002-30208 from the USDA National Institute of Food and Agriculture. Project website.