This webinar will examine how black soldier fly larvae (BSFL) can transform food and agricultural waste into valuable products for both animal feed and soil health. Presenters will discuss large-scale BSFL production, the frass co-product, and how nutrient content can vary based on inputs and processing. This presentation was originally broadcast on August 15, 2025.Continue reading “Flies, Frass, Feces, and Fields”
Poultry production is the number one agricultural enterprise in value of production for South Carolina with approximately 280,000,000 birds in inventory. Poultry litter as a by-product of poultry production is a low-cost fertilizer that can provide nitrogen (N), phosphorus (P), potassium (K), and micronutrients for forage systems. Poultry litter can improve soil fertility and health by adding organic matter and enhancing water infiltration and soil fertility over time on more than 300,000 acres of forages in South Carolina.
Yet, despite purported benefits to the pasture system and use as a fertilizer to improve forage, questions remain for livestock producers looking to apply poultry litter to their pastures. There is a lack of information about the availability, cost, and quality of litter. With the increase in interest in poultry litter applications as a climate-smart agricultural practice or to participate in conservation programs, this work is expected to assist regional producers in understanding poultry litter attributes and inform purchasing decisions.
What Did We Do?
Using a dataset of 68 producers utilizing poultry litter and the corresponding transactions, we characterize the availability and market for poultry litter in South Carolina. Data on transactions, including prices paid, delivery date, application rate, and county-level location of litter, forms the basis for analysis. Also, we use sample analysis results to compare nutrient price with commercial fertilizer nutrient values.
What Have We Learned?
Of the 68 producers reporting data, 45 reported detailed price, location and application information. An exploration of prices paid per ton of litter across the state suggests differences based on location (Table 1). Based on the results of a t-test, higher prices are observed for the mid-state compared to the upstate (statistically significant at 6% level for two tail t-test). Differences in prices observed by season appear but are not statistically significantly different based on ANOVA tests.
Table 1: Average price per ton of litter based on region of the farm and season applied.
Midstate (n=20)
Upstate (n=25)
Average
Fall
25.55
22.32
23.30
Spring
32.13
22.55
28.02
Summer
22.31
—
22.31
Winter
—
19.33
19.33
Average
27.37
22.02
24.40
Other findings from the data could be helpful to design outreach and assist producers looking to purchase litter for their operation. Some other interesting information includes the type of litter: broiler, layer, turkey, and other sources. Also, of the producers in the sample, 19 were unable to find litter with the majority of producers located in the Upstate area (74%).
Next, for the approximately 40 samples that included nutrient analysis, a summary of mean and standard deviation of pounds per ton of ammonium N, organic N, P205 and K20 are given in Table 2. From prices reported by each producer, the cost per pound of nutrient is also calculated. From here, average fertilizer and nutrient prices were gathered for South Carolina and displayed in Table 3. Similar costs can be seen when comparing the average cost per pound for each nutrient (Table 2) to the average price per pound for commercial fertilizers (Table 3). For example, the average cost of a pound of ammonium N from the poultry litter sources was $2.46/lb and $2.45/lb from commercial sources.
Table 2: Summary statistics of nutrient analysis from 40 samples.
Nutrients
Ammonium N (lbs./ton)
Organic N (lbs./ton)
P205 (lbs./ton)
K20 (lbs./ton)
n
41
40
42
42
mean
10.04
50.21
47.15
51.65
std dev
3.93
15.09
20.41
21.04
$/#
$2.46
$0.49
$0.52
$0.48
Table 3: Average fertilizer prices for South Carolina by fertilizer type and cost per pound for nutrients N, P, K.
South Carolina Average Fertilizer Prices FY2024
DAP (18%-46%-0%)
Urea (46%)
10-10-10
Potash (60%)
Mean
$881.00
$504.45
$489.00
$482.45
Std. Dev.
$8.02
$13.30
$5.72
$13.05
N ($/#)
$2.45
$0.55
$2.45
$0.00
P ($/#)
$0.96
$0.00
$2.45
$0.00
K ($/#)
$0.00
$0.00
$2.45
$0.40
Source: South Carolina Crop Production Report (Monthly), Livestock, Poultry, and Grain Market News, USDA Agricultural Marketing Service.
Future Plans
Findings and data from this analysis will first be prepared for outreach and dissemination efforts to producers across the state. Information will also be summarized for current enrollees in the grant program. Finally, given that this data was collected as part of a five-year study, data will be collected in subsequent years. Ultimately, a hedonic analysis of poultry litter attributes to help understand differences in price as a result of nutrient attributes, storage conditions, type, and trucking could inform producer sourcing of litter and prices paid.
Authors
Presenting & corresponding author
Nathan B. Smith, Extension Economist, Clemson University, nathan5@clemson.edu
Additional authors
Anastasia W. Thayer, Assistant Professor, Clemson University; Matthew Fischer, Extension Associate, Clemson University; Maggie Miller, Extension Associate, Clemson University.
This material is based upon work supported by the U.S. Department of Agriculture, under agreement number NR2338750004G049.
The authors are solely responsible for the content of these proceedings. The technical information does not necessarily reflect the official position of the sponsoring agencies or institutions represented by planning committee members, and inclusion and distribution herein does not constitute an endorsement of views expressed by the same. Printed materials included herein are not refereed publications. Citations should appear as follows. EXAMPLE: Authors. 2025. Title of presentation. Waste to Worth. Boise, ID. April 7-11, 2025. URL of this page. Accessed on: today’s date.
Due to a technical glitch, we did not get this presentation recorded. Please accept our apologies.
Purpose
The purpose of this study was to determine the effectiveness of lignite, a low-quality coal, and lignosulfonate, a byproduct of paper milling, in reducing ammonia emissions from poultry litter.
What Did We Do?
We utilized a laboratory
acid-trap chamber system to assess the effectiveness of varying rates of lignite and lignosulfonate on ammonia reduction when compared to an industry standard, sodium bisulfate (PLT), and an untreated control. In the volatilization experiment, 12 treatments were tested, including five application rates of lignite and lignosulfonate (0.75, 1.5, 3, 4.5, and 6 kg m-2), PLT, and an untreated control. Acid traps of 0.02 M phosphoric acid were changed 11 times over the 14-day experiment. Acid trap solutions were then analyzed for ammonia to quantify cumulative ammonia emissions.
What Have We Learned?
Both lignite and lignosulfonate were effective in reducing ammonia volatilization in this laboratory setting. While both lignite and lignosulfonate required higher application rates to achieve the same ammonia reduction as PLT, these could be effective alternatives and should be further studied on a larger scale.
Future Plans
While we have no active plans to continue this work, future efforts should include small scale testing in a commercial setting, cost analysis, and sourcing options.
Authors
Presenting & Corresponding author
Stephanie Kulesza, Assistant Professor, North Carolina State University, sbkulesz@nscu.edu
Additional Information
This research is not yet published. Reach out to Stephanie Kulesza at sbkulesz@ncsu.edu if you would like to know more about this work.
The authors are solely responsible for the content of these proceedings. The technical information does not necessarily reflect the official position of the sponsoring agencies or institutions represented by planning committee members, and inclusion and distribution herein does not constitute an endorsement of views expressed by the same. Printed materials included herein are not refereed publications. Citations should appear as follows. EXAMPLE: Authors. 2025. Title of presentation. Waste to Worth. Boise, ID. April 7–11, 2025. URL of this page. Accessed on: today’s date.
Scheduling conflicts, equipment breakdowns, and wet field conditions can wreak havoc on spring manure application and planting schedules. This webinar will provide valuable insights into maximizing the efficiency and timing of manure application for growing crops, especially corn. By exploring innovative techniques for liquid manure application and the potential for in-season poultry litter application, participants will learn possible ways to navigate challenges in crop management while ensuring nutrient efficiency and maintaining crop yield and quality. This presentation was originally broadcast on January 17, 2025. Continue reading “Application of Manure on Growing Crops”
With high input costs in 2022, many farmers are looking for affordable sources of nutrients. Poultry litter is in high abundance in areas of intense poultry production, such as North Carolina. However, a common concern for farmers is whether poultry litter will carry weed seed onto their farms. With the need to better distribute nutrients throughout these areas, the transport of poultry litter is necessary. Overcoming the concern about weed seeds is critical to improve these nutrient imbalances. Therefore, a germination study was conducted on 61 random poultry litters collected across North Carolina to determine the presence of viable weed seeds.
What Did We Do?
A series of 61 poultry litters were submitted to NC State University for testing, collected from industry representatives and Extension Agents across the state. Poultry litters were diluted with potting media to allow for germination of any existing weed seeds at a 9:1 (potting media:litter) ratio on a dry weight basis. Germination studies were then conducted using 20 g of the potting media-litter mix, replicated 5 times. Positive controls included potting media alone, and potting media mixed with poultry litter to verify there was no inhibitory effect of the poultry litter on germination. Both positive controls were spiked with one of three weed species at varying rates: 50 mustard, 50 rye, or 30 sicklepod. Additionally, three subsamples (20 g) of 10 of the poultry litters were wet sieved using three sieves with 2.8-, 1.0-, and 0.4-mm mesh sizes and dried at 35 °C. Seeds were counted under a dissecting microscope, and when located, seeds were removed and tested for viability using the imbibed seed crush test as described by Borza et al. (2007).
What Have We Learned?
Germination studies suggest small numbers of viable weed seeds, as only one seed germinated from unspiked samples. However, total weed counts suggest there can be high total seed numbers in the litters, with an average seed content of 1.17 seeds/100-g. Additionally, approximately 15% of the seeds collected were viable.
Future Plans
We intend to continue researching this topic and hope to further understand the impact of stockpiling, litter management, and handling on viable weed seeds in litter sources.
Authors
Stephanie B. Kulesza, Nutrient Management and Animal Waste Specialist, NC State University
Corresponding author email address
Sbkulesz@ncsu.edu
Additional authors
Ramon Leon, Weed Biology and Ecology Specialist, NC State University
Miguel Castillo, Forage Specialist, NC State University
Stephanie Sosinski, Forage Lab Technician, NC State University
The authors are solely responsible for the content of these proceedings. The technical information does not necessarily reflect the official position of the sponsoring agencies or institutions represented by planning committee members, and inclusion and distribution herein does not constitute an endorsement of views expressed by the same. Printed materials included herein are not refereed publications. Citations should appear as follows. EXAMPLE: Authors. 2022. Title of presentation. Waste to Worth. Oregon, OH. April 18-22, 2022. URL of this page. Accessed on: today’s date.
The objectives of the litter amendment research were to determine why alum applications to poultry litter occasionally fail to reduce soluble phosphorus (P) and to determine if aluminum-, calcium- or iron- based nanoparticles would reduce soluble P in litter when applied alone or in combination with conventional litter treatments used for ammonia control, such as alum and/or sodium bisulfate.
The objective of the scrubber research was to design a scrubber that reduces ammonia, dust, and pathogens in the air inside of animal rearing facilities, like broiler houses, rather than the air being exhausted from the facilities. Currently scrubbers are “end of pipe” technology, which purify the exhaust air, so the only economic benefit is the capture of nitrogen, which is relatively inexpensive. Reducing the ammonia, dust, and pathogens in the air inside poultry houses should result in production benefits, such as those found with litter amendments (improved weight gains, better feed conversion, lower susceptibility to disease, and reduced propane use).
What Did We Do?
A series of laboratory studies were conducted with various litter amendments. The first study was conducted using litter from a commercial broiler house that had been treated with sodium bisulfate ten times over a two year period. Poultry litter (20 grams) was weighed out into 6 centrifuge tubes and half of the litter samples were treated with alum at a rate of 5% by weight. The tubes were incubated in the dark for one week, then extracted with 200 ml deionized water for one hour, centrifuged for 15 minutes at 8,000 rpm, filtered through 0.45 um filter paper and analyzed for soluble reactive phosphorus (SRP) using the Murphy-Riley method on an autoanalyzer.
The next four lab studies used the same basic incubation studies, although the litter that was used came from a pen trial we had conducted where we knew the litter had never been treated with sodium bisulfate. Eighty six different treatment combinations involving conventional ammonia control treatments, such as alum and sodium bisulfate with or without the addition of different types of nanoparticles were used. The nanoparticles used in this study were: (1) Al-nano – an aluminum based nanoparticle, (2) Fe-nano – an iron based nanoparticle, (3) MNP – a nanoparticle made of both aluminum and iron, and (4) TPX – a calcium silicate based nanoparticle made by N-Clear, Inc. The sodium bisulfate that was utilized is sold under the tradename PLT (Poultry Litter Treatment) by Jones-Hamilton, Inc.
We also redesigned the ARS Air Scrubber so that it is scrubbing the air inside poultry houses rather than the exhaust air. The critical design feature to allow this was the use of fast sand filters to remove all particulates from the water and acid used to scrub dust and ammonia, respectively.
What Have We Learned?
We found that alum failed to lower soluble P in poultry litter when the litter had been treated with sodium bisulfate, probably due to the formation of sodium alunite [NaAl3(OH)6(SO4)2], a mineral often found in acid soils where sulfate applications have occurred. The formation of this mineral likely inactivates the Al with respect to P adsorption or precipitation reactions.
We also found that a Ca-based nanoparticle (TPX) was very effective in reducing soluble P in litter, either when applied in combination with alum or sodium bisulfate. Surprisingly, when TPX was applied with sodium bisulfate at very low levels, the soluble P levels of sodium bisulfate-treated litter decreased from 3,410 mg P/kg (when added alone) to 1,220, 541, and 233 mg P/kg litter, respectively, when 0.25, 0.5, and 1% TPX was added with sodium bisulfate.
Future Plans
We are currently conducting a large pen trial to determine the effect of TPX nanoparticles applied with alum or sodium bisulfate on ammonia emissions, soluble P, and P runoff from small plots using rainfall simulators.
We are also building a full-scale prototype of the indoor ammonia scrubber so that we can begin to test the efficacy of this scrubber.
Author
Philip A. Moore, Jr., Soil Scientist, USDA/ARS, Fayetteville, AR
Philip.Moore@USDA.Gov
Additional Information
Moore, P.A., Jr. 2021. Composition and method for reducing ammonia and soluble phosphorus in runoff and leaching from animal manure. U.S. Patent Application No. 17/171,204. Patent pending.
Moore, P.A., Jr. 2022. A system for removing ammonia, dust and pathogens from air within an animal rearing/sheltering facility. U.S. Patent Application No. 17/715,666. Patent pending.
The authors are solely responsible for the content of these proceedings. The technical information does not necessarily reflect the official position of the sponsoring agencies or institutions represented by planning committee members, and inclusion and distribution herein does not constitute an endorsement of views expressed by the same. Printed materials included herein are not refereed publications. Citations should appear as follows. EXAMPLE: Authors. 2022. Title of presentation. Waste to Worth. Oregon, OH. April 18-22, 2022. URL of this page. Accessed on: today’s date.
This webinar introduces current and future industry-based initiatives for environmental sustainability in the livestock and poultry sector, and how Livestock and Poultry Environmental Learning Community learners can play a critical role in their region. This presentation was originally broadcast on September 17, 2021. Continue reading “Industry Initiatives for Environmental Sustainability – a Role for Everyone”
Over the last 15 years it has become common to build new poultry production facilities on a piece of property that will provide the necessary land area for all of the barns and support facilities, and that comply with the setbacks (i.e. surface water, nearest neighbors) required by local, state, and federal regulations. The manure management plan in such cases depended on the transport of poultry manure to remote cropland that was often not owned and managed by the poultry producer. In some states, the law held the poultry producer legally responsible for any possible environmental consequences associated with irresponsible spreading or handling. Such laws tended to limit transport distances due to the lack of liability transfer. In other states, like South Carolina, poultry manure brokers were required to have a state permit that allowed for the transfer of liability from the producer to the broker by means of a contract. The broker became liable for proper application rates, adherence to setback requirements, application at agronomic rates, and other state requirements. While transfer of liability did encourage the movement of manure from nearby fields with high soil-test phosphorous contents to remote fields that could benefit from all plant nutrients in manure it also gave rise to an increase in the number or farms that were permitted with manure brokerage as the only manure nutrient management alternative.
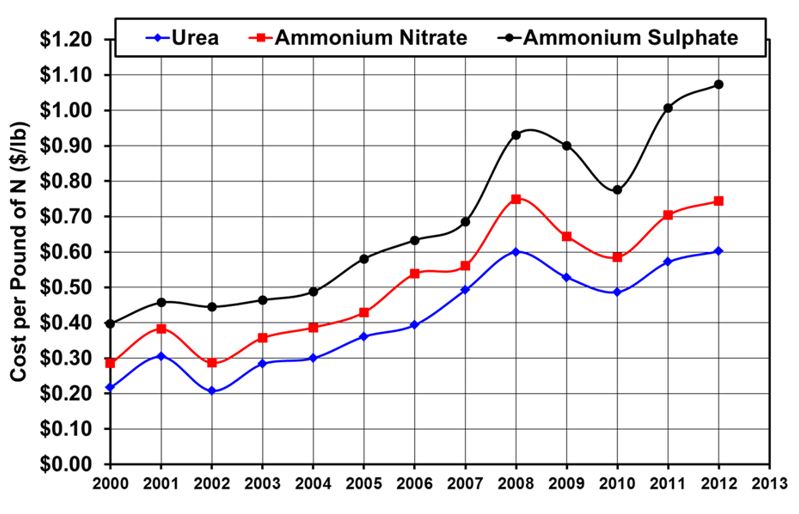
During the period from 2002 to 2008 when many new poultry farms were being built the average prices of N, P2O5, and K2O were increasing due to surges in fuel prices. Nitrogen prices increased in a linear manner from 29 to 75 cents per pound or a 2.6 fold increase in price (Table 1 and Figure 1). Prices of the other major nutrients, P2O5 and K2O, increased by over a factor of 3 for the same six year period (Figure 2). Such increases in the cost of fertilizers greatly increased demand for poultry manure, and further encouraged poultry producers to build barns that depended on brokerage as the only manure management option without any considerations of potential decreases in manure value. In recent years, fertilizer prices have decreased and brokerage of manure is not as attractive. The objective of this study was to determine the impact of fertilizer price fluctuations on the value of broiler litter, high-rise layer manure, turkey grow-out litter, and turkey brooder litter.
Table 1. Fertilizer composition information and equation used to convert price per ton to price per pound.
Fertilizer Description
Nutrient Content Per Ton of Fertilizer
Urea – 46% N by weight
920 lb N/ton
Ammonium Nitrate – 34% N by weight
680 lb N/ton
Ammonium Sulfate – 21% N and 24% by weight
420 lb N/ton
Conc. Super-Phosphate – 46% P2O5 by weight
920 lb P2O5 /ton
Potassium Chloride – 60% K2O by weight
1200 K2O / ton
Equation Used to Convert Fertilizer Price to Price per Pound of Nutrient
$ / lb Nutrient = $ / Ton of Fertilizer÷ lb Nutrient / Ton
Figure 1. Variation in nitrogen prices based on national averages from 2000 to 2012 (USDA-ERS, 2013).
Figure 2. Variation in P2O5 and K2O prices based on national averages from 2000 to 2012 (USDA-ERS, 2013).
What did we do?
Fertilizer Nutrient Content of Poultry Manure
The type of poultry raised in a building and the amount of bedding used causes a wide variation in the plant nutrient content of the manure removed from the building. The manure composition used in the study was taken from data obtained in South Carolina and is shown in Table 2. Broiler litter and turkey grow-out litter were the most similar since pine shavings were used as bedding and several flocks of birds were grown-out on the litter prior to building clean-out. Clean-out frequency varies greatly from every 1 to 1.5 years. The data shown in Table 2 corresponded to annual litter clean-out. The moisture contents (MC) of these two litters were also similar (24% for the broiler litter and 26% for the turkey grow-out litter). Turkey production begins on a brooder farm where chicks are placed, brooded, and the poults are transported to a grow-out farm. These farms are unique in that the litter was completely changed after each flock. The result is that litter from a brooder farm is much drier (14% moisture content) and contains less manure than any other type of poultry manure. The lower manure content also resulted in lower plant nutrient content. Manure from a high-rise layer barn was at the other extreme. Since no bedding was added to the manure the moisture content was much higher (47%). The high moisture content resulted in lower plant available nitrogen (PAN) content as compared to broiler litter, as well as lower phosphorus content (expressed as P2O5) and potassium (expressed as K2O).
Table 2. Poultry manure composition (lb / ton) used in the analysis (Chastain et al, 2001).
Nutrient
Broiler Litter(MC = 24%)
Layer Manure(MC = 47%)
Turkey Grow-out Litter (MC = 26%)
Turkey Brooder Litter (MC = 14%)
Ammonium-N
10
12
12
2.6
Nitrate-N
3.6
None detected
0.4
0.6
Org-N
43.8
22
42
37.2
Total-N
57.4
34
54
40.4
PAN – inc *
38
23
35
25
P2O5
66
51
64
29
K2O
57
26
37
20
* PAN – inc. = Incorporated plant available N = 0.60 x Org-N + 0.80 x Ammonium-N + Nitrate-N
Data for all three forms of nitrogen are provided in Table 2. However, not all of the nitrogen in manure is available for use by a crop. For this study, it was assumed that poultry manure was incorporated on the same day that it was applied by disking. As a result, 80% of the ammonium-N was counted as plant available. The amount of organic-N (Org-N) mineralized was assumed to be 60% based on common recommendations in South Carolina, however mineralization rates vary based on soil temperature, pH, and moisture. All the small amounts of nitrate contained in the manure was counted as available. The equation used for PAN estimates is provided with the table. Additional information concerning the estimate of plant available-N is provided by Chastain et al (2001).
The three plant nutrients used in our analysis are shown in bold colors in Table 2 for each type of poultry manure. They were the PAN, which is the best estimate of the nitrogen in manure that can be substituted for fertilizer-N, P2O5, and K2O.
Fertilizer Component Prices Used
The price of a pound of fertilizer nitrogen depends of the source. The price data shown previously in Figure 1 shows clearly that the most expensive source of nitrogen was ammonium sulfate, followed by ammonium-nitrate and urea. Ammonium-sulfate, the most expensive source of N, has few advantages unless soil-test results indicate that addition of large amounts of sulfur is needed. Ammonium-nitrate is one of the most common types of nitrogen used to manufacture complete fertilizers. It has the advantage of being water soluble, and is not as readily lost to the air as ammonia as compared to urea. Urea has the advantages of being more water soluble than ammonium-nitrate, and contains 35% more N per ton than ammonium-nitrate. The primary disadvantage of urea is that a significant amount (20% to 40%) can be lost to the air by ammonia volatilization unless it is incorporated in the soil to a depth of at least one inch. So the basic question to decide is: which N-price should be used to define the value of the plant available-N in poultry manure? The price of urea was selected because urea and poultry manure behave similarly with regards to ammonia volatilization losses.
The prices of N, P2O5, and K2O were shown to fluctuate widely from 2000 to 2012 (see Figures 1 and 2). The largest cause of these price fluctuations was the price of energy (i.e. oil) needed to manufacture and transport fertilizers. As a result, the prices of these three major plant nutrients were not allowed to vary independently in the analysis. That is, prices of all three nutrients had to be selected by year because of the dependence of all three on energy prices.
It was not a study objective to try to predict future prices since that would be possible, nor was it to perform calculations for each year. To do so would provide many numbers, but would obscure the basic points to be learned. Instead, the approach used was to select nutrient prices by year and use the years that encompassed the linear increase that began in 2004 as well as major peaks and valleys seen in the price of nitrogen in 2008, 2010, and 2012. Prices were also obtained from market reports to obtain prices for the fourth quarter of 2016 (USDA-SC, 2016; DTN, 2016). The actual prices used by year for the analysis are given in Table 3.
Table 3. Component fertilizer prices used in the analysis (USDA-ERS, 2013). The prices shown for 2016 were average prices obtained from market publications from the fourth quarter (USDA-SC, 2016; DTN, 2016).
Year
$/lb N (Urea)
$/lb P2O5
$/lb K2O
2004
0.30
0.29
0.15
2008
0.60
0.87
0.47
2010
0.49
0.55
0.43
2012
0.60
0.72
0.54
2016
0.37
0.26
0.27
Value of Poultry Manure Used as a Complete Fertilizer – N,P, and K
The first step in the study was to calculate the value of a ton of poultry manure by multiplying the price of N, P2O5, and K2O for each year (Table 3) by the amount of these nutrients per ton of manure (Table 2). This assumes that all of the nutrients in the manure can be used to grow a marketable crop. This is only true if the soil is poor in fertility or the excess P can be used by other crops in the rotation without application of additional manure. Many brokerage contracts in South Carolina, are based on application of 2 tons of litter per acre prior to a primary crop, such as corn or cotton. Additional litter is not spread on the second crop which is often soybeans. The results for the first step are provided in Table 4.
Table 4. Variation in the value of various types of poultry manure ($/ton) based on variability in price of N, P2O5, and K2O. Prices assume that all of the nutrients in the manure can be used in a crop rotation.
Year
Broiler (MC = 24%)
Layer (MC = 47%)
Turkey Grow-out (MC = 26%)
Turkey Brooder (MC = 14%)
2004
39.09
25.59
34.61
18.91*
2008
107.01
70.39
94.07
49.63
2010
79.43
50.50
68.26
36.80
2012
101.10
64.56
87.06
46.68
2016
46.61
28.79
39.58
22.19*
* Denotes values too low to be part of a viable brokerage contract with typical brokerage prices being in the range of $20 to $25 per ton of manure.
The most important observations that can be made from the results given in Table 4 are given below.
The value of broiler and turkey grow-out litter followed similar fluctuations. The values ranged from about $35 to $39 per ton in 2004 to a maximums of $94 to $107 per ton in 2008. By the end of 2016 the value of turkey grow-out litter and broiler litter ranged from about $40 to $47 per ton. During the years with high fertilizer prices brokerage customers that were paying $40 to $50 to spread 2 tons of litter per acre were receiving much more fertilizer value than they were paying for.
Turkey brooder litter consistently had the lowest value per ton as compared to the others due to low nutrient content and the large amounts of bedding used. The value of a ton of this type of litter was too low in 2004 and 2016 to be viable for litter brokerage contracts. Even during years with high fertilizer prices (2008 and 2012) turkey brooder litter was rarely brokered since it was so dry. Such dry, low-density manure that was mostly pine shavings further reduced the amount of litter and fertilizer value that could be fit into a typical trailer.
Layer manure consistently had lower value per ton as compared to broiler and turkey grow-out litter. The lower value was due to the much higher moisture content which diluted the nutrient value of the manure. Layer litter was a viable brokerage option, but not for long haul distances.
Value of Poultry Manure Applied to Fields with Sufficient P2O5
A common situation is when soil-test results indicate that a field has sufficient P2O5 in the soil for not only the crop to be grown immediately, but also for the next crop in the rotation (soybeans for example). In such cases, the P2O5 in poultry manure has no value, and only the N and K2O in the manure can be used as a fertilizer substitute. The results for this situation are provided in Table 5.
Table 5. Variation in the value of various types of poultry manure ($/ton) based on N and K2O prices. It was assumed that soil-test indicate that no P2O5 was needed.
Year
Broiler (MC = 24%)
Layer (MC = 47%)
Turkey Grow-out (MC = 26%)
Turkey Brooder (MC = 14%)
2004
19.95*
10.80*
16.05*
10.50*
2008
49.59
26.02
38.39
24.40
2010
43.13
22.45*
33.06
20.85*
2012
53.58
27.84
40.98
25.80
2016
29.45
15.53*
22.94*
14.65*
* denotes values are two low to be part of a viable brokerage contract with typical brokerage prices being in the range of $20 to $25 per ton of manure.
The results indicated that when the N price was $0.30/lb and K2O averaged $0.15/lb in 2004 the value of poultry manure was too low to be moved at contact prices of $20 to $25 per ton. Also, at prices associated with 2008, 2010, and 2012 the value of broiler and turkey grow-out litter ranged from $33 to $54 per ton. Layer and turkey brooder litter were poor to marginal values for brokerage contacts when the P2O5 was not needed over the entire range of fertilizer prices.
Comparing the results for 2008 for broiler litter indicates that if P2O5 was not needed the value fell from $107.01/ton to $49.59/ton. That is, the value of the litter was reduced by 54%. The year with the next highest value, 2012, eliminating the need for P2O5 reduced the litter value by 47%. Large drops in litter value can also be observed for other types of poultry manure by comparing the values in Tables 4 and 5. These results indicate that the P2O5 contained in poultry manure is one of the largest sources of value.
Value of Poultry Manure as Only a Source of Nitrogen
The analysis was performed again to reflect the value of poultry manure if nitrogen is the only major nutrient needed based on soil-test results. The results given in Table 6 clearly show that nitrogen alone never provided enough value to support brokerage contracts.
Table 6. Variation in the value of various types of poultry manure ($/ton) when nitrogen is the only nutrient needed based on soil-test results.
Year
Broiler (MC = 24%)
Layer (MC = 47%)
Turkey Grow-out (MC = 26%)
Turkey Brooder (MC = 14%)
2004
11.40*
6.90*
10.50*
7.50*
2008
22.80*
13.80*
21.00*
15.00*
2010
18.62*
11.27*
17.15*
12.25*
2012
22.80*
13.80*
21.00*
15.00*
2016
14.06*
8.51*
12.95*
9.25*
* denotes values are two low to be part of a viable brokerage contract with typical brokerage prices being in the range of $20 to $25 per ton of manure.
Results for a Four-House Broiler Farm
The previous results demonstrated that high litter nutrient contents combined with strong fertilizer prices yielded litter values that were much greater than the amount paid to litter brokers. The results also demonstrated that P2O5 was one of the key contributors to litter value. The results of the analysis were applied to a four-house broiler farm to more clearly demonstrate the practical implications. Fertilizer prices from January 2019 in central South Carolina were also added to the analysis. The key assumptions and results are provided in Table 7.
Table 7. Application of analysis results to a 4-house broiler farm. Building size = 50 ft x 500 ft, litter production was assumed to be 580 tons/year (145 tons/house/yr) with a price of $10/ton paid to the broiler producer ($5800/year).
Year
N Price ($/lb)
P2O5 Price ($/lb)
K2O Price ($/lb)
Litter Value ($/ton)
Value of 580 tons of litter ($/Year)
Value from N (%)
Value from P2O5 (%)
Value From K2O (%)
Loss to Producer ($/Year)
2004
0.30
0.29
0.15
39.09
22,672
29
49
22
16,872*
2008
0.60
0.87
0.47
107.01
62,066
21
54
25
56,266
2010
0.49
0.55
0.43
79.43
46,069
23
46
31
40,269
2012
0.60
0.72
0.54
101.1
58,638
23
47
30
52,838
2016
0.37
0.26
0.27
46.61
27,034
30
37
33
21,234
2019**
0.38
0.54
0.31
67.75
39,295
21
53
26
33,495
* The price paid to a broiler producer in a brokerage contract ranges from 0 to $15/ton of litter. A value of $10 /ton of litter is common. The loss was calculated as: (litter value ($/ton) – $5800).
** Prices from central South Carolina obtained in January 2019.
The results indicate that the total value of litter on a four house farms that produces 580 tons of litter per year varied from $22,672 per year in 2004 to a maximum of $62,066 per year in 2008. Currently, the value in January 2019 was estimated to be $39,295/year. In every year, the P2O5 contained in the litter contributed the most to the litter value. This contrasts with the common assumption that the high P2O5 content in litter is a problem as compared to nitrogen. The results point out that the most value can be obtained from litter by giving phosphorous use the priority in manure management. Assuming that the broiler producer was consistently paid $10/ton of litter by the broker the annual litter income was only $5800 per year. If the producer had integrated broiler production with crop production using a rotation that would realize all the fertilizer value in the litter the total litter value would have served to improve profitability of the cropping enterprise. If the producer relied on brokerage as the sole manure management strategy then the annual loss to the producer ranged from $16,872 to $56,266 per year depending on fertilizer prices.
What these results also point to, but do not quantify, is the variation in risk. Producers who built farms using brokerage as the sole manure management plan during the years of high fertilizer prices gave away litter that was worth 3.9 to 10.7 times more than they were paid. They also have incurred a great risk since brokerage contracts typically last only one year, and crop producers who once were happy to purchase brokered litter are no longer consistent customers. Such producers are forced to quickly find other litter use alternatives often in areas where agricultural and forest land may not be close to the farm. Building broiler barns relying on annual brokerage contracts as the sole manure management option has been shown to be short sighted, and has a low probability of being economically or environmentally sustainable. Co-locating poultry production with some sort of profitable plant production enterprise that can use all of the fertilizer value in the litter is preferred. The next most viable alternative may be to use litter to produce high-quality compost for high volume, consistent markets.
What have we learned?
It was found that the value of poultry manure as a complete fertilizer (N,P,K) varied from $18.91 to $107.01 per ton depending of component prices (N, P, K), moisture content, and the amount of bedding used. If the receiving fields did not require phosphorous, based on soil test, the realized value ranged from $10.50 to $49.59 per ton. Finally, if soil-test indicate that N was the only major nutrient needed the value decreased to $7.50 to $22.80 per ton. During the same time frame, brokerage prices ranged from $20 to $50 per ton depending on haul distance and spreading service. However, most brokerage contracts were based on $20 to $25 per ton of manure. Several practical observations were made from the results:
Brokerage of litter may only be a viable alternative when the receiving cropland needs a complete fertilizer and when the N, P, and K contents of the manure are not diluted by water or bedding.
Manure brokerage is not economically sustainable if N is the only major nutrient needed by the receiving cropland.
Integrated farms that can use the manure produced by the poultry barns to fertilize their own cropland have the potential to reduce the legal and economic risk to the execution of a manure nutrient management plan.
Poultry farms that currently rely on litter brokerage as the only manure management plan are losing customers and need to look at other alternatives that provide a less risky and sustainable use for the mature produced.
Analysis of the impact of fluctuations in fertilizer price on litter produced from four broiler houses indicated that the full value of the litter ranged from $22,672 to $62,066 per year. The P2O5 contained in the litter accounted for the majority of the fertilizer value (37% to 54%). As a result, complete utilization of litter phosphorous in a crop rotation is the key to realizing the maximum value from litter.
Author
John P. Chastain, Ph.D., Professor and Extension Agricultural Engineer
Department of Agricultural Sciences, Agricultural Mechanization & Business Program, Clemson University, 245 McAdams Hall, Clemson, SC 29634-0312
jchstn@clemson.edu
Sources of Additional Information
Chastain, J.P., J.J. Camberato, and P. Skewes. (2001). Poultry Manure Production and Nutrient Content. Chapter 3B in Confined Animal Manure Managers Certification Program Manual: Poultry Version, Clemson University Extension, Clemson SC, pp 3b-1 to 3b-17. Available at: https://www.clemson.edu/extension/camm/manuals/poultry_toc.html
USDA-SC (2016). Dept of Ag Market News, South Carolina Crop Production Report Dec. 8.
Zublena, J.P., J.V. Baird, and J.P. Lilly. (1997). SoilFacts: Nutrient Content of Fertilizer and Organic Materials (AG-439-18).
Acknowledgements
This study was supported by the Clemson Extension Confined Animal Manure Managers Program.
The authors are solely responsible for the content of these proceedings. The technical information does not necessarily reflect the official position of the sponsoring agencies or institutions represented by planning committee members, and inclusion and distribution herein does not constitute an endorsement of views expressed by the same. Printed materials included herein are not refereed publications. Citations should appear as follows. EXAMPLE: Authors. 2019. Title of presentation. Waste to Worth. Minneapolis, MN. April 22-26, 2019. URL of this page. Accessed on: today’s date.
Manage Cookie Consent
To provide the best experiences, we use technologies like cookies to store and/or access device information. Consenting to these technologies will allow us to process data such as browsing behavior or unique IDs on this site. Not consenting or withdrawing consent, may adversely affect certain features and functions.
Functional
Always active
The technical storage or access is strictly necessary for the legitimate purpose of enabling the use of a specific service explicitly requested by the subscriber or user, or for the sole purpose of carrying out the transmission of a communication over an electronic communications network.
Preferences
The technical storage or access is necessary for the legitimate purpose of storing preferences that are not requested by the subscriber or user.
Statistics
The technical storage or access that is used exclusively for statistical purposes.The technical storage or access that is used exclusively for anonymous statistical purposes. Without a subpoena, voluntary compliance on the part of your Internet Service Provider, or additional records from a third party, information stored or retrieved for this purpose alone cannot usually be used to identify you.
Marketing
The technical storage or access is required to create user profiles to send advertising, or to track the user on a website or across several websites for similar marketing purposes.


 Germination studies suggest small numbers of viable weed seeds, as only one seed germinated from unspiked samples. However, total weed counts suggest there can be high total seed numbers in the litters, with an average seed content of 1.17 seeds/100-g. Additionally, approximately 15% of the seeds collected were viable.