The use of cover crops and manure to retain soil moisture in Aridisols in Southern Idaho

Purpose

It is important to measure soil moisture in semi-arid regions because future models predict severe droughts and a decrease in rainfall events by up to 40%. The effects of management practices, such as reduced tillage, cover cropping, and manure application, have not been evaluated in the semi-arid and irrigated crop production area of Southern Idaho. In this study, we investigated the effects of cover crops, dairy manure, and tillage on soil physical characteristics (soil water storage, infiltration, runoff, saturated hydraulic conductivity, bulk density) and silage corn yield in silty loam soils. The objectives of this research were to: (a) determine if cover crops and dairy manure increased soil water storage, or if the cover crops were depriving the cash crop of water, (b) determine if infiltration, runoff, saturated hydraulic conductivity, and bulk density were influenced by cover crops and dairy manure, (c) determine if silage corn yield is affected by cover crops and dairy manure, and (d) determine if there are differences between tillage types.

What Did We Do?

This study was conducted at the USDA-ARS Northwest Irrigation and Soils Research Laboratory in Kimberly, Idaho. The experimental design was a split plot with four replicates and repeated measures, and the two main experiment treatments were tillage (strip till vs disk/chisel plow). The four sub-treatments were: (a) control (no cover crop or dairy manure), (b) cover crop only (CC only), (c) manure only (M only), and (d) cover crop with manure (CC + M). Treatments that did not receive manure received inorganic fertilizer to meet recommended crop needs based on spring soil tests. Inorganic fertilizer was only applied to manure treatments if spring soil tests indicated that additional nutrients were required. Stockpiled dairy manure was applied with a manure spreader at a rate of 30 ton per acre (dry weight) in the fall after corn silage harvest and incorporated by disking or left on the surface. Both the corn silage and the triticale were irrigated using handlines, as needed, during the water season, which was generally from mid-April through mid-October. Soil moisture was measured using a neutron probe throughout each growing season. Neutron probe measurements were collected every 6 inches to a maximum depth of 60 inches one to two times per month. Soil water storage (SWS) was calculated from 0 to 12 inches, 0 to 24 inches, and 0 to 60 inches using weighted depth increments. A Cornell Sprinkle Infiltrometer was used to measure infiltration and runoff rates, field saturated infiltrability, and rainfall before runoff in the middle of the growing season in 2020 prior to an irrigation event.

What Have We Learned?

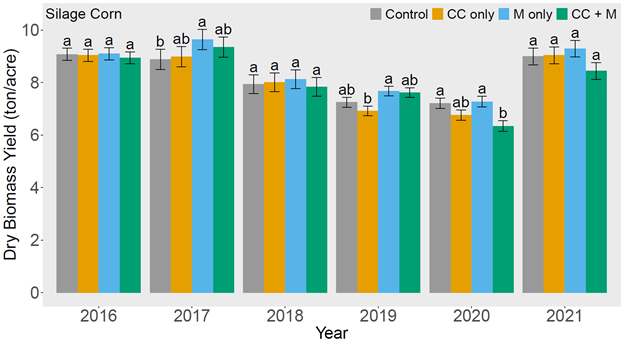
From this research, we found that the use of winter cover crops and fall applied solid dairy manure did not improve soil water storage in the semi-arid and calcareous soils in Southern Idaho. Soil water storage tended to be lower in the CC + M plots (Figure 1). The CC + M plots were able to infiltrate more water prior to runoff than the control plots, suggesting that the CC + M plots are drier (Figure 2). Infiltration, runoff, and saturated hydraulic conductivity did not improve with the treatments and remained similar to the control plots. Although some research has shown improvements in soil moisture, soil physical properties, and dry biomass yield when using reduced tillage practices, there were no differences between reduced tillage and conventional tillage. Silage corn yields tended to be highest in the M only plots and lowest in the CC + M plots, however there were no treatment differences in three of the six years of the study (Figure 3). Using triticale as a winter cover crop would be beneficial to increase total dry biomass yields in dairy systems that would like to increase their forage production, however it is not advised if a producer is only looking to increase silage production.


Figure 1. Average soil moisture storage (SWS; inch of water) by treatment from 2016 to 2021 in the top 15, top 30, and top 60 inches. Soil moisture storage was calculated from 0 to 12 inches, 0 to 24 inches, and 0 to 60 inches using weighted depth increments. Bars represent mean plus standard error. Columns within years not connected by the same number are significantly different (p<0.05).


Figure 2. Average rainfall before runoff by treatment in 2020. Bars represent mean plus standard error. Columns not connected by the same number are significantly different (p<0.05).


Figure 3. Average dry biomass yield for silage corn by treatment from 2016 to 2021. Bars represent mean plus standard error. Columns within years not connected by the same number are significantly different (p<0.05).

Future Plans

This spring, inversion tillage will be performed prior to planting silage corn to incorporate the dairy manure into the topsoil. Dairy manure has not been applied to the field since fall of 2020. Inorganic fertilizer will be applied if needed.

Authors

Presenting author

Kevin Kruger, Research Support Scientist, University of Idaho

Corresponding author

Jenifer L. Yost, Research Soil Scientist, USDA-ARS

Corresponding author email address

jenifer.yost@usda.gov

Additional authors

April B. Leytem, Research Soil Scientist, USDA-ARS; Robert S. Dungan, Research Microbiologist, USDA-ARS; Linda R. Schott, Nutrient and Waste Management Extension Specialist, University of Idaho

Additional Information

This research was presented at the virtual ASA, CSSA, SSSA International Annual Meeting in November of 2020. The link to the recorded presentation is found in the citation below. Although this research is not published in a scientific journal yet, we will be submitting a paper to Agricultural Water Management in early to mid 2022.

Yost, J.L., Leytem, A.B., Dungan, R.S., & Schott, L.R. (2020). The Use of Cover Crops and Manure to Retain Soil Moisture in Aridisols in Southern Idaho [Abstract]. ASA, CSSA and SSSA International Annual Meetings (2020) | Virtual, Phoenix, AZ.

https://scisoc.confex.com/scisoc/2020am/meetingapp.cgi/Paper/126244

Acknowledgements

The authors would like to thank Joy Lynn Barsotti for collecting the neutron probe measurements.
Methodologies for In-situ Characterization of the Impact of Equine Manure Management Practices on Water Quality

Nutrient loading of nitrogen and phosphorus in runoff and water leachate threatens Florida’s environmental and water resources. Of those nutrients, nitrate (NO3) nitrogen is highly soluble and not strongly bound to soils. Consequently, nitrate is highly mobile and subject to leaching losses when both nitrate content and water movement are high.

Due to Florida’s sandy soils and humid subtropical climate, nitrate losses from leaching and runoff are high and creates concerns for animal waste handling1. Mitigating nutrient loading to ground and surface waters through proper management of horse manure and stall waste can help protect water quality. However, information regarding the relationship between on-farm equine manure management practices and water quality remains limited.

What did we do

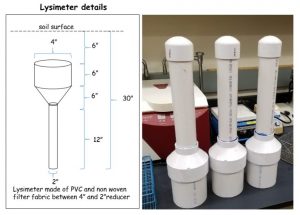
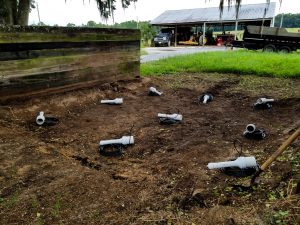
The objective of this study was to address waste management challenges on Florida equine operations by developing methodologies for in-situ characterization of nutrient profile of pore and surface water runoff from stockpiled equine waste and waste that has been effectively composted. Two small-scale horse properties with 2-8 horses managed on 4-9 acres, and 1 larger scale operation with up to 70 horses managed on 300+ acres located within the Rainbow Springs Basin Management Action Plan (BMAP) were enlisted for the project. Lysimeters (soils enclosed in suitable containers and exposed to natural surroundings to capture leachates) were constructed of PVC and non-woven filter fabric suspended between a 4” and 2” PVC reducer with a total length of 24” and deployed 6” below ground2 (Figure 1).

Figure 1. Design details and image of lysimeters used for leachate collection. Each lysimeter was equipped with silicone tubing for effluent collection.


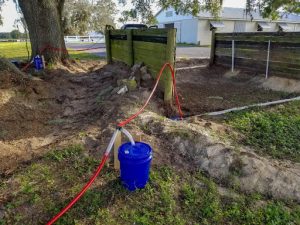
One hole was drilled between the 4” and 2” PVC reducer to insert the sampling lines to the bottom well of the lysimeter and secured with duct tape. For each lysimeter installation, the top 6” of the soil profile was removed using a 6” diameter core ring to ensure the soil profile was undisturbed. The remaining 6”-12” depth of soil was composited and repacked into the lysimeter container, layer by layer. An auger was used to achieve a total depth of 30 inches from the surface to secure the lysimeter in the ground. Following lysimeter installation, the top 6” of intact soil was replaced above the lysimeter and all lines were buried 6” in the soil and channeled to one central location. The collection trenches were fabricated from vinyl gutter material filled with river rock (pre-rinsed for removal of iron and sediment) and installed up and downgradient at stockpile systems and at the opening of each compost bin. A 5-gallon bucket attached to the downgradient gutter served as the water collection reservoir (Figure 2).

three bin compost structure
Figure 2a) Three bin manure compost structure
Manure stockpile structure
Figure 2b) Manure stockpile structure

Figure 2. Placement of runoff collection trenches within the (a) compost and (b) stockpile manure bin structures. The trenches intercept any runoff during heavy rainfall and drain into a 5-gallon bucket. Once the bilge pump below the bucket is adequately submerged, the water is evacuated to the secondary collection bucket for sampling.

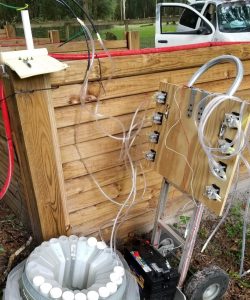
Figure 3. Arrangement of the eight peristaltic pumps on a hand truck dolly for ease of transport. The pumps with connected clear silicone tubing are attached to the lysimeter collection line for leachate collection.

For the lysimeter leachate sampling, eight peristaltic pumps were arranged in an array of 4 pumps wired together and controlled by an on/off switch connected to a sampling tube of the lysimeter (Figure 3).
A grid of 4-5 lysimeters were placed under each compost bin for collection and compositing of samples. The lysimeters for the stockpile were arranged in a 3×3 grid across the stockpile bin with each row (3 lysimeters) representing a composited sample (Figure 4).

Figure 4. Pre-installation and arrangement (3x3) of the lysimeters within the manure stockpile structure.
Figure 4. Pre-installation and arrangement (3×3) of the lysimeters within the manure stockpile structure.

The lysimeters were purged with deionized water after two weeks or after a heavy rainfall event prior to the first sample collection.  For water runoff collection, a 12 volt (500gph) automatic bilge pump, powered by a marine battery, was used to pump water from the collection bucket to a 5-gallon sampling bucket. A 10% subsample was collected with the remaining 90% expelled to the ground surface using a 2-way restricted-flow Y connector. Runoff samples (collected immediately post rainfall event) and leachate samples (collected biweekly) were acidified and stored in scintillation vials at 4oC for nutrient analysis (NO-X, NH4+, TKN, and TP).

Outcome

 The lysimeter and water runoff collection trench construction provide a cost-effective, easily deployed system for characterizing nutrient loading in leachate and surface runoff from manure storage and composting sites. The system has been successful in collecting samples for nutrient analysis, however, a few challenges have also been identified. (1) The runoff system requires periodic maintenance, primarily cleaning (re-rinsing) the gutter and river rock to remove any material lying above the trench. (2) Also, the Y connectors require calibration every month to remove leaf litter and other debris to allow water flow through the valves to ensure a 10% subsample is collected. (3) Suspended materials (fine soil or organic matter) have been observed in lysimeter leachate samples and runoff collection trenches. (4) A subset of lysimeter samples have emitted a sulfur odor when adverse weather conditions or other events delay sampling beyond the target 2-week interval.

Future plans

To assess potential nitrate losses due to sample retention time, the lysimeter effluent will be sampled at specific intervals (day 1, day 3, day 6, day 9, day 14) during a period of no rainfall. These measurements should help determine the optimal time interval for sample collection for analysis of nitrate levels.  Additionally, runoff samples are being collected for analysis of fecal coliform and E. coli. The methodologies employed in this field level study represent an important step towards an improved understanding of the impact of manure management BMPs on water quality.

Corresponding author, title, and affiliation

Agustin Francisco, Graduate Student, University of Florida

Corresponding author email

afran@ufl.edu

Other authors

Carissa Wickens, State Extension Horse Specialist, University of Florida Mark Clark, Wetland Ecologist, University of Florida; Caitlin Bainum, Extension Agent, Florida Cooperative Extension, Marion County, Ocala, Florida; Megan Mann, Extension Agent, Florida Cooperative Extension, Lake County, Tavares, FL

Additional information

1FDEP. 2013. Small Scale Horse Operations: Best Management Practices for water resource protection in Florida.

2Bergstrom, L. 1990. Use of lysimeters to estimate leaching of pesticides in agriculture soils. J. Environmental Pollution. 67:325-347

Additional information regarding this project is available by contacting Carissa Wickens (cwickens@ufl.edu), or Agustin Francisco (afran@ufl.edu).

Acknowledgements

The authors wish to thank the Southwest Florida Water Management District (SWFWMD) for funding support, the farm site cooperators Dave and Deb Kane, Jim and Merry Lee Bain, and Eli and Jeff McGuire. We would also like to thank Carol Vasco, Ellen Rankins, Ana Margarita Arias, Anastasia Reif for their assistance with site installation and data collection.

The authors are solely responsible for the content of these proceedings. The technical information does not necessarily reflect the official position of the sponsoring agencies or institutions represented by planning committee members, and inclusion and distribution herein does not constitute an endorsement of views expressed by the same. Printed materials included herein are not refereed publications. Citations should appear as follows. EXAMPLE: Authors. 2019. Title of presentation. Waste to Worth. Minneapolis, MN. April 22-26, 2019. URL of this page. Accessed on: today’s date.

Regional Runoff Risk Tools for Nutrient Reduction in Great Lakes States

One method to reduce the impacts of excess nutrients leaving agricultural fields and degrading water quality across the Nation is to ensure nutrients are not applied right before a runoff event could occur.  Generally nutrient management approaches, including the 4-Rs (“right” timing, rate, placement, and source), include some discussion about the “right time” for nutrient applications, however that information is static guidance usually centered on the timing of crop needs.  What has been missing, and what will be discussed in this talk, will be the development and introduction to runoff risk decision support tools focused on providing farmers and producers real-time guidance on when to not apply nutrients in the next week to 10 days due to the risk of runoff capable of transporting those nutrients off their fields.  The voluntary adoption and use of runoff risk in short-term field management decisions could provide both environmental and economic benefits.

In response to the need for real-time nutrient application guidance and a request from states in the Great Lakes region, the National Weather Service (NWS) North Central River Forecast Center (NCRFC) has helped develop these runoff risk tools in collaboration with multiple state agencies and universities and with support from the Great Lakes Restoration Initiative (GLRI).  There are currently four active runoff risk tools in the Great Lakes region: Michigan, Minnesota, Ohio, and Wisconsin.  It is possible to develop similar tools for Illinois, Indiana, and New York if willing state partners are identified.  

What did we do?

Studies have shown that a few large runoff events per year contribute a majority of the annual load leaving fields.  In addition applications generally occur during the riskiest times of year for runoff (fall through spring) when fields experience the least vegetative cover and soils are vulnerable.  Knowing this information, real-time NWS weather and hydrologic models were evaluated to identify conditions that correlated with runoff observed at edge-of-field (EOF) locations.  The runoff risk algorithm identifies daily runoff events and stratifies the events by magnitude respective to each grid cell’s historical behavior.  The events are then classified into risk categories for the farmers and producers. In general, high risk events are larger magnitude events that don’t happen as often and also have a higher accuracy rate.  On the other end, low risk events are smaller magnitude events that have a higher chance of being a false alarm yet are also less likely to be associated with significant nutrient loss.

NWS models are run twice daily and simulate soil temperature, soil moisture, runoff, and snowpack conditions continuously.  The runoff risk algorithm is applied against the model output to produce runoff risk guidance which is sent to the state partners.  Each state has a working group and a lead agency or organization that manages the effort to produce and maintain the runoff risk websites as well as promote the tools and educate the users on how to interpret and use the guidance.  

What have we learned?

At this point there are four regional runoff risk tools available.  Response has been positive from both state agencies and when farming groups are asked about the runoff risk concept during post-presentation surveys and small focus groups.  There is a strong desire from the farming community to make the best decision during stressful times of the year when farming schedules and the weather are often in conflict.  

At this point, it is universally accepted among the runoff risk collaborators that there is a need to provide free, easily obtainable forecast guidance to the farming community so they can make the best nutrient application decisions for their operations and the environment.

Runoff risk tools are strictly for decision support and not meant to be a regulatory tool in nature.  This is due to the limitations in hydrologic models, weather forecasting, spatial scale issues, and that the tools have no way of incorporating farmer specific practices into the risk calculations.  Although model improvements will occur in the future, ensuring users understand the limitations but also the benefits they can provide are important components in the States’ outreach and education functions.  

Future Plans

Based on feedback from the states employing runoff tools, there is a second round of enhancement planned for the runoff risk algorithm in the summer of 2019.  Other improvements from the states’ perspective deal with updating webpages and building on and enhancing push notification capabilities such as text message and email alerts.

The next major step forward begins in spring 2019 with the start of version 3 runoff risk.  This 2-year development will transition runoff risk guidance from the current model over to the new NWS National Water Model (NWM).  The NWM framework will allow finer resolution guidance (1km or smaller) for numerous models runs per day all with full operational support.  Moving to the NWM also allows continuous improvement and future collaboration opportunities with universities to improve the underlying WRF-Hydro model as well as runoff risk and other derived decision support guidance.

Authors

Dustin Goering, Senior Hydrologist, North Central River Forecast Center, National Weather Service
Andrea Thorstensen, Hydrologist, North Central River Forecast Center, National Weather Service

Corresponding Author email
dustin.goering@noaa.gov

Additional Information

For further information on runoff risk background please visit this page: https://vlab.ncep.noaa.gov/web/noaa-runoff-risk/runoff-risk-background  (Still under construction)


To visit the state tools see the following links:


Michigan  

Minnesota 

Ohio  

Wisconsin  

Acknowledgements

There are many individuals across a wide spectrum of agencies, industry, and universities that have been instrumental in the development of runoff risk to this point.

Support for the development of runoff risk across the Great Lakes and the upcoming version 3 runoff risk from the National Water Model has been provided by multi-year grants from the Great Lakes Restoration Initiative.


The authors are solely responsible for the content of these proceedings. The technical information does not necessarily reflect the official position of the sponsoring agencies or institutions represented by planning committee members, and inclusion and distribution herein does not constitute an endorsement of views expressed by the same. Printed materials included herein are not refereed publications. Citations should appear as follows. EXAMPLE: Authors. 2019. Title of presentation. Waste to Worth. Minneapolis, MN. April 22-26, 2019. URL of this page. Accessed on: today’s date.

Surface runoff transport of Escherichia coli after poultry litter application on pastureland

Escherichia coli transported in surface runoff from dissolution of applied poultry litter is a major variable in assessing fecal contamination of streams. However, the relative magnitude of the E. coli concentration from a specific poultry litter application and relative to the time lag between litter application and rainfall are not completely understood. This research investigated E. coli transport in runoff on fourteen 2 m × 2 m pastureland plots. Poultry litter was manually applied (4,942 kg ha‐1) in twelve plots followed by artificial rainfall with intensities equivalent to 2‐year and 5‐year storm events. Rainfall was applied in duplicate plots immediately after poultry litter application and 24 and 120 h after litter application. Experiments were also conducted on two control plots without poultry litter application. Surface runoff was collected using a flume installed in a trench. E. coli was quantified from sampled runoff and used as an indicator of fecal contamination by the most probable number (MPN) technique. Significant differences in the average event mean concentrations (EMCs) for the various treatments were determined using ANOVA. No significant differences were observed in average EMCs relative to storm intensity. Statistically significant differences were observed in average EMCs relative to time lag between litter application and rainfall (P < 0.05). A nonlinear relationship was observed between average E. coli EMC and time lag, with the EMC decreasing between 0 h (1.6 × 10⁵ MPN/100 mL) and 24 h (1.3 × 10⁴ MPN/100 mL) and then increasing at 120 h (4.3 × 10⁴ MPN/100 mL). E. coli were always detected in the control plots (average EMC of 6.8 × 10³ MPN/100 mL), indicating the presence and transport of fecal bacteria from sources independent of the immediate poultry litter application. Even though poultry litter application may increase E. coli concentrations in runoff, other sources of fecal contamination serve as a significant component of the total E. coli EMC, especially as the time lag between litter application and rainfall events increases.

Purpose          

Poultry litter is recognized as an excellent source of the plant nutrients nitrogen, phosphorus and potassium. In addition, litter returns organic matter and other nutrients such as calcium, magnesium and sulphur to the soil, building soil fertility and quality.

Questions exist concerning E. coli contamination of waterways following manure land application events. Oklahoma State University researchers conducted a field study evaluating surface runoff transport of E. coli following poultry litter application to pastureland.

Figure 1. Illustration of the down slope outflow flume.What did we do?

Pasture plots, which consisted of ryegrass, fescue grass, bermudagrass and some Johnsongrass, were established at the Eastern Oklahoma Research Station located in Haskell, OK. Cattle had not been allowed access to the pasture for over one year and poultry litter had previously been applied one year prior to the study. Broiler litter was applied to 14 plots at a rate of 2.2 tons/acre. Two control plots received no litter application.

An artificial rainfall simulator was used to produce 2 yr and 5 yr storm events. Rainfall was applied at 0 h, 24 h and 120 h after litter application. Surface runoff was collected using a flume installed in a trench (Figures 1 and 2). Water samples were tested for E. coli populations.

Figure 2. Rainfall simulator.

What have we learned?

Results of this study showed that E. coli event mean concentrations (EMC) in sampled runoff decreased at 24 h and 120 h when compared to 0 h after litter application (Table 1). However, a slight increase in populations was observed at 120 h as compared to 24 h. This slight growth may have been due to litter in contact with the soil surface and protected from ultraviolet light and moisture loss by vegetative cover.

In control plots, E. coli was always detected, indicating other sources of E.coli aside from poultry litter. Other sources may include rodents, birds, and other small mammals.

Table 1. E. coli event mean concentration (EMC, MPN/100 ml)

In conclusion, poultry litter applications may contribute to runoff of E. coli when rainfall events occur shortly after litter application. However, other sources of fecal contamination may serve as a significant component of the total E. coli EMC, especially as the time lag between litter application and rainfall event increases. The implications of this study may affect poultry litter application timing decisions based on predicted rainfall events.

Future Plans  

Future studies using more advanced biological analysis techniques (i.e., DNA profiling) should be conducted to identify sources of background E. coli concentrations.

Authors      

Josh Payne, Area Animal Waste Managment Specialist, Oklahoma State University joshua.payne@okstate.edu

Jorge Guzman, Senior Engineer, Waterborne Environmental; Garey Fox, Professor, Oklahoma State University

Additional information              

Guzman, J. A., G. A. Fox and J. B. Payne, 2010. Surface runoff transport of Escherichia coli after poultry litter application on pastureland. Trans. ASABE. 53(3):779-886.

The authors are solely responsible for the content of these proceedings. The technical information does not necessarily reflect the official position of the sponsoring agencies or institutions represented by planning committee members, and inclusion and distribution herein does not constitute an endorsement of views expressed by the same. Printed materials included herein are not refereed publications. Citations should appear as follows. EXAMPLE: Authors. 2015. Title of presentation. Waste to Worth: Spreading Science and Solutions. Seattle, WA. March 31-April 3, 2015. URL of this page. Accessed on: today’s date.

Evaluation of Feed Storage Runoff Water Quality and Recommendations on Collection System Design

Why Study Silage Leachate?

Silage storage is required for many livestock and poultry facilities to maintain their animals throughout the year.  While feed storage is an asset which allows for year round animal production systems, they can pose negative environmental impacts due to silage leachate and runoff.  Silage leachate and runoff have high levels of oxygen demand and nutrients (up to twice the strength of animal manure), as well as a low pH posing issues to surface waters when discharged.  Although some research exists which shows the potency of silage leachate and runoff, little information is available to guide the design of collection, handling, and treatment facilities to minimize the impact to water quality.  Detailed information to characterize the strength of the runoff through a storm is needed to develop collection systems which segregate runoff to the appropriate handling and treatment system based on the strength of the waste. 

What did we do?

In order to evaluate collection designs, we evaluated six bunker silage storage systems in Wisconsin.  Runoff from these systems was collected using automated samplers throughout one year to assess water quality for nutrients (nitrogen and phosphorus species), oxygen demand, total solids, and pH.  Flow rate for each system was also recorded along with weather data including precipitation information.  Feed quantity and quality was also recorded at each site to have a better understanding of the impact of silage management on water quality.  Data was analyzed to determine flow weighted average runoff concentrations for pollutants measured, seasonality and feed impacts to water quality, storage design impacts, the presence or absence of first flush conditions, total loading, and evaluated to make collection design recommendations.

What have we learned?

Flow rate, timing of ensiling of forage, site bunker design, and amount of litter present were determined to influence silage runoff concentrations.  Leachate collection played a significant role in water quality as the runoff from the site without leachate collection had a lower average pH (4.64) and higher COD values (5,789 mg L-1) than the sites with leachate collection (6.09 and 5.54 pH, and 1,296 and 3,318 mg L-1 COD).  Nutrients were also higher for the site without leachate collection TP (83 mg L-1), NH3 (68 mg L-1), and TKN (222 mg L-1) compared to TP (29 and 63 mg L-1), NH3 (25 and 48 mg L-1), and TKN (184 and 215 mg L-1) for the sites with leachate removal. Time of ensilage also played an important role in water quality with increased losses occurring within two weeks of ensilage.  The most important finding for the design of treatment systems was that the water quality parameters (including nutrients) were found to be negatively correlated with flow.   The resulting effect is that the storms hydrograph has a significant impact on the pollutant loading to the surrounding waterways.  It was also found that loading was relatively linear throughout each storm event indicating that there is no first flush phenomenon which is found to occur with urban runoff systems.  Therefore designing systems to collect the initial runoff from a system is not an efficient way to capture the greatest pollutant load.  It was found that low flows throughout a storm have high pollutant concentrations and collecting low flows throughout a storm would result in the greatest load collected per unit volume.

Future plans

The next phase of this research will be to develop loading recommendations to filter strips for sizing and minimizing impact to the environment.

Corresponding author

Rebecca Larson, Assistant Professor and Extension Specialist, Biological Systems Engineering, University of Wisconsin-Madison ralarson2@wisc.edu

Mike Holly, Eric Cooley, Aaron Wunderlin

Additional information

Published paper is currently in review and will be available within the next year.

Acknowledgements

Wisconsin Discovery Farms

Initial Evaluation of Vegetated Treatment Areas for Treating Runoff from Small Swine Operations in Central Texas

A vegetative treatment area (VTA), as defined by USDA-NRCS, is a “vegetative area composed of perennial grass or forages used for the treatment of runoff from an open lot production system or other process waters”. VTA’s are typically part of a vegetative treatment system (VTS) that includes additional components to remove solids, such as a settling or vegetative infiltration basin. There have been numerous studies, both modeling and field, related to the design and evaluation of VTS’s used to treat animal feeding operation (AFO) runoff; however, none of these have studies evaluated the effectiveness of VTA’s receiving direct runoff from small swine operations during natural rainfall events. Is it possible that a sufficiently sized VTA alone can effectively treat direct runoff from small swine AFO’s during daily operation? This project aims to answer that question and evaluate the effectiveness of VTA’s as a practical and cost-effective alternative wastewater management option to protect surface water quality on small swine facilities. Three locations were established in 2012 at small swine AFO’s in central Texas. In each location, sampling sites were installed to monitor runoff water quantity and quality at the inlet and outlet of the VTA and a nearby control area. Initial data show that the VTA’s provided substantial treatment of the swine facility runoff in terms of reduced nutrient concentrations, but VTA runoff was still higher in nutrients than the control site. The preliminary data highlighted the importance of solids management and year-round vegetation. Hopefully, as these VTA’s become better established, the increased capacity for infiltration and plant nutrient uptake will be reflected in the soil and runoff data.

Authors

Harmel, Daren   daren.harmel@ars.usda.gov      USDA-ARS

The authors are solely responsible for the content of these proceedings. The technical information does not necessarily reflect the official position of the sponsoring agencies or institutions represented by planning committee members, and inclusion and distribution herein does not constitute an endorsement of views expressed by the same. Printed materials included herein are not refereed publications. Citations should appear as follows. EXAMPLE: Authors. 2015. Title of presentation. Waste to Worth: Spreading Science and Solutions. Seattle, WA. March 31-April 3, 2015. URL of this page. Accessed on: today’s date.     

Analysis of total Carbon, Nitrogen, and Phosphorus Contents in Soil Cores Over 10+ Years from Horicon Marsh in Dodge County, Wisconsin


Why Look at Marsh Soil Nutrients?

The purpose of this project was to evaluate changes in carbon (C), nitrogen (N), and phosphorus (P) in samples from identical locations taken ten years apart from Horicon Marsh in Dodge County, Wisconsin.

The area surrounding the marsh is primarily agricultural and has the potential to contribute nutrients to the marsh, affecting the fertility of the soils and changing the ecosystem.

What did we do?  

We hypothesized that carbon, nitrogen, and phosphorus would show significant increases over the ten-year interval between samplings.

Sample sites were positioned every ¼ mile along east-west transects throughout the marsh. A soil core was obtained at each sample site in the winter of either 2002 or 2003. The same sites were revisited and new samples collected in winter of either 2012 or 2013, ten years after the initial visits. The top five centimeters of each soil core were oven dried at 105°C for 72 hours.

Total carbon and nitrogen were analyzed by combustion using a PerkinElmer 2400 series II CHNS/O Analyzer. Total phosphorus was analyzed by the Olsen P-extraction method on a QuikChem FIA+ 8000 series Lachat analyzer.

A paired t-test (α=0.05) was used to compare nitrogen and phosphorus values. Carbon data were compared with a Mann-Whitney ranked sum test at the 95% confidence interval.

What have we learned?  

Carbon and nitrogen did not increase significantly over the time period. Carbon is generally bound in soil organic matter; in histic wetland soils, changes attributable to land use might be difficult to detect due to the already high organic matter content. Nitrogen accumulation was likely mitigated by denitrification processes.

Phosphorus concentrations were greater in the second set of samples. Phosphorus adsorbs tightly to sediment and organic material, which would prevent its removal by flowing water. Changes in land use, especially row crop agriculture in the Horicon marsh area, could contribute runoff inputs of soil particles carrying phosphorus with them. This may explain significantly increased phosphorus levels between the start and end of the study period.

Future Plans  

Future studies might quantify land use changes, their extent, and their impacts on the marsh ecosystem; analyze spatial patterns of phosphorus accretion to determine if it is cycling equally throughout the marsh; and determine the impact of denitrifying bacteria and anaerobic conditions on nitrogen accumulation. Additional research could include testing the water column of the marsh for dissolved nutrients; and sampling the Rock River at its inlet to and outlet from the Horicon Marsh to determine nutrient flux to the stream from the marsh.

Authors

Ashley Hansen, University of Wisconsin-Stevens Point ashleyhansen891@gmail.com

Anna Radke, University of Wisconsin-Stevens Point; Sarah Shawver, University of Wisconsin-Stevens Point

Additional information

Ashley Hansen, ahans891@uwsp.edu; Anna Radke, aradk591@uwsp.edu; Sarah Shawver, sshaw497@uwsp.edu

Acknowledgements

Dr. Robert Michitsch

Soils Professor and Research Advisor

Dr. Kyle Herrman

Water Resource Professor and Research Advisor

The authors are solely responsible for the content of these proceedings. The technical information does not necessarily reflect the official position of the sponsoring agencies or institutions represented by planning committee members, and inclusion and distribution herein does not constitute an endorsement of views expressed by the same. Printed materials included herein are not refereed publications. Citations should appear as follows. EXAMPLE: Authors. 2015. Title of presentation. Waste to Worth: Spreading Science and Solutions. Seattle, WA. March 31-April 3, 2015. URL of this page. Accessed on: today’s date.

Phosphorus Indices: Taking Stock of Where We Are and Where We Need to Be

Waste to Worth: Spreading science and solutions logoWaste to Worth home | More proceedings….

Abstract

The inconsistency among P Indices in terms of level of detail and scientific underpinnings among states, as well as in recommendations and interpretations based on site risk, prompted a review and possible revision of the 590 Standard and P-Indexing approach.  The need for revision has been heightened by a slower than expected decrease in P-related water quality impairment and, in some cases, an increase in soil P to levels several fold greater than agronomic optimum due to the inability of the P Index to prevent the continued over-application of P to soils.  While the basic scientific foundations of the P-Indexing approach are sound, these concerns are real.  In this presentation, we propose the use of lower and upper boundaries of P Index use and describe an approach to evaluate individual State P Indices.

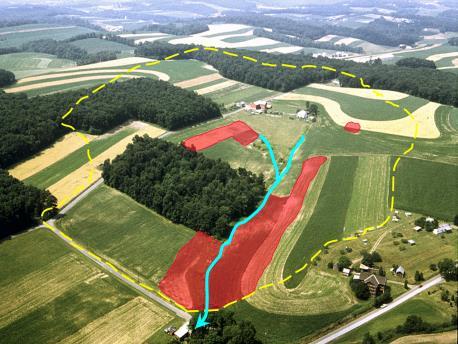
An aerial shot of the FD-36 watershed in south-central Pennsylvania (defined by the dashed white line), where soil chemistry, hydrologic, and agronomic research by USDA–ARS at University Park and Klingerstown locations identified areas of the watershed (in red) at great risk of contributing phosphorus to the stream (the blue line). This research was key to framing the application of the Phosphorus Index in Nutrient Management Planning.   See N.O. Nelson and A.L. Shober, “Evaluation of Phosphorus Indices after Twenty Years of Science and Development,” p. 1703. Photo: Andrew Sharpley.

Why Is It Important to Review the Phosphorus Index?

Since its inception nearly 20 years ago, the phosphorus (P) Index has morphed from an educational tool to a Best Management Practice targeting and implementation tool, a manure-scheduling tool, and in many cases, a regulatory tool.  A great deal of research has been conducted across the U.S. to derive, validate, and support components of the P Indexing concept, particularly those related to source factors.  As different versions of the P Index have emerged, ostensibly to account for local topography, hydrology, soils, land use, and individual state policies and agendas, so too have differences in the P management recommendations that are made using the P Index.  As a result, there are many variations in P Indices now in use as part of the NRCS 590 Nutrient Management Conservation Standard.  This variation is both a strength and weakness of the P Indexing concept.

Author

Andrew Sharpley, Professor, Division of Agriculture, University of Arkansas System.  Sharpley was one of a core group of scientists that back in the early 1990’s developed the scientific foundation of the Phosphorus Indexing approach.  Since then he has conducted extensive field research to justify source and transport factors included in Indices, which have been adopted in 49 of 51 States to guide nutrient management planning as part of the 590 Standard.  He was instrumental in changing USDA and US EPA nutrient management planning strategies away from single numeric soil phosphorus environmental thresholds to the Indexing approach for risk assessment of phosphorus management and land application.  In the last year, he coordinated a group of researchers and extension folks from diverse backgrounds to review and propose revisions to Phosphorus Indices in compliance with the 2011 590 Standard.

The author can be contacted at: sharpley@uark.edu

The authors are solely responsible for the content of these proceedings. The technical information does not necessarily reflect the official position of the sponsoring agencies or institutions represented by planning committee members, and inclusion and distribution herein does not constitute an endorsement of views expressed by the same. Printed materials included herein are not refereed publications. Citations should appear as follows. EXAMPLE: Authors. 2013. Title of presentation. Waste to Worth: Spreading Science and Solutions. Denver, CO. April 1-5, 2013. URL of this page. Accessed on: today’s date.

The Role of Computer Models in Environmental Phosphorus Management

Waste to Worth: Spreading science and solutions logoWaste to Worth home | More proceedings….

Why Model Agricultural Phosphorus?

Computer models are excellent ways to integrate years of scientific research into decision tools that producers and policy makers can use to reduce the environmental impact of agricultural phosphorus. Models are playing more important roles in efforts to manage phosphorus at the farm and watershed scales, so it is increasingly important to make sure models are well developed to meet the needs of users, give reliable predictions, and are consistently updated to keep pace with scientific knowledge.

What Did We Do?

Our research over the past 10 years has concentrated on developing scientifically sound, reliable models that can be used to better manage agricultural phosphorus. This includes developing state-of-the-art models for soil phosphorus cycling and loss to the environment in surface runoff and leaching from soils, manures, and fertilizers. We have also concentrated on making sure models of different complexity, from daily processed-based models to annual empirical models, are based on the same principles and give similar predictions so there are a variety of model choices available to meet user needs.

What Have We Learned?

It is certainly possible to develop reliable, scientifically sound, phosphorus management models, as our research success demonstrates. The best model development requires interdisciplinary collaborations and excellent communication between experimentalists, model developers, and model users. Such a framework of interconnected experimentation and model development should symbiotically advance the science of agricultural P and environmental protection beyond the point that the two proceeding independently can achieve.

Future Plans

Model development research continues to make sure that available models are kept up to date with scientific knowledge and meet the needs of users concerning ease of use and data requirements.

Authors

Peter Vadas, Dairy Systems Scientist, USDA-ARS Dairy Forage Research Center,  peter.vadas@ars.usda.gov

Additional Information

More information can be found at: http://ars.usda.gov/Services/docs.htm?docid=21763


The authors are solely responsible for the content of these proceedings. The technical information does not necessarily reflect the official position of the sponsoring agencies or institutions represented by planning committee members, and inclusion and distribution herein does not constitute an endorsement of views expressed by the same. Printed materials included herein are not refereed publications. Citations should appear as follows. EXAMPLE: Authors. 2013. Title of presentation. Waste to Worth: Spreading Science and Solutions. Denver, CO. April 1-5, 2013. URL of this page. Accessed on: today’s date.

Effect of Manure Handling and Incorporation on Steroid Movement In Agricultural Fields Fertilized With Beef Cattle Manure

Waste to Worth: Spreading science and solutions logoWaste to Worth home | More proceedings….

Why Study Manure Land Application and Steroids?

Manure generated from concentrated animal feeding operations may serve as a source of steroids in surface water and adversely impact the development of aquatic ecosystems. The objectives of this research were to determine the amount of steroids and metabolites in manure from beef cattle production pens, and runoff from crop production fields.

What Did We Do?

Heifers were treated with zeranol, trenbolone acetate, and 17b-estradiol implants and fed melengestrol acetate, while a second group was not treated with growth promoters. Manure was sampled in the pens during feeding, run-off was collected during rainfall events, after feeding manure was collected, and either composted or stockpiled overwinter. In the  following summer both composted and stockpiled manure was spread on a field, with plots subjected three tillage practices. Following application, two rainfall simulation events were conducted: one day (1 DAT) and one month later (30 DAT) to determine the effects of rainfall timing, manure handling (treated compost, untreated compost, treated stockpile and untreated stockpile) and tillage (no-till, moldboard plow+disk and disk) on the runoff losses of steroids.

What Have We Learned?

Simulated rainfall apparatus.

Results from the manure composting showed reduction in steroid concentrations over stockpiling for some compounds in manure samples such as 4-androstenedione, a-zearalenol, and progesterone, though not for all steroids. Very low concentrations of steroids were found in most runoff samples, approaching or below detection limits. Considering only detection frequency, fewer runoff samples showed traces of steroids on the 1 DAT in comparison to the 30 DAT simulations.  The amount of  rainfall  before runoff was initiated was affected by tillage, and was different for the 1 DAT and 30 DAT events. A second year’s study with a smaller set of treatments, and use of a surrogate estrogen applied at known mass showed that disking significantly reduced runoff losses of the steroids. Runoff risk is affected by the storm event needed to initiate runoff, and also the time since manure application.

Soil during rain simulation and tube to take runoff to collection point.

Future Plans

From both the steroid runoff and general manure applications risk perspectives, how the soil receives rainfall changes during the first month after tillage. Therefore, this process needs to be investigated more closely and models predicting runoff have to take these changes into account.

Authors

Charles A. Shapiro, Professor, Department of Agronomy and Horticulture, University of Nebraska-Lincoln, Haskell Agricultural Laboratory, Concord, NE cshapiro@unl.edu

Sigor Biswas, Research Assistant, William L. Kranz, Associate Professor, David P. Shelton, Professor, Simon J. van Donk, Assistant Professor, Biological Systems Engineering; Daniel D. Snow, Associate Professor, Schol of Natural Resources; Shannon L. Bartelt-Hunt, Assistant Professor, Tian C. Zhang, Professor, Civil Engineering; Terry L. Mader, Professor, Animal Science, University of Nebraska-Lincoln; David D. Tarkalson, Soil Scientist, USDA-ARS, Kimberly-ID. 

Additional Information

Bartelt-Hunt, S., D. Snow, W. Kranz, T. Mader, C. Shapiro, S. van Donk, D. Shelton, D. Tarkelson, and T.C. Zhang. 2012. Effect of growth promotants on the occurrence of steroid hormones on feedlot soils and in runoff from beef cattle feeding operations. Environ. Sci. Technol. 46(3): 1352-1360.

Biswas, S., C. A. Shapiro, W. L. Kranz, T. L. Mader, D. P. Shelton, D.D. Snow, S. L. Bartell-Hunt, D. D. Tarkalson, S. J. van Donk, T. C. Zhang, S. Enslay. Current knowledge on the environmental fate, potential impact and management of growth promoting steroids used in the US beef cattle industry. J. of Soil and Water Cons. (In press, July 2013 issue).

Acknowledgements

This research was funded by US-EPA Science to Achieve Results (STAR) grant R833423.


The authors are solely responsible for the content of these proceedings. The technical information does not necessarily reflect the official position of the sponsoring agencies or institutions represented by planning committee members, and inclusion and distribution herein does not constitute an endorsement of views expressed by the same. Printed materials included herein are not refereed publications. Citations should appear as follows. EXAMPLE: Authors. 2013. Title of presentation. Waste to Worth: Spreading Science and Solutions. Denver, CO. April 1-5, 2013. URL of this page. Accessed on: today’s date.