Reducing Hay Waste Associated with Outdoor Feeding of Adult Horses

Why Be Concerned with Hay Waste On Horse Farms?

Hay is commonly fed to horses and is usually the largest and most expensive dietary component for adult horses. Hay waste can occur during both storage and feeding, and can add up to ≥ 40%, depending on forage type, storage method, environment, and storage length. Horses are commonly fed large round-bales and small square-bales in outdoor paddocks; however, no research exists to characterize hay waste. The objectives were to determine hay waste and economics of small square-bale and large round-bale feeders when used in outdoor feeding of adult horses. Related: Managing Manure on Horse Farms

What did we do?

Large round- and small-square bale hay feeders were evaluated during two separate studies. photo of different bale feeders
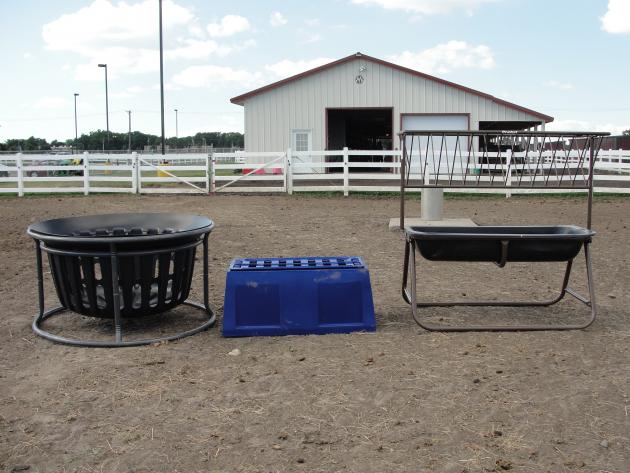
Nine round-bale feeders, were tested, including the Cinch Net ($147; Cinch Chix LLC), Cone ($1,195*; Weldy Enterprises; model R7C), Covered Cradle ($3,200; SM Iron Inc.), Hayhut ($650; Hayhuts LLS), Hay Sleigh ($425; Smith Iron Works Inc.), Ring ($300; R & C Livestock), Tombstone ($250; Dura-Built), Tombstone Saver ($650; HiQual), Waste Less ($1,450; JSI Innovations LLC), and a no-feeder control (Figure 1). Twenty-five mature horses were used to form five groups of five horses. Each feeder was placed on the ground in an outdoor dirt paddock. The groups of horses fed in rotation for four days, and every fourth day, groups were rotated to a different paddock. Waste hay (hay on the ground outside of the feeder) and orts (hay remaining inside the feeder) were collected daily. Percent hay waste was calculated as the amount of hay waste divided by the amount of hay fed minus orts. The number of months to repay the feeder cost (payback) was calculated using hay valued at $200/ton, and improved efficiency over the no-feeder control.

Three small square-bale feeders were tested, including a hayrack ($280; Horse Bunk Feeder and Hay Rack, Priefert Manufacturing), slat feeder ($349; The Natural Feeder), basket feeder ($372; Equine Hay Basket, Tarter Farm and Ranch Equipment), and a no-feeder control (Figure 1). Two feeders of each type were placed in separate, outdoor, dirt paddocks. Twelve adult horses were divided into four similar herds of three horses each and were rotated through the four paddocks, remaining in each paddock for a period of seven days. Grass hay was fed at 2.5% of the herd bodyweight split evenly between two feedings. Waste hay (hay on the ground outside of the feeder) and orts (hay remaining inside the feeder) were collected before each feeding. Percent hay waste was calculated as the amount of hay waste divided by the amount of hay fed minus orts. The number of months to repay the feeder cost (payback) was calculated using hay valued at $200/ton, and improved efficiency over the no-feeder control.

What have we learned?

No injuries were observed from any feeder types during the data collection period.

Hay waste differed between round-bale feeder designs. Mean percent waste was: Waste Less, 5%; Cinch Net, 6%; Hayhut, 9%; Covered Cradle, 11%; Tombstone Saver, 13%; Tombstone, Cone and Ring, 19%; Hay Sleigh, 33%; and no-feeder control, 57%. All feeders reduced waste compared to the no-feeder control. Feeder design affected payback. The Cinch Net paid for itself in less than 1 month; Tombstone and Ring, 2 months; Hayhut and Tombstone Saver, 4 months; Hay Sleigh, 5 months; Waste Less, 8 months; Cone, 9 months; and Covered Cradle, 19 months.

Hay waste was different between small square-bale feeder designs. Mean hay waste was 1, 3, 5 and 13% for the slat, basket, hayrack and no-feeder control, respectively. All feeders resulted in less hay waste compared with the no-feeder control. Feeder design also affected payback. The hayrack, basket, and slat feeders paid for themselves in 11, 10, and 9 months, respectively.

Future Plans

Future research investigating hay waste associated with outdoor feeding of adult horses should focus on different forage types and the optimum number of horses per feeder. Related: Small Farm Environmental Stewardship

Authors

Krishona Martinson, Associate Professor, University of Minnesota krishona@umn.edu

Amanda Grev, Research Assistant, University of Minnesota; Emily Glunk, Assistant Professor, Montana State University; William Lazarus, Professor, University of Minnesota; Julie Wilson, Executive Director, Minnesota Board of Veterinary Medicine; and Marcia

Additional information

Grev, A.M., E.C. Glunk, M.R. Hathaway, W.F. Lazarus, and K.L. Martinson. 2014. The effect of small square-bale feeder design on hay waste and economics during outdoor feeding of adult horses. Journal of Equine Veterinary Science. 34: 1,269-1,273.

Martinson, K., J. Wilson, K. Cleary, W. Lazarus, W. Thomas and M. Hathaway. Round-bale Feeder Design Affects Hay Waste and Economics During Horse Feeding. 2012. J. Anim. Sci. 90: 1047–1055.

Acknowledgements

The large round-bale feeder research was funded by a grant from the MN Horse Council and manufacturer fees. The small-square bale feeder research was funded by a grant from the American Quarter Horse Foundation.

The authors are solely responsible for the content of these proceedings. The technical information does not necessarily reflect the official position of the sponsoring agencies or institutions represented by planning committee members, and inclusion and distribution herein does not constitute an endorsement of views expressed by the same. Printed materials included herein are not refereed publications. Citations should appear as follows. EXAMPLE: Authors. 2015. Title of presentation. Waste to Worth: Spreading Science and Solutions. Seattle, WA. March 31-April 3, 2015. URL of this page. Accessed on: today’s date.

Low Tech Waste to Energy Applications in Developing Countries


Abstract

Animal waste is fully utilized in most developing countries, particularly in Afghanistan, Pakistan and Sri Lanka.  Utilization of animal waste for energy, cooking and heating is often of greater importance than use for soil conditioning and fertilization.  The simplest processing of manure, including gut waste from slaughter operations, is to sun-dry the material which is then burned in small, efficient clay burners.  Specialized cooking equipment such as pressure cookers designed to derive the maximum benefit from these low energy fires are also used.Natural gas burners are also employed where the gas is available and offer a much healthier and sanitary option.

A variety of very simple and efficient digesters have been built, and are now employed in many homes, to convert animal waste to useable gas by employing low cost materials. Most of these digesters serve a single home producing cooking, heating and even lighting energy from the waste of a single animal or a small flock or herd.

This presentation will present examples of these systems and discuss how they can be effectively employed by others around the world, including small and hobby farmers in the Pacific Northwest.

Author

BLEDSOE, GLEYN              GLEYN@WSU.EDU          School of Food Science, WSU-UIdaho

The authors are solely responsible for the content of these proceedings. The technical information does not necessarily reflect the official position of the sponsoring agencies or institutions represented by planning committee members, and inclusion and distribution herein does not constitute an endorsement of views expressed by the same. Printed materials included herein are not refereed publications. Citations should appear as follows. EXAMPLE: Authors. 2015. Title of presentation. Waste to Worth: Spreading Science and Solutions. Seattle, WA. March 31-April 3, 2015. URL of this page. Accessed on: today’s date.

The Importance of Markets for Co-products and Innovations for Farms of All Sizes (Innovative Technologies for Managing Manure – Part 1)

Why Are Co-Products Important in Manure Treatment Technologies? Do These Technologies Work for Large and Small Farms?

Livestock and poultry operations face considerable logistical and financial challenges to manage over a billion tons of nutrient-laden manure generated in the U.S. each year. This manure has the potential to impact the environment adversely if it is not managed responsibly, but both producers and the environment can benefit from innovative technologies that alleviate manure management challenges.  Technologies that yield new revenues or offer flexibility in managing manure are of particular interest.  This panel will discuss two factors vital to the long-term success of waste-to-worth technologies:

  1. The importance of markets for co-products from innovative technologies
  2. The importance of developing waste-to-worth innovations for farms of all sizes

The Importance of Markets

Innovative technologies can make it possible for producers to export manure nutrients off-site more readily, which can benefit both their bottom line and the environment. This is particularly true for larger livestock farms, many of which lack sufficient land to be able to apply all their manure at agronomic rates. Some manure-to-energy and nutrient recovery technologies are already in place at animal agriculture operations. However, anecdotal evidence suggests that producers can have difficulty finding markets for the outputs of these systems. This panel will address the viewpoint that, in addition to approaching innovation with the question, “Technically speaking, what commodities can be derived from manure?” it is also important to ask, “For what types of co-products and services does a market exist, and how can optimized manure treatment systems meet this demand?”

The Importance of Innovations for Farms of All Sizes

More than half of all U.S. livestock (including poultry) animals are held by farms smaller than 1,000 beef cattle or equivalent in size. Although these farms may have adequate land for applying manure nutrients at agronomic rates, storage constraints and labor shortages may impact the operation’s ability to apply manure at agronomically optimal times. These constraints can sometimes result in harmful losses of manure nutrients into the environment.

Smaller farms can benefit from innovative technologies that are less capital intensive and improve the logistics of manure storage, transport, and application. For smaller operations, one way to approach innovation is by asking the question “What innovations add value for producers at smaller operations by providing a greater degree of manure management flexibility?”

What will the audience take away from this presentation?

In this panel, the moderators will provide a brief overview of the need for innovative manure management systems. Moderators will then pose a series of questions to panelists. First, we will hear “real world” experiences with innovative manure management technologies from technology developers and users. Second, we will hear about the specific operational and financial challenges livestock producers face and what types of technologies could respond to these challenges. Finally, we hope to identify scenarios in which innovative manure management technologies could have the greatest likelihood of success.

Panelists

  1. Josh Frye, Frye Poultry, Wardensville, WV.  Josh Frye runs a 700,000 plus broiler operation.  His company owns a fixed bed gasifier that can convert poultry litter into energy at the rate of 5 million btu per hour, per 1,000 lbs of litter.
  2. Matt Freund, Cowpots, East Canaan, CT. Matt Freund of Freund’s Family Farm in Connecticut runs a 275 cow dairy. Mr. Freund’s dairy produces biogas with an anaerobic digester and uses a process that Mr. Freund developed to manufacture biodegradable planting pots, CowPotsTM, out of separated manure fibers.
  3. Dr. Mark Johnson, EPA Corvallis Lab, Corvallis, OR.  Mark Johnson is a Research Soil Scientist with EPA’s Office of Research and Development (ORD) Corvallis Lab. Dr. Johnson is researching custom biochars generated from a variety of biomasses.
  4. Dr. Craig Frear, Washington State University, Puyallup, WA.  Craig Frear is an Associate Professor at Washington State University. Dr. Frear has extensive experience with anaerobic digestion and advanced nutrient recovery systems. Dr. Frear has developed and implemented these systems on dairies and other animal operations with a focus on optimizing total system performance and long-term financial sustainability.
  5. Dr. Ariel Szogi, USDA/ARS Coastal Plain Soil, Water and Plant Conservation Research Center, Florence, SC.  Ariel Szogi is a Research Scientist with USDA’s Agriculture Research Service (ARS). Dr. Szogi has developed a process called Quick Wash for extraction and recovery of phosphorus from poultry litter and animal manure solids.
  6. Kraig Westerbeek, Vice President of Environment, Engineering, and Support Services, Murphy-Brown LLC (livestock subsidiary of Smithfield Foods).  In this capacity he is heavily involved in the evaluation of current and new technologies for manure management. He is from Warsaw, NC, and has been employed by Murphy-Brown for 22 years, primarily in the environmental area.

Moderators

  1. Joseph Ziobro, Office of Wastewater Management, U.S. EPA (ORISE fellow). Joseph Ziobro is an O.R.I.S.E. Research Participant at U.S. EPA, Office of Wastewater Management, Rural Branch. Mr. Ziobro supports the National Permit Discharge Elimination System (NPDES) permit program for concentrated animal feeding operations.
  2. Nina Bonnelycke, Office of Wastewater Management, U.S. EPA. Nina Bonnelycke is a Policy Analyst at the U.S. Environmental Protection Agency, Office of Wastewater Management, Rural Branch.  Ms. Bonnelycke has extensive experience in cost/benefit analysis of environmental programs.

Image of moderator, Joseph ZiobroJoseph Ziobro

U.S. Environmental Protection Agency

Joseph is a Research Participant at the Oak Ridge Institute for Science and Education (ORISE) research program at the US Environmental Protection Agency (EPA) in the Office of Wastewater Management. He supports the implementation of the National Pollutant Discharge Elimination System (NPDES) permitting program for concentrated animal feeding operations. Joseph also supports collaborative initiatives with the animal agriculture industry that protect and restore water quality. In 2013, Joseph earned a Master’s degree in Environmental Science from the State University of New York (SUNY) College of Environmental Science and Forestry (ESF), with a focus on coupled human and natural systems.

Image of moderator, Nina BonnelyckeNina Bonnelycke

U.S. Environmental Protection Agency

Ms. Bonnelycke is a Policy Analyst at the U.S. Environmental Protection Agency, Office of Wastewater Management, Rural Branch.  She has served EPA for close to 25 years and has extensive experience in cost/benefit analysis of environmental programs.  Ms. Bonnelycke has supported EPA’s efforts on water quality issues connected to animal agriculture since 2001.  She has worked in a variety of other program areas including solid and hazardous waste, stratospheric ozone protection, and climate change.  Ms. Bonnelycke has a Master’s in Public Policy from the University of California, Berkeley.

The authors are solely responsible for the content of these proceedings. The technical information does not necessarily reflect the official position of the sponsoring agencies or institutions represented by planning committee members, and inclusion and distribution herein does not constitute an endorsement of views expressed by the same. Printed materials included herein are not refereed publications. Citations should appear as follows. EXAMPLE: Authors. 2015. Title of presentation. Waste to Worth: Spreading Science and Solutions. Seattle, WA. March 31-April 3, 2015. URL of this page. Accessed on: today’s date.

Composted Horse Manure and Stall Bedding Pilot Project

Why Study Compost as Bedding for Horses?

The purpose of this project was to study and promote the use of compost as an alternative horse stall bedding and encourage horse owners and managers to think more creatively about manure management. Our objective was to reduce bedding use, and improve manure management practices at equine facilities in Snohomish County, Washington State.

Recreational and professional horse owners contribute to maintaining agricultural open space and supporting the agricultural infrastructure and local economy. Horse owners have historically been overlooked as contributors to animal agriculture, and as a result many horse owners lack a basic knowledge about manure and nutrient management. They are not aware of their impact on water and soil quality. Disposal of used stall bedding is costly for horse owners in northwestern Washington State, and has a potentially large impact on water quality. Disposal practices often include filling in low spots and ravines, or building massive piles. Composting manure at high temperatures eliminates pathogens and parasites, stabilizes nutrients, and reduces odors and vector attraction.

What did we do?

The Snohomish Conservation District (SCD) worked with ten commercial and two private equine facilities to test the use of compost as an alternative horse stall bedding material. Facilities ranged in size from 5 to >20 stalls. The primary system used for composting and reusing bedding involved a micro-bin composter (O2 Compost, Snohomish, WA) and a Stall Sh*fter® (Brockwood Farm, Nashville, IN). Micro-bins were assembled on-site and filled with used stall bedding (Fig.1-2).

Figure 1. Assemble compost micro-bin on site and fill with manure and beddingFigure 2. Turn on blower to provide aeration and monitor temperature

After 30 days of composting, the bin was emptied and the manure was separated from the bedding (Fig. 3). The composted bedding was then used in a stall (Fig. 4). Equine facility managers provided feedback on the effectiveness, perception, and impacts of using the compost as stall bedding. Results varied between trial sites based on type and quantity of bedding used, season, and stall management practices.

Figure 3. After 30 days of composting, empty the bin and sort the composted manure from the bedding using the Stall Sh*fter (registered trademark)

Figure 4. Use composted bedding in the stall and composted manure in the garden.

What have we learned?

Composted stall waste makes a soft absorbent bedding for horses or other livestock. Composted bedding is less dusty than shavings or wood pellets, darker in color, and has a pleasant earthy odor. There were no reports of composted bedding increasing stall odors or flies, or negatively impacting horse health. The best results were reported when mixing the composted bedding with un-composted bedding in equal proportions or two parts compost to one part bedding. There were some reports of horses with skin and respiratory conditions improving during the time they were on composted bedding, including thrush in the feet, hives and “rain rot” on the body, and “scratches” on the legs.

When separating the composted manure from the bedding, the amount and type of bedding determines the effectiveness of a bedding re-use system. Concern about appearances was more prevalent than concern about disease or parasite transfer. Even though barn managers were not entirely ready to make the switch to composted bedding, this project helped start many conversations (in person, through publications, and social media) about manure management and resource conservation. It was a great opportunity to help horse owners make the mental leap from “waste” to “resource”.

Future Plans

This project demonstrated that compost is a safe and effective horse stall bedding. Future work should be focused in three areas:

1. Developing systems for making composted bedding that are practical on a large scale and provide an economic incentive for large equine facilities to recycle their waste.

2. Outreach and education programs directed at horse owners who board their animals at commercial facilities. Would some horse owners be willing to pay a premium to board their horses at a facility that is managed in an environmentally sustainable manner?

3. Clinical trials to examine the effects of composted bedding on skin and respiratory conditions.

Author

Caitlin Price Youngquist, Agriculture Extension Educator, University of Wyoming Extension cyoungqu@uwyo.edu

Additional information

Visit http://BetterGround.org, a project of the Snohomish Conservation District.

The full report, including photographs of trial sites, is available on the Western SARE website: https://projects.sare.org/sare_project/ow11-315/

Acknowledgements

I would like to thank all of the farm owners and managers who very graciously participated in this project and were willing to try something new. The contribution of time and energy is very much appreciated.

Thanks also to the staff at O2 Compost for their efforts, ideas, and creativity. This would not have been possible without them.

And Mollie Bogardus for helping take this project to the next level, and explore all the possibilities.

The authors are solely responsible for the content of these proceedings. The technical information does not necessarily reflect the official position of the sponsoring agencies or institutions represented by planning committee members, and inclusion and distribution herein does not constitute an endorsement of views expressed by the same. Printed materials included herein are not refereed publications. Citations should appear as follows. EXAMPLE: Authors. 2015. Title of presentation. Waste to Worth: Spreading Science and Solutions. Seattle, WA. March 31-April 3, 2015. URL of this page. Accessed on: today’s date.

Environmental Management on Equine Farms or the Good, the Bad, and the Ugly

Why Look at Environmental Practices of Horse Farms?

Equine farms are often small acreages that may not have ready access to technologies and information appropriate to their farms. Westendorf et al. (2010a) found that many equine farmers use extension services less than other sources of information, but they may use feed stores or neighbors for information (Table 1); Marriott et al. (2012) also found a limited understanding of available conservation resources among equine farmers. Best Management Practice (BMP) adoption on equine farms is the focus of this paper.

Related: Managing Manure on Horse Farms

Table 1. Manure management information sources on equine farms (Total Respondents – 442)

Another Horse Farmer Trade Magazines Cooperative Extension Other Feed Dealer Internet Other Retailer
221 183 229 116 97 89 26

Westendorf et al. (2010a,b)

What did we do?

Equine farms generally dry stack their waste; in a NJ survey (Westendorf, et al. 2010b) over 70% of farms indicate storing manure on farm, many of these sites may lack BMP’s appropriate for a storage (Table 2, 3). Eighty-three percent in this survey had manure storages located greater than 61m from water or wetlands, and 86% had storages located greater than 61m from neighbors; this might indicate their storage does not pose a significant water quality or nuisance risk. Fiorellino et al. (2010) found that even with low levels of BMP adoption, most equine farms had a reduced water quality risk. Over 50% of NJ farmers indicate that they compost manure, but it is my observation that few actually do; the definition of compost may vary from mature compost to rotting decomposition. Seventy-five percent of farms bed with wood shavings, 25% with straw and the remainder with a combination of wood chips, wood pellets, and paper.

Table 2.  Percentage of New Jersey equine survey farms implementing various management practices (%)

Spread manure on farm
Manure storage area
Compost horse manure
Off-farm manure disposal
Maintain and use dry lot areas
Credit manure as a fertilizer
Regular soil tests
Drag pastures regularly
Clean stalls daily
Manure storage <50 ft. from water
Manure storage >200 ft. from water
Manure storage <50gt. from neighbor
Manure storage >200 ft. from neighbor
54
74
47
58
47
39
32
75
70
1.1
83.2
1.1
86.4

Westendorf, et al. (2010b)


Table 3. Percentage of equine survey farms spreading or storing manure (%)

No. of horses Spread Manure (n = 442) Manure Storage (n = 434)
1 to 2 55.2 65.3
3 to 5 59.2 62.9
6 to 10 55.3 80.7
11 to 20 50.0 87.9
21 to 40 37.8 94.4
> 40 37.5 93.3

Westendorf, et al. (2010b)

Nearly 60% of horse farms dispose of some manure off the farm; for use as fertilizer, to a centralized composter, on-farm compost for sale, or to be given away are the prime means of disposal; unfortunately some is removed by dumpster. Fifty-four percent spread some manure on-farm, of these only 39% account for any fertilizer value. If we trust the survey, then probably only 20-25% of the farms have an understanding of the fertilizer value of manure; this survey did find a positive correlation between manure spreading and soil testing (P<.05), suggesting some understanding of soil fertility basics.

Fifty-three percent of farms had a sacrifice or exercise lot that provides horses an area for eating, drinking, shelter, and relaxing if needed. A sacrifice area can help to protect pasture and grazing areas. Many farms only have a turnout lot for both exercise and grazing; this can result in greater mud accumulation and other possible water quality concerns.

A feed management survey (Westendorf, et al. 2013) was sent to 500 NJ equine farmers (see Table 4). Forty-five percent received feeding and nutrition information from a feed store, 20% from a veterinarian, only 3% from a professional consultant and 2% from extension. Most farmers had no concept of feeding to reduce excretion of nutrients such as phosphorus. Monitoring intake, cleaning feed bunks and contaminated lots regularly, and disposing all waste feed in the manure storage are good recommendations for all producers. Please see the Williams et al. (2015) abstract in the poster session for more information about an on-farm feeding project.

Table 4. Description of how feeding decisions are made (%)

Balance diets on your own Veterinarian advice No plan at all Feed store advice Consulting nutritionist Extension advice
45 20.5 15 14.5 3 2

Westendorf, et al. 2013

What have we learned?

In summary: 1. Many horse farms dispose some or all manure off-site; 2. Between 50 and 75% spread manure on crop or grazing land; 3. Most have at least a designated location for manure storage; 4. Larger farms are more likely to store manure. 5. Many farms have a low non-point source (NPS) pollution risk, but little understanding of BMP’s; and 6. Pasture management BMP’s are seldom applied.

Future Plans

Outreach should focus on the implementation of low-cost management practices that equine farmers are likely to adopt.

Author

Michael L. Westendorf, Extension Specialist in Animal Science, Rutgers, the State University of New Jersey westendorf@aesop.rutgers.edu

Reference

Fiorellino, N. M., J. M. McGrath, B. Momen, S. K. Kariuki, M. J. Calkins and A. O. Burk. 2014. Use of Best Management Practices and Pasture and Soil Quality on Maryland Horse Farms. J. Equine Vet. Sci. 34:257-264.

Marriot, J. M., A. Shober, P. Monaghan and C. Wiese. 2012. Equine Owner Knowledge and Implementations of Conservation Practices. J. of Extension. 50: Issue 5. https://archives.joe.org/joe/2012october/pdf/JOE_v50_5rb4.pdf

Westendorf, M. L., T. Joshua, S. J. Komar, C. Williams, and R. Govindasamy. 2010a. Effectiveness of Cooperative Extension Manure Management Programs. J. Equine Vet. Sci. 30:322-325.

Westendorf, M. L., T. Joshua, S. J. Komar, C. Williams, and R. Govindasamy. 2010b. Manure Management Practices on New Jersey Equine Farms. Prof. Anim. Sci. 26:123-129.

Westendorf, M. L., V. Puduri, C. Williams, T. Joshua, and R. Govindasamy. 2013. Dietary and Manure Management Practices on Equine Farms in Two New Jersey Watersheds. J. Equine Vet. Sci. 33:601-606.b

Acknowledgements

This work supported by the New Jersey State Equine Initiative, the Rutgers Equine Science Center, and the New Jersey State Department of Agriculture.

Special thanks to Troy Joshua, USDA-NASS, New Jersey for help in setting up some of the surveys.

The authors are solely responsible for the content of these proceedings. The technical information does not necessarily reflect the official position of the sponsoring agencies or institutions represented by planning committee members, and inclusion and distribution herein does not constitute an endorsement of views expressed by the same. Printed materials included herein are not refereed publications. Citations should appear as follows. EXAMPLE: Authors. 2015. Title of presentation. Waste to Worth: Spreading Science and Solutions. Seattle, WA. March 31-April 3, 2015. URL of this page. Accessed on: today’s date.

Extension Recognizes Pennsylvania Farms that Adopt Sound Management Practices Protecting Water Quality and the Environment

penn state extension environmental friendly farm signPurpose

The Environmentally Friendly Farm program was developed by Penn State Equine Extension and is designed to recognize farms that adopt environmentally sound management practices that protect water quality and the environment. The program is supported by funds from the USDA Natural Resource Conservation Service (NRCS), Conservation Innovation Grant. Strategies are employed on Environmentally Friendly Farms to maintain productive pastures, reduce soil erosion, limit nutrient runoff from animal facilities and barnyards, safely store manure, recycle nutrients, and control animal access to surface waters. Excess sediment and nutrient runoff from manure poses health threats not only to the environment, but also to animals and people. Farm managers who practice environmental stewardship maintain healthy environments for their animals, their families, and their community.

What did we do?

Farm managers can apply for the program by request a copy of the application from Penn State Equine Extension by visiting us online at http://www.extension.psu.edu/equine, emailing or calling our extension office. Second, complete the Environmentally Friendly Farm application requesting background information about the farm operation.

Next, complete the Environmentally Friendly Farm Self-Assessment Checklist. Each statement is checked “yes” if the practice is in place on the farm, “no” if the practice is not in place or “non-applicable if the statement does not pertain to the farm operation. The checklist consists of a series of statements that identify potential on-farm practices in the following areas: Environmentally Sensitive Areas, Pastures, Animal Concentration Areas, Manure Storage, and Mechanical Manure Application.

Once the paperwork has been received, a farm site visit will be scheduled. Personnel from Penn State Extension, the County Conservation District, or the Natural Resource Conservation District (NRCS) will visit farms to verify that statements made in the application and checklists are accurate. At the same time, additional information and assistance will be provided to help improve farm management and develop any necessary plans for the farm.

The farm will be recognized by the public, conservation and agricultural agencies, and other farm managers as an operation that is committed to clean water and a healthy environment. Each farm manager will receive an Environmentally Friendly Farm sign that can be displayed on the farmstead. Farms that qualify will also be given permission to use the Environmentally Friendly Farm artwork on their website, brochure, and other marketing materials. Approved farms will be listed on the Penn State Equine Extension website.

This recognition will reflect the commitment of the farm manager to environmental stewardship and can serve as a marketing tool for the farm.

What have we learned?

After personnel visited farms to verify that statements made in the application and checklists are accurate. At the same time, additional information and assistance is provided to help improve farm management and develop any necessary plans for the farm. In addition, agency personal developed a personal relationship with the farm manager. The farm managers who practice environmental stewardship maintain healthy environments for their animals, their families, and their community.

Future Plans

This program will be continued through 2016. We hope to provide additional information and assistance to help improve farm management.

Authors

Ann Swinker, Extension Horse Specialist aswinker@psu.edu

Donna Foulk, Helene McKernan, Pennsylvania State University, University Park, PA 16802

Additional information

Farms can request a copy of the application from the Penn State Extension Equine Team by visiting us online at http://www.extension.psu.edu/equine

Acknowledgements

This program was funded partly by a USDA NRCS-CIG grant.

The authors are solely responsible for the content of these proceedings. The technical information does not necessarily reflect the official position of the sponsoring agencies or institutions represented by planning committee members, and inclusion and distribution herein does not constitute an endorsement of views expressed by the same. Printed materials included herein are not refereed publications. Citations should appear as follows. EXAMPLE: Authors. 2015. Title of presentation. Waste to Worth: Spreading Science and Solutions. Seattle, WA. March 31-April 3, 2015. URL of this page. Accessed on: today’s date.

Validation of Near-Infrared Reflectance Spectral Data for Analyzing Horse Manure

Can Near-Infrared Reflectance Spectroscopy (NIRS) Be Used For Analyzing Horse Manure?

Increased horse numbers and insufficient acreage limit the ability for on-farm use of horse manure. Nearly 58% of surveyed farmers in NJ indicate that some manure was disposed off-farm while only 54% spread any manure on the farm (Westendorf et al., 2010). Analysis of manure by Near-Infrared Reflectance Spectroscopy (NIRS) could be a useful means of determining nutrient and energy content without time consuming efforts of wet chemistry and other laboratory analyses if horse manure is used as a fertilizer or energy source. The NIRS analysis works by subjecting samples to a concentrated light of a known spectrum and measuring the absorbance of the reflected beam (Dyer and Feng, 1997). Covalent chemical bonds of the common organic elements (Carbon, Nitrogen, Oxygen and Hydrogen) have strong absorbance in the NIRS region, useful because there is a correlation between absorbance and concentration (Malley et al., 2002). By comparing data between samples generated by NIRS to laboratory analysis of the same samples, NIRS equipment can be calibrated for practical use. The objectives of this project were: 1) determine the nutrient content and value of horse manure, and make NIRS calibrations based on previously determined wet chemistry values, and 2) determine if ash or Neutral Detergent Fiber (NDF) content can be used to predict Gross Energy (GE) levels.

What did we do?

Horse manure consisting of 123 solid dry stack manure samples, were collected from 30 NJ farms over four seasons during a 12-month period in 2008-2009. Samples were collected from various random locations in a manure pile in ~ 4 l sealable plastic bags, frozen, and stored until analysis. All samples were dried at 55o C to a constant weight in a Thermocore® oven. Following drying, all samples were ground to a particle size of 5-10 mm in a Waring® industrial blender, referred to as Coarse ground samples. Samples were sent to DairyOne Laboratories in Ithaca, NY and analyzed for manure components (Total-N, P2O5, K2O, NDF, and GE); samples were analyzed for Ash by the Rutgers University Soil Testing Laboratory. Coarse ground samples were further ground in a coffee grinder to a particle size between 2-3 mm (these samples are referred to as Fine ground samples). All NIRS analysis of Coarse and Fine ground samples were made with a Unit y Scientific Spectrastar ™ 2400 Drawer model (Brookfield, CT). Samples were scanned at 1nm intervals over the wavelength range of 1250-2350 nm, as prescribed by Unity Scientific. Data from the DairyOne Laboratory results were used as reference values to develop calibrations using the Ucal™ software package (Unity Scientific, Brookfield, CT) set at default values using a partial linear squares statistical model.

What have we learned?

On a dry matter basis (Table 1) samples averaged 1.3% N, 1.1% P2O5, 1.5% K2O, 69.2% NDF, 3800 kCal/g GE, and 24% Ash. The NIRS equations (Table 2) for Coarse (5-10 mm) ground horse manure predicted nutrient content, R-squared values of 0.76, 0.71, 0.69, 0.46, 0.77, and 0.87 for N, P2O5, K2O, NDF, GE, and Ash, respectively. The NIRS also predicted Fine (2-4 mm) ground horse manure R-squared values of 0.83, 0.55, 0.50, 0.57, 0.89, and 0.92 for N, P2O5, K2O, NDF, GE, and Ash, respectively. Ash, GE and NDF were regressed to determine how effectively Ash and NDF would predict GE (Table 3); NDF was a poor predictor of GE content (R-squared of 0.32), while Ash was a good predictor (R-squared of 0.96).

Future Plans

This research suggests that NIRS can be useful for predicting nutrient content of horse manure and that Ash is a good predictor of energy content. A comparative field trial on horse farms is planned for follow-up.

Authors

Michael L. Westendorf. Extension Specialist in Animal Science. Rutgers, the State University of New Jersey westendorf@aesop.rutgers.edu

Zane R. Helsel. Extension Specialist in Plant Biology and Pathology. Rutgers, the State University of New Jersey.

Additional information

Author Contact Information:

Michael Westendorf

Rutgers, The State University of New Jersey

84 Lipman Drive

New Brunswick, NJ 08901

Phone: 848-932-9408

e-mail: westendorf@aesop.rutgers.edu

Reference:

Dyer, D. J. and P. Feng. 1997. NIR Destined to be Major Analytical Influence. Feedstuffs Magazine. November 10, 1997.

Malley, D.F., Yesmin, L., and Eilers, R. G. 2002. Rapid Analysis of Hog Manure and Manure- amended Soils Using Near-infrared Spectroscopy. Soil Science Society of America Journal. 2002. 1677-1686.

Westendorf, M. L., T. Joshua, S. J. Komar, C. Williams, and R. Govindasamy. 2010. Manure Management Practices on New Jersey Equine Farms. Prof. Anim. Sci. 26:123-129.

Acknowledgements

Supported in part by the State Equine Initiative. Rutgers Equine Science Center. New Jersey Agricultural Experiment Station.

The authors are solely responsible for the content of these proceedings. The technical information does not necessarily reflect the official position of the sponsoring agencies or institutions represented by planning committee members, and inclusion and distribution herein does not constitute an endorsement of views expressed by the same. Printed materials included herein are not refereed publications. Citations should appear as follows. EXAMPLE: Authors. 2015. Title of presentation. Waste to Worth: Spreading Science and Solutions. Seattle, WA. March 31-April 3, 2015. URL of this page. Accessed on: today’s date.

Rotational Grazing Effects on Pasture Nutrient Content


Why Look at Rotations Grazing in Horse Pastures?

Rotational grazing is a recommended strategy to improve pasture health and animal performance. Previous studies have reported improved forage quality in rotationally grazed pastures compared to those continuously grazed by cattle, but data are limited for horse pastures.

What did we do?

A study at the University of Tennessee was conducted to evaluate the effects of rotational grazing on the nutrient content of horse pastures. A 2.02 ha rotational grazing pasture (RG) and a 2.02 ha continuous grazing pasture (CG) were each grazed by three adult horses at a stocking rate of 0.6 ha/horse over a two year period. The RG system was divided into four 0.40 ha paddocks and a heavy use area. Pastures were maintained at uniform maximum height of 15 to 20 cm by mowing. Horses were rotated between the RG paddocks every 10 to 14 d, or when forage was grazed to a height of approximately 8 cm. Pasture forage samples (n = 520) were collected and composited monthly (n = 14) during the growing season (April to November) by clipping forage from randomly placed 0.25 m2 quadrates from RG and CG, as well as before and after grazing each RG paddock. Botanical composition and percent ground cover were visually assessed. Forage samples were oven dried at 60°C in a forced air oven for 72 h to determine DM. Forage biomass yield (kg/ha), digestible energy (DE, Mcal/kg), crude protein (CP), acid detergent fiber (ADF), neutral detergent fiber (NDF), lignin, calcium (Ca), phosphorous (P), potassium (K), magnesium (Mg), ash, fat, water soluble carbohydrates (WSC), sugar and fructan were measured using a FOSS 6500 near-infrared spectrometer. Data were analyzed using paired T-tests and differences were determined to be significant at P < 0.05. Data are reported as means ± SEM as a percent of DM.

What have we learned?

Table 1. Nutrient content of continuously grazed (CG) pasture and rotationally grazed (RG) pasture. Data are summarized as means ± SE.
Nutrient Continuous Rotational
DM, % 91.72 ± 0.36 91.89 ± 0.34
DE, Mcal/kg 2.31 ± 0.064 2.42± 0.039*
CP, % 14.92 ± 0.77 15.79 ± 0.64
ADF, % 33.16 ± 1.21 30.81 ± 0.82*
NDF, % 56.80 ± 1.75 53.53 ± 1.65*
Lignin, % 3.47 ± 0.38 2.88 ± 0.32*
Ca, % 0.69 ± 0.11 0.68 ± 0.11
P, % 0.25 ± 0.009 0.27 ± 0.008*
K, % 1.92 ± 0.10 2.11 ± 0.087*
Mg, % 0.25 ± 0.009 0.26 ± 0.007
Ash, % 9.35 ± 0.83 9.39 ± 0.66
Fat, % 2.65 ± 0.12 2.83 ± 0.08
WSC, % 4.95 ± 0.60 6.72 ± 0.71*
Sugar, % 3.33 ± 0.50 4.86 ± 0.55*
Fructan, % 1.61 ± 0.15 1.59 ± 0.16
*means within rows differ; P < 0.05

Forage biomass yield did not differ between RG and CG (2,125 ± 52.2; 2,267 ± 72.4 kg/ha, respectively). The percentage of grass species was greater in RG compared to CG (81.7 ± 3.9; 73.9 ± 4.5, respectively) and the percentage of weed species was lower in RG compared to CG (3.4 ± 0.8; 12.0 ± 1.5, respectively). Tall fescue, kentucky bluegrass, bermudagrass and white clover were the dominant forage species. Rotational grazing increased forage quality compared to continuous grazing. The RG system was higher in DE (Mcal/kg), phosphorous (P), potassium (K), water soluble carbohydrates (WSC), and sugar compared to the CG system (Table 1). While there wasn’t a significant difference in crude protein (CP) content between RG and CG, the numerical difference could potentially affect animal performance. The RG pasture was lower in acid detergent fiber (ADF), neutral detergent fiber (NDF) and lignin compared to the CG pasture. Within the RG pasture, forage nutrient content declined following a grazing period, but recovered with rest. Paddocks were lower in DE, CP, P, K, Fat, WSC and sugar while they were higher in ADF and NDF after grazing compared to before grazing (Table 2).

Table 2. Nutrient content of rotational grazing (RG) paddocks before and after grazing. Data are summarized as means ± SE.
Nutrient Before After
DM, % 91.84 ± 0.27 91.84 ± 0.39
DE, Mcal/kg 2.34 ± 0.03 2.21 ± 0.02*
CP, % 14.98 ± 0.39 13.71 ± 0.43*
ADF, % 32.24 ± 0.54 34.33 ± 0.48*
NDF, % 55.97 ± 0.88 59.24 ± 0.89*
Lignin, % 2.79 ± 0.20 3.41 ± 0.25*
Ca, % 0.58 ± 0.05 0.59 ± 0.05
P, % 0.28 ± 0.004 0.25 ± 0.006*
K, % 2.11 ± 0.08 1.72 ± 0.07*
Mg, % 0.26 ± 0.007 0.26 ± 0.009
Ash, % 8.76 ± 0.19 8.79 ± 0.21
Fat, % 2.64 ± 0.05 2.45 ± 0.06*
WSC, % 6.05 ± 0.47 4.85 ± 0.39*
Sugar, % 4.40 ± 0.38 3.22 ± 0.30*
Fructan, % 1.67 ± 0.15 1.69 ± 0.16
*means within rows differ; P < 0.05

Future Plans

Rotational grazing may be a preferred alternative to continuous grazing as it favors grass production, suppresses weeds and increases energy and nutrient content of pastures. While rotational grazing may be beneficial from an environmental and animal production standpoint, an increase in DE and WSC may pose a risk for horses prone to obesity and metabolic dysfunction. Appropriate precautions should be taken in managing at risk horses under rotational grazing systems. This work is being continued at Virginia Tech and other universities to further understand the use of rotational grazing systems for horses.

Authors

Bridgett McIntosh, Equine Extension Specialist, Virginia Tech bmcintosh@vt.edu

Matt Webb, Ashton Daniel, David McIntosh and Joe David Plunk, University of Tennessee

Additional information

http://www.arec.vaes.vt.edu/middleburg/

Acknowledgements

The authors thank the University of Tennessee Middle Tennessee Research and Education Center and the Tennessee Department of Agriculture’s Nonpoint Source Pollution 319 Water Quality Grant for their support of this project.

The authors are solely responsible for the content of these proceedings. The technical information does not necessarily reflect the official position of the sponsoring agencies or institutions represented by planning committee members, and inclusion and distribution herein does not constitute an endorsement of views expressed by the same. Printed materials included herein are not refereed publications. Citations should appear as follows. EXAMPLE: Authors. 2015. Title of presentation. Waste to Worth: Spreading Science and Solutions. Seattle, WA. March 31-April 3, 2015. URL of this page. Accessed on: today’s date.

Ethnobotanical Control of Odor in Urban Poultry Production: A Review


Purpose

Urban agriculture has been growing as the movement of population to the urban centers is increasing. According to FAO (2008), by 2030 majority of the population in sub sahara Africa (SSA) would be living in the urban area. Pollution from animal manure is a global concern and is much more acute and serious in countries with high concentrations of animals on a limited land base for manure disposal (Roderick, Stroot and Varel, 1998), this is the case with urban livestock production. Environmental pollution and odor complaints related to animal production have increased dramatically during the past decade (Ernest and Ronald, 2004). These odors potentially interfere with quality and enjoyment of life (Mauderly, 2002 and Albert, 2002). According to Pfost, Fulhage and Hoehne, 1999, odor complaints are more common when the humidity is high and the air is still or when the prevailing breezes carry odors toward populated areas. Inspite of the role that urban agriculture can play in pursuing the Millennium Development Goals, more specifically those, related to poverty reduction, food security, and environmental sustainability, odor from livestock still remains a major obstacle to future development. According to Obayelu 2010 there has been public’s increasing intolerance of livestock odors, hence the need to find solutions which will be ecosystem friendly. This paper will review some methods of odor control focusing on natural solutions to this problem.

What did we do?

For an odor to be detected downwind, odorous compounds must be: (a) formed, (b) released to the atmosphere, and (c) transported to the receptor site. These three steps provide the basis for most odor control. If any one of the steps is inhibited, the odor will diminish. (Chastain, 2000)

There are four general types of compounds for odor control: (1) masking agents that override the offensive odors, (2) counteractants that are chemically designed to block the sensing of odors, (3) odor absorption chemicals that react with compounds in manure to reduce odor emission, and (4) biological compounds such as enzymatic or bacterial products that alter the decomposition so that odorous compounds are not generated (Chastain, 2000). Some of these compounds are added directly to the manure while others are added to the feed. Yucca schidigera is a natural feed additive for livestock and poultry used to control odors, ammonia and other gas emissions, which can be detrimental to livestock performance. Essential oils are being promoted as effective and safe antimicrobial or antiviral (disinfectant) agents that also act as masking agents in the control of odor examples are thymol and carvacrol. Natural zeolite, clinoptilolite (an ammonium-selective zeolite), has been shown t o enhance adsorption of volatile organic compounds and odor emitted from animal manure due to its high surface area. Cai et al. (2007) reported reduction >51% for selected offensive odorants (i.e. acetic acid, butanoic acid, iso-valeric acid, dimethyl trisulfide, dimethyl sulfone, phenol, indole and skatole) in poultry manure with a 10% zeolite topical application. Treatment of broiler litter with alum was originally developed to reduce the amount of soluble phosphorous in poultry litter. However, it was also observed that using alum reduced the pH of the litter to below 6.5, and as a result, reductions in ammonia emissions from the litter have been observed.

Amendment of manure with alkaline materials such as cement kiln dust, lime, or other alkaline by-products can increase the pH to above 12.0, which limits the vast majority of microbialactivity, including odor producing microorganisms (Veenhuizen and Qi, 1993, Li et al., 1998). The effect of the addition of lime and other ONAs that alter the pH and moisture content of the waste and bedding requires further scientific research (McGahan, et al., 2002).

Dust particles can carry gases and odors. Therefore, dust control in the buildings can reduce the amount of odor carried outside. Management practices that can greatly reduce the amount of dust in poultry buildings are Clean interior building surfaces regularly, Reduce dust from feed, this can be by addition of oil to dry rations, proper and timely maintenance of feeders, augers, and other feed handling equipment. Also managing the relative humidity (RH) in poultry houses. Planting just three rows of trees around animal farms has also been proven to cut nuisance emissions of dust, ammonia, and odors from poultry houses. The use of tress around livestock facilities to mitigate odour and improve air quality has been recently reviewed by Tyndall and Colletti (2000). They concluded that trees have the potential to be an effective and inexpensive odor control technology particularly when used in combination with other odour control methods. Trees ameliorate odours by dilutio n of odour, encourage dust and aerosol deposition by reducing wind speeds, physical interception of dust and aerosols, and acting as a sink for chemical constituents of odour.

What have we learned?

The use of indigenous microorganisms for odor reduction related to livestock is being promoted under Natural farming, in this instance cultured mixtures of microorganisms consisting mainly of lactic acid bacteria, purple bacteria and yeast are used. This is already made into commercial product and marketed as effective microorganism activated solution (EMAS).

Interestingly, there is paucity of information on ethnobotanicals that are useful for odour control. Most literatures on ethnobotany focused of treatment and control of animal diseases but not on traditional control of the environment of livestock. As scientists are still working hard to develop chemical or biological additives which will eliminate or reduce odors associated with poultry wastes there is the need to survey traditional livestock owners for information that can serve for development of effective,inexpensive, efficient and suitable agent for odor control in poultry management.

Corresponding author, title, and affiliation

Oyebanji Bukola, Department of Animal Sciences, Obafemi Awolowo University, Ile-Ife, Nigeria

Corresponding author email

Oyebanji.bukola44@gmail.com

References

Albert, H. (2002) Outdoor Air Quality. Livestock Waste Facilities Handbook, Midwest Plan Service (MWPS),
Iowa State University in Ames, Iowa. Volume 18, section 3 Page 96.

Cai, L., Koziel, J.A., Liang, Y., Nguyen, A.T., and H. Xin. 2007. Evaluation of zeolite for
control of odorants emissions from simulated poultry manure storage. J. Environ. Qual.
36:184-193.

Chastain, J.P., and F.J. Wolak. 2000. Application of a Gaussian Plume Model of Odor
Dispersion to Select a Site for Livestock Facilities. Proceedings of the Odors and VOC
Emissions 2000 Conference, sponsored by the Water Environment Federation, April 16-19,
Cincinnati, OH., 14 pages, published on CD-ROM.

Ernest, F.B and Ronald, A.F.(2004) An Economic Evaluation of Livestock Odor Regulation Distances.
Journal of Environmental Quality, Volume 33, November–December 2004

FAO 2008. Urban agriculture for sustainable poverty alleviation and food security. FAO Rome

Mauderly, J.L. (2002) Health Effects of Mixtures of Air Pollutants. Air Quality and Health: State of the Science, Proceedings of the Clean Air Strategic Alliance Symposium, Red Deer, Alberta, Canada, June 3-4, 2002.

McGahan. E, Kolominska, C Bawden, K. and Ormerod. R (2002). Strategies to reduce odour emissions from Meat chicken farms Proceedings 2002 Poultry Information Exchange

Pfost, D. L., C. D. Fulhage, and J. A. Hoehne (1999) Odors from livestock operations: Causes and possible cures. Outreach and Extension Pub. # G 1884. University of MissouriColumbia.

Obayelu, A. E 2010. Assessment Of The Economic And Environmental Effects Of Odor Emission From Mechanically Ventilated Livestock Building In Ibadan Oyo State Nigeria. International Journal of science and nature VOL. 1(2) 113-119

Tyndall, J. and J. Colletti. 2000. Air quality and shelterbelts: Odor mitigation and livestock production a literature review. Technical report no. 4124-4521-48-3209 submitted to USDA, National Agroforestry Center, Lincoln, NE.

The authors are solely responsible for the content of these proceedings. The technical information does not necessarily reflect the official position of the sponsoring agencies or institutions represented by planning committee members, and inclusion and distribution herein does not constitute an endorsement of views expressed by the same. Printed materials included herein are not refereed publications. Citations should appear as follows. EXAMPLE: Authors. 2015. Title of presentation. Waste to Worth: Spreading Science and Solutions. Seattle, WA. March 31-April 3, 2015. URL of this page. Accessed on: today’s date.

The North American Partnership for Phosphorus Sustainability: Creating a Circular P Economy as Part of a Sustainable Food System


Purpose           

To promote and foster the implementation of sustainable P solutions in both the private and public sectors

People standing in the formation of a &#039;P&#039;What did we do? 

Recently, a team of Phosphorus researchers initiated the North American Partnership for Phosphorus Sustainability (NAPPS) with seed funding from Arizona State University. The goal of North American Partnership for Phosphorus Sustainability (NAPPS) is to actively engage stakeholders (e.g. corporations, national and local policy makers, planners and officials, representatives of agriculture, industry) to promote and foster the implementation of sustainable P solutions in both the private and public sectors. NAPPS seeks to engage partners in identifying key bottlenecks and strategies for decision-making, policy, and implementation of P efficiency and recycling technologies.

What have we learned? 

Phosphorus is necessary for life, and is essential for agricultural production, and so for food security. The growing world population, changing diets of humans to more meat and dairy and growing use of phosphate additives, and biomass production for energy or industrial uses result in an increasing need for phosphorus input, and the world is today heavily dependent on non-renewable, finite phosphate rock reserves that which are concentrated in a small number of countries, posing geopolitical vulnerability. These trends lead to the depletion of phosphate rock resources, pressure on and instability in phosphate prices, decreasing quality and increasing contaminant loads of remaining reserves, and unstable, insecure P supply for regions without local rock resources, especially in the developing world. At the same time, excess P is lost from the food system at multiple points. The result is eutrophication of freshwater and coastal ecosystems – lo ss of the amenity value of lakes and rivers as well as toxic algal blooms and impacts on fisheries.

Phosphorus stewardship is therefore essential, and we must use P more efficiently in the agri-food system, and actively develop phosphorus reuse and recycling technologies and practices. At the same time, the issue of contaminants, both in phosphate rock and in recycled phosphates must be addressed, as well as the need to reduce phosphate inputs to surface waters where these are problematic. We can reduce the use of mined P by producing and applying fertilizer from recycled sources. By using improved practices and smarter crops, we can reduce the demand for P fertilizer and reduce the runoff to surface water bodies. By reducing and re-using food waste and eating food with lower P footprints we can lower our phosphorus consumption and demand. Collectively, these will also lessen the impacts of P runoff on precious water resources.

Future Plans 

NAPPS activities and stakeholder recruitment will be organized around four main sectors: P Recycling; P Efficiency in Food Production; BioEnergy and Food Choice; and Water Quality. Projects and activities will be decided by the Board of Directors, but may include:

1. Develop a common vision for creating a sustainable P cycle in North America

2. Identifying and helping businesses and other organizations respond to opportunities offered by challenges in P management and emerging research in P sustainability

3. Building networks between different interest groups and sectors related to phosphorus management and recycling

4. Evaluating new P efficiency and recycling technologies, including feasibility, availability of suppliers, inventory of existing technologies and companies, cost/benefit analysis, and life cycle analyses

5. Fostering implementation of new technologies by improving the efficiency of business value chains

6. Assessing and facilitating regulatory development pertaining to phosphorus management, including waste, environmental, discharge, and agriculture to improve P sustainability

7. Representing North American phosphorus managers and innovators in international meetings and initiatives

8. Preparing funding RFPs for demonstration projects and integration and dissemination of new technologies and concepts

Authors

Helen Ivy Rowe, Assistant Research Professor, School of LIfe Sciences, Arizona State University hirowe@asu.edu

James J. Elser, Regents Professor, School of LIfe Sciences, Arizona State University

Additional information                

http://sustainablep.asu.edu

Acknowledgements      

We thank Arizona State University for providing funds to launch this initiative.


Logo for Sustainable Phosphorus Initiative

The Sustainable Phosphorus Initiative - farm, food, fertilizer

The authors are solely responsible for the content of these proceedings. The technical information does not necessarily reflect the official position of the sponsoring agencies or institutions represented by planning committee members, and inclusion and distribution herein does not constitute an endorsement of views expressed by the same. Printed materials included herein are not refereed publications. Citations should appear as follows. EXAMPLE: Authors. 2015. Title of presentation. Waste to Worth: Spreading Science and Solutions. Seattle, WA. March 31-April 3, 2015. URL of this page. Accessed on: today’s date.