Most farms are on a continuous journey of environmental stewardship. This journey includes voluntary and regulatory pathways (e.g., programs, regulations) and checkpoints (e.g., certifications, production goals). Industry initiatives like the Net Zero Initiative (US Dairy) and Pork Cares (National Pork Board) provide goals that serve as destination descriptions, motivating collective action amongst their farms. However, industry initiatives do not dictate which mitigation actions can serve as the route. Every farm has a unique starting point in the present, and there are many pathways for the future that can be illuminated, shaped and supported by advisors.
This workshop was designed to provide the advisor community insights on opportunities to support the industries’ sustainability commitments through data, methods, and tools related to mitigation adoption. The desired outcome was to accelerate adoption by strengthening a community of support for sustainability initiative practices.
What Did We Do?
This workshop used multiple formats to engage participants in discussion and ideation, recognizing there is a need not only for purposeful planning, but also for quick action. There were brief introductions to a suite of tools and resources that support on-farm decision-making, and opportunities for crowd-sourcing additional material. Collective discussions charted networks and roles for advisors to support farmers in the implementation process for select scenarios. Activities considered both one-on-one advisor-advisee relationships, as well as the role of advisors within a broader network of actors involved in sustainability initiatives. The workshop culminated in identifying basic, finite steps for the promotion of action.
What Have We Learned?
The workshop content supports advisors for all types of livestock farms, but draws heavily from experiences in the swine and dairy industries. In extension work, we observed that advisors can serve as connectors, motivators, and informers. We noticed that exploring options for mitigation pathways can require a variety of advisor services.
Summary of Workshop Findings
Following the workshop, an accessible guide of resources to support participants and LPELC community members was compiled, available here:
This workshop is supported by Multistate Project S1074 – Fostering Technologies, Metrics, and Behaviors for Sustainable Advances in Animal Agriculture. This workshop benefitted from supporting materials provided by National Pork Board and the National Milk Producers Federation Farmers Assuring Responsible Management Program.
The authors are solely responsible for the content of these proceedings. The technical information does not necessarily reflect the official position of the sponsoring agencies or institutions represented by planning committee members, and inclusion and distribution herein does not constitute an endorsement of views expressed by the same. Printed materials included herein are not refereed publications. Citations should appear as follows. EXAMPLE: Authors. 2025. Title of presentation. Waste to Worth. Boise, ID. April 7-11, 2025. URL of this page. Accessed on: today’s date.
Environmental assessments are core to sustainability initiatives in several livestock sectors. For example, the Farmers Assuring Responsible Management Environmental Stewardship Program and the National Pork Board’s On-Farm Sustainability Reports support dairy and swine farms, respectively, in documenting baselines and improving environmental performance. Although many farms have a long history of environmental stewardship, farms may have limited experience in quantifying and communicating about farm environmental performance. In these cases, an environmental stewardship assessment or other evaluation can be an opportunity to learn about sustainability metrics and discuss their farm impacts. Farms, advisors, processors, and other stakeholders share responsibility in conducting and responding to environmental assessments. Uniquely, advisors and educators can build value in environmental assessment processes by assisting stakeholders in interpreting and communicating results.
What Did We Do?
To improve the translation from assessments to action, we designed a cross-institutional extension program for farmers and advisors in 2023. This W2W workshop shared key findings from this extension program by immersing participants in similar activities. The workshop included two parts. In Part I “Understanding environmental assessment models,” participants discussed fictional assessment results–reviewing inputs, then outputs, then discussing unknowns to the calculation processes. In Part II “Your role in assessment processes,” participants developed an action plan for incorporating environmental assessments into their own advising and professional work through facilitator-guided ideation activities. In summary, our workshop sought to empower participants to: 1) accurately interpret and explain the results of an environmental assessment; 2) develop strategies for incorporating environmental assessment results into their professional activities; 3) build confidence in initiating and leading discussions on environmental sustainability assessments.
What Have We Learned?
In brief, based on the perspectives of farmers and advisors in our Fall 2023 focus groups, an advisor can recognize:
Environmental assessments and reports can be relatively simple;
Assessments will not capture all the specifics for every farm;
Assessments enumerate key environmental indicators (greenhouse gases and energy consumption), and this can help processors and retailers sell more animal products;
More support, beyond an assessment, is needed to inform on-farm decision-making.
These acknowledgments are a starting point to establish a common understanding between advisors and others involved in environmental assessment processes.
Summary of Workshop Findings
This workshop generated ideas that we collected into a summary document to distribute to the broader community of Livestock and Poultry Environmental educators and advisors, available below:
We thank Midwest Dairy for supporting the original work. Additionally, we are grateful to participants in these focus groups and surveys for sharing their experiences. This workshop benefitted from supporting materials provided by National Pork Board and the National Milk Producers Federation Farmers Assuring Responsible Management Program.
The authors are solely responsible for the content of these proceedings. The technical information does not necessarily reflect the official position of the sponsoring agencies or institutions represented by planning committee members, and inclusion and distribution herein does not constitute an endorsement of views expressed by the same. Printed materials included herein are not refereed publications. Citations should appear as follows. EXAMPLE: Authors. 2025. Title of presentation. Waste to Worth. Boise, ID. April 7-11, 2025. URL of this page. Accessed on: today’s date.
Livestock manure nutrients can be variable depending on animal species, age, diet, management, housing, climate, and manure storage and handling. Thousands of samples are analyzed every year by agricultural laboratories across the United States (U.S.). While many published manure characteristics are two decades old, this study provides an updated glimpse into more recent manure data from thousands of samples across the country and reviewed possible trends from 2012-2022 by U.S. regions for common animal categories.
What Did We Do?
We collected manure nutrient data from participating U.S. laboratories and this data was aggregated by researchers at the University of Minnesota into ManureDB, a manure nutrient test database. By February 2024, ManureDB included over 490,000 samples from across the U.S. With ManureDB, data was filtered for the time period from 2012-2022 and common U.S. animal manure categories (solid beef, liquid beef, solid dairy, liquid dairy, solid chicken-broiler, solid chicken-layer, solid turkey, and liquid swine manure) to update nutrient summary statistics for total nitrogen (TN), ammonium-N (NH4-N), phosphorus (P2O5), and potassium (K2O) using the approximately 325,000 samples. Samples were divided by designating samples with <10% total solids as liquid manure and samples with >10% total solids as solid manure. Data was also analyzed to assess regional nutrient comparisons and trends for regions with sufficient samples.
What Have We Learned?
Regional differences impacted nutrient concentrations in solid and liquid manures. When comparing regions with at least 500 samples per animal manure category across 2012-2022 we found significant differences in nutrient concentrations in 66% of the individual year comparisons for solid manures and 91% of comparisons for liquid manures for all four analytes.
Between 2012 and 2022, significant increasing or decreasing nutrient (TN, NH4-N, P2O5, K2O) trends were evident in 25% of solid samples and 18% of liquid samples. The only significant trend for solid beef manure was a decreasing trend in the SE region for NH4-N. Both the solid chicken-broiler SE and NE regions had significant decreases in NH4-N, and only the SE had an increasing trend for K2O. The SE region for solid chicken-layer had decreasing trends for NH4-N, P2O5, and K2O. For solid dairy manure, the MW region only had a decreasing trend for P2O5, while the NE region had decreasing trends for N and NH4-N. Solid turkey manure only had significant trends for P2O5, with the MW increasing and the SE decreasing. Liquid beef manure had no significant trends. For liquid dairy manure, only the NE region had significant decreasing trends for all four nutrients. For liquid swine manure, only the SE region had significant increasing trends for NH4-N.
Standardizing nomenclature and increasing manure sample details, especially with animal life stage and manure storage information on manure sample submittal forms, will further improve ManureDB’s usefulness.
Future Plans
We continue to expand and refine ManureDB by adding data each year, additional labs, making the website more user-friendly, and enhancing data quality control. We archived the first set of data with Ag Data Commons in 2024 and plan to do that annually. We also plan to publish several papers regarding the development of the database and analysis of the manure nutrient data.
Authors
Presenting & corresponding author
Nancy L. Bohl Bormann, Researcher, University of Minnesota, nlbb@umn.edu
Additional authors
Melissa L. Wilson, Associate Professor, University of Minnesota
Erin L. Cortus, Associate Professor and Extension Engineer, University of Minnesota
ManureDB is supported through USDA NIFA Award 2020-67021-32465 and Cooperative Ecosystem Studies Unit program [grant no. NR253A750008C001] from the U.S. Department of Agriculture — Natural Resources Conservation Service.
The authors are solely responsible for the content of these proceedings. The technical information does not necessarily reflect the official position of the sponsoring agencies or institutions represented by planning committee members, and inclusion and distribution herein does not constitute an endorsement of views expressed by the same. Printed materials included herein are not refereed publications. Citations should appear as follows. EXAMPLE: Authors. 2025. Title of presentation. Waste to Worth. Boise, ID. April 7–11, 2025. URL of this page. Accessed on: today’s date.
The on-farm disposal of swine carcasses poses a potential risk to groundwater quality due to the generation of leachate with nitrate compounds (Koh et al., 2019). This study aims to evaluate the vertical movement of nitrate nitrogen from leachate produced during decomposition of swine carcasses in Nebraska soil types by integrating HYDRUS-1D modeling with GIS-based spatial analysis.
What Did We Do?
Leachate from six on-farm mortality disposal units was gathered during a year-long field study. A soil column study was conducted using the leachate from the field study to evaluate contaminant fate and transport through two common Nebraska soil types – a sandy clay loam and a silty clay.
HYDRUS-1D Model Calibration and Simulation. The model was calibrated using laboratory soil column data; no field-scale observations were used for validation. The objective was to parameterize the model based on controlled experimental conditions and use these simulations to inform spatial risk assessments.
Soil Hydraulic and Solute Transport Parameters. The van Genuchten-Mualem model was chosen to define the soil hydraulic properties for the two soil types used in the columns study, sandy clay loam (SCL) and silty clay (SC). Ten simulations were conducted to develop the HYDRUS-1D model, each run for 365 days, using the mean monthly nitrogen (N lb/ac) generated in leachate during the field study, which was converted into NO₃-N units. The model simulated nitrate leaching in a 10-meter soil column profile using boundary conditions that replicated laboratory leachate transport where the upper boundary represents a constant flux boundary to simulate leachate application based on controlled experimental data and lower boundary represents a free drainage condition representing natural percolation.
Model Calibration. Calibration was performed using inverse modeling within HYDRUS-1D, adjusting key parameters to minimize the sum of squared errors (SSQ) between observed and simulated nitrate concentrations in soil columns at 5 cm, 15 cm, and 25 cm. The results may not fully represent field-scale variability since the model was calibrated only using laboratory data. However, the controlled conditions ensured that parameterization was optimized for subsequent spatial risk assessment using GIS. The sandy clay loam soil strongly correlated with observed and simulated values (R²=0.99). The silty clay soil had a slightly lower R² (0.86). Identical RMSEs of 3.15 for both soil types suggest similar levels of overall deviation from observed concentrations.
The model outputs were exported as time-series CSV data and georeferenced to the study area using ArcGIS Pro. Statewide soil texture data were obtained from the USDA-NRCS soil texture class map (Knoben, 2021) and depth were derived from interpolated data using the Kriging method, based on historical water levels from the UNL Groundwater and Geology Portal (CSD, 2025) respectively. Soil type, groundwater depths, and digital elevation models (DEM) were imported into ArcGIS Pro and processed under the NAD 1983 UTM Zone 14N coordinate system to ensure spatial alignment.
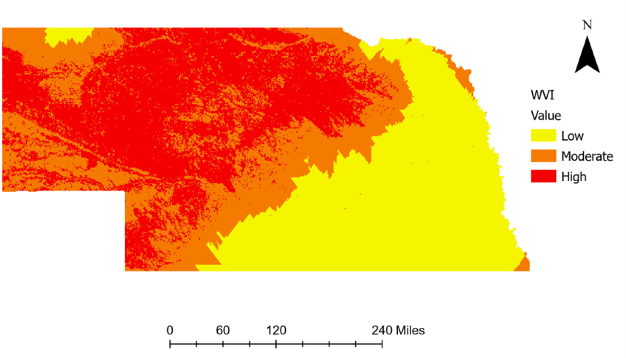
Hydraulic parameters for the ten soil textural classes in Nebraska were defined by the ROSETTA model in HYDRUS-1D and used to model nitrate transport and concentration at 2m soil depth at 1,000 randomly defined locations statewide. Nitrate concentration data at 2 m of soil depth was interpolated using the Kriging tool to create a continuous nitrate concentration data layer. Soil type and groundwater depth data were converted into raster format to enhance the spatial analysis, and a vulnerability assessment was performed using a classification system based on soil permeability, groundwater depth, and nitrate concentrations to produce a spatial representation of groundwater contamination vulnerability (Figure 1).
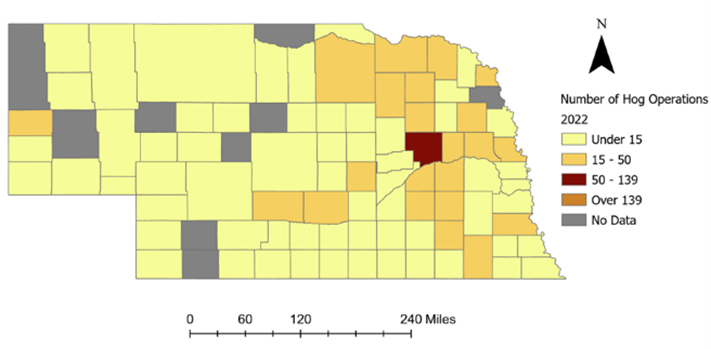
Figure 1. Distribution of groundwater contamination vulnerability modeled with HYDRUS-1DFigure 2. Level swine inventory data for Nebraska (Census of Ag, 2022)
Swine population inventories (Figure 2) were obtained from the 2022 USDA Census of Agriculture (IARN, 2025), allowing for comparison of county-level swine populations to groundwater contamination vulnerability.
What Have We Learned?
The HYDRUS-1D model successfully modeled nitrate movement in the soil profile, producing time-series data that matched expected trends based on soil properties and environmental conditions. Counties with the greatest groundwater contamination risk are predominantly located in the western and northern regions of the state due to well-drained soils and shallow depths of groundwater. Very few swine operations are located in these moderate- to high- risk zones, but those that are located in these zones should be aware of the potential for groundwater contamination and should utilize mortality disposal methods that minimize leachate production. Four counties in northeast Nebraska contain moderate swine populations and have moderate to high risks for groundwater contamination. Castro and Schmidt (2023) found that carcass disposal via shallow burial with carbon (SBC) yielded much less leachate – and, subsequently, much lower loads of contaminants to the soil environment – than composting of whole or ground swine carcasses, suggesting that SBC may be a more environmentally conscious disposal method in these counties. Counties having low vulnerability to groundwater contamination cover much of the state’s central and eastern portions where the majority of swine production is located. This study provides critical insights into the risks of groundwater contamination from on-farm swine carcass disposal in Nebraska. Guidance for on-farm disposal of mortalities by all livestock producers should focus on selecting disposal methods that minimize leachate production and contaminant transport potential.
Future Plans:
Outreach efforts will focus on promoting mortality disposal BMPs with a primary focus on selecting disposal methods that minimize leachate production. Field research will be expanded to include evaluation of multiple carbon sources used for on-farm carcass disposal to reduce leachate generation. Future research will focus on enhancing the predictive accuracy of the HYDRUS-1D model by incorporating field-scale validation using observed nitrate concentrations from groundwater monitoring wells in high-risk areas. This validation will improve the reliability of the model’s output and support more precise risk assessments.
Authors:
Presenting Author
Gustavo Castro Garcia, Graduate Extension & Research Assistant, Department of Biological Systems Engineering, University of Nebraska-Lincoln
Corresponding Author
Amy Millmier Schmidt, Professor, Department of Biological Systems Engineering and Department of Animal Science, University of Nebraska-Lincoln, aschmidt@unl.edu
Additional Authors
Mara Zelt, Research Technologist, University of Nebraska-Lincoln
Aaron Daigh, Associate Professor, Department of Biological Systems Engineering and Department of Agronomy & Horticulture, University of Nebraska-Lincoln
Benny Mote, Associate Professor, Department of Animal Science, University of Nebraska-Lincoln
Carolina Córdova, Assistant Professor, Department of Agronomy & Horticulture, University of Nebraska-Lincoln
Acknowledgments
This project was supported by the National Pork Board Award #22-073. The authors wish to recognize Jillian Bailey, Logan Hafer, Alexis Samson, Nafisa Lubna, Andrew Ortiz, and Maria Oviedo Ventura, for their technical assistance during the field and column studies that provided input data for this modeling effort.
Additional Information
Castro, G., and Schmidt, A. (2023). Evaluation of swine carcass disposal through composting and shallow burial with carbon (poster presentation). ASABE AIM. Omaha, NE. July 9 – 12, 2003.
CSD. (2025). UNL Ground Water and Geology Portal: CSD Ground Water and Geology Data Portal. University of Nebraska-Lincoln. Retrieved from: CSD Ground Water and Geology Data Portal.
IANR. (2025). Hogs and pigs, operations with inventory, total operations by county. Nebraska Map Room. Data source: Census of Agriculture, 2022. Retrieved from: https://cares.page.link/Xu1J.
Koh, EH., Kaown, D., Kim, HJ., Lee, KK., Kim, H., and Park, S. (2019). Nationwide groundwater monitoring around infectious-disease-caused livestock mortality burials in Korea: superimposed influence of animal leachate on pre-existing anthropogenic pollution. Environ Int 129:376–388.
The authors are solely responsible for the content of these proceedings. The technical information does not necessarily reflect the official position of the sponsoring agencies or institutions represented by planning committee members, and inclusion and distribution herein does not constitute an endorsement of views expressed by the same. Printed materials included herein are not refereed publications. Citations should appear as follows. EXAMPLE: Authors. 2025. Title of presentation. Waste to Worth. Boise, ID. April 7-11, 2025. URL of this page. Accessed on: today’s date.
Porcine reproductive and respiratory syndrome virus (PRRSV) is a major concern to the U.S. swine industry due to the severe economic loss it can cause. Its symptoms include severe flu-like symptoms, respiratory distress, fever, and premature abortions in pregnant sows. The virus is spread during close contact between pigs or exposure to contaminated urine, semen, feces, and nasal and mammary secretions (1). Control measures have proven exceedingly costly with PRRSV which causes an estimated $1 billion in lost production in the U.S. pork industry per year (3), an 80% increase from a decade earlier (2)(4). With very few, truly effective methods available to control PRRSV after the start of an outbreak, developing methods to mitigate the dispersion of the virus has become a major priority.
Common biosecurity measures for swine operations (e.g., controlled access, personal hygiene, animal management, pest control, and production area cleaning and disinfection) have proved insufficient to stop PRRSV transmission. Producers are, therefore, seeking to understand the potential risks posed by more novel transport methods. Observations of new PRRSV cases emerging during manure handling activities have raised questions about aerosolized manure as a potential transmission vector. This study was conducted to test this possibility in the following stages:
Verify the presence of viable virus sample within pit manure, lagoon samples, or dust coming from barns with active PRRSv outbreaks.
Develop a reliable method for collecting and preserving viable airborne viral samples.
Assess the aerosol transmission “footprint” of PRRSV originating from positive swine farms to improve understanding of potential farm-to-farm disease transmission risks.
What Did We Do?
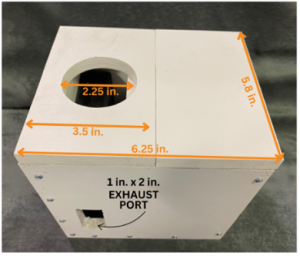
Novel air sampling devices were constructed by the project team (Figure 1) to be deployed inside and outside swine production units to accumulate samples of particulates and aerosols. The devices accommodate a commercially available Air Prep filter cartridge (innovaprep.com) to capture particulates pulled across the filter by a fan housed within the sampling unit.
Figure 1. Air sampler unit constructed for this project (L) and commercial AirPrep Filter (R)
Our project team worked closely with the lead veterinarian at a large swine integrator in Nebraska to access farms within 5 to 7 d of pigs being confirmed PRRSV-positive. Sampling events 1 and 2 focused on evaluating PRRSV presence on indoor surfaces, fresh and stored manure, flies, and maggots. Sampling events 3 through 5 focused on evaluating PRRSV presence in air downwind of PRRSV-positive swine production areas or downwind of land application of manure from PRRSV-positive animals.
Sampling Event 1. A swine breeding operation was identified where animals were currently testing positive for and showing clinical signs of PRRSV infection. At this site, two production areas were selected at random for sampling. Surface swabs were collected from floors, fan louvers, and pen dividers. Fresh fecal samples were collected from sows in the same production areas, and an air sampler was placed on the floor in each room and allowed to operate for two hours before retrieving the filters. For surface samples, sterile swabs were swept over each surface type and then placed into phosphate buffered saline (PBS) elution buffer. Fresh fecal samples were collected using a sterile spatula and placed into clean sample containers. Upon retrieving filters from air samplers, a sterilized knife was used to separate the filter from the plastic casing in which it was mounted, and sterile forceps were used to transfer the filter into a PBS elution tube. All samples were transported on ice to the University of Nebraska-Lincoln (UNL) Schmidt Lab and then submitted to the Iowa State University Veterinary Diagnostic Laboratory for analysis by polymerase chain reaction (PCR).
Sampling Event 2. A swine finisher unit was identified where animals were currently testing positive for and showing clinical signs of PRRSV infection. At this site, two production areas were selected at random for sampling inside the building. Surface swabs were collected from floors, fan louvers, feeders, and pen dividers. An air sampler was placed on the floor in each room and allowed to operate for four hours before retrieving the filters. Additional air samplers were mounted outside the building. For one production area, three samplers were mounted at a height aligning with the center of a minimum ventilation fan and spaced at 5, 12, and 19 feet from the rim of the fan hood. For a second production area, two samplers were mounted at a height aligning with the center of a minimum ventilation fan and spaced at 5 and 13 feet from the rim of the fan hood. These samplers were allowed to run for three hours before filters were retrieved. For surface samples, sterile swabs were swept over each surface type and then placed into PBS elution buffer. Manure samples from two deep pit storage sections of the building were collected using a plastic pole and dipper cup and placed into clean plastic bottles. Maggots observed in one pump out port were collected by hand and placed into PBS elution buffer. Upon retrieving filters from air samplers, a sterilized knife was used to separate the filter from the plastic casing in which it was mounted, and sterile forceps were used to transfer the filter into a PBS elution tube. Flies present around the production buildings were also collected at this site. For one sample, approximately six flies were captured and placed directly into PBS elution buffer. For a second sample, approximately six flies were captured, placed into 70% EtOH for 10 s, and then transferred from the ethanol to PBS elution buffer. All samples were transported on ice to the UNL Schmidt Lab and then submitted to the Iowa State University Veterinary Diagnostic Laboratory for analysis by PCR.
Sampling Event 3. A naturally-ventilated PRRSV-positive swine farm was identified. Air samplers mounted on t-posts were deployed in an array at a height above the ground of roughly 6 ft at varying distances (10 yards to 1 mile) from the buildings after using smoke candles to confirm wind direction and dispersion. Sampling was conducted for approximately 2.5 hours on a day with 40-55°F temperature,10-20 mph winds, and full cloud cover (Figure 2).
Sampling Event 4. At a mechanically-ventilated PRRSV-positive swine farm, sampling was conducted using the same process as for Event 3 for approximately 21.25 hours starting on a day with 85-105°F temperature, 4-10 mph winds, and full sun exposure, then continuing overnight.
Sampling Event 5. Using the previously described process, sampling was conducted for approximately 2.5 hours on a day with 70-95°F temperature, 2-10 mph winds, and partly cloudy conditions downwind of a field where lagoon effluent from PRRSV-positive pigs was being applied via center pivot.
Figure 2. Air sampler array at the naturally ventilated swine farm
All samples were submitted to the Iowa State Veterinary Diagnostic Lab for RT-qPCR analysis to identify PRRS viral genomic material.
What Have We Learned?
Results of PCR analyses for sampling event 1 (Table 1) revealed that, in barns where swine oral fluid samples were positive for PRRSv, all surface samples collected were also positive or suspected positive for PRRSv. The same was true for all of the surface and air samples collected inside the barn and for the air samples located up to 19 ft minimum from the building ventilation fans during sampling event 2 (Table 2). Maggots taken from the manure pit during sampling event 2, along with sterilized and unsterilized flies, tested positive for PRRSV, as well. Conversely, all manure samples obtained during sampling event 2 tested negative using the methodologies employed. This outcome does not dismiss manure as a possible transmission source; rather, it underscores the need for ongoing research to develop a reliable detection method for PRRS within such a complex matrix.
The team has not yet recovered air samples testing positive for PRRSV from any of the exterior arrays in sampling events 3-5 (Table 3). This could be due to ambient air conditions during the tests which may have caused rapid destruction of the virus or dilution of the virus below detectable concentrations. The rolling terrain surrounding facilities where arrays of samplers were posted downwind of buildings or the land application site may have created turbulent air movement that diluted samples such that concentrations of PRRSV genomic material capture on filters were too low to produce a positive result by PCR.
Table 1. Cycle Threshold (Ct) values for sampling event 1
Sample Description
Ct (Result)
Pen Floor, Room 17
37.5 (Suspect)
Fan Louver, Room 17
30.1 (Positive)
Feeder, Room 17
31.6 (Positive)
Air Filter, Room 17
31.2 (Positive)
Pen Floor, Room 18
31.5 (Positive)
Fan Louver, Room 18
31.4 (Positive)
Feeder, Room 18
37.6 (Suspect)
Air Filter, Room 18
30.5 (Positive)
Fecal Sample 1
³40 (Negative)
Fecal Sample 2
³40 (Negative)
Cycle threshold (Ct) indicates the number of PCR cycles required for the sample fluorescence to reach a predefined threshold for identification (<38 = positive, ~38-40 = suspect, ≥40 = negative). Lower Ct values correspond to higher viral RNA concentration.
Table 2. Cycle Threshold (Ct) values for sampling event 2
Sample Description
Ct (Result)
Exhaust Air, Room 5, 5 ft from fan
33.1 (Positive)
Exhaust Air, Room 5, 12 ft. from fan
34.1 (Positive)
Exhaust Air, Room 5, 19 ft. from fan
38.1 (Suspect)
Indoor Air, Room 5, Rep 1
30.9 (Positive)
Indoor Air Room 5, Rep 2
33.3 (Positive)
Exhaust Air, Room 6, 5 ft from fan
32.6 (Positive)
Exhaust Air, Room 6, 13 ft. from fan
32.4 (Positive)
Flies
37.0 (Suspect)
Flies Sterilized in Ethanol
36.3 (Positive)
Maggots
39.9 (Suspect)
Floor, Room 5, Rep 1
32.4 (Positive)
Floor, Room 5, Rep 2
32.3 (Positive)
Louvers, Room 5, Rep 1
33.1 (Positive)
Louvers, Room 5, Rep 2
32.1 (Positive)
Pens, Room 5, Rep 1
37.9 (Positive)
Pens, Room 5, Rep 2
35.8 (Positive)
Feeder, Room 5, Rep 1
35.8 (Positive)
Feeder, Room 5, Rep 2
37.5 (Suspect)
Pens, Room 4, Rep 1
35.6 (Positive)
Pens, Room 4, Rep 2
35.3 (Positive)
Floor, Room 4, Rep 1
31.4 (Positive)
Floor, Room 4, Rep 2
32.9 (Positive)
Louvers, Room 4, Rep 1
33.0 (Positive)
Louvers, Room 4, Rep 2
32.1 (Positive)
Cycle threshold (Ct) indicates the number of PCR cycles required for the sample fluorescence to reach a predefined threshold for identification (<38 = positive, ~38-40 = suspect, ≥40 = negative). Lower Ct values correspond to higher viral RNA concentration.
Table 3. Cycle Threshold (Ct) values for sampling events 3 through 5
Sampling Event
Sample Description
Ct (Result)
Event 3
Air Filters (n=2)
³40 (Negative)
Event 4
Air Filters (n=4)
³40 (Negative)
Fans (n=4)
³40 (Negative)
Oral Fluids, Room 15
34.0 (Positive)
Oral Fluids, Room 16
36.1 (Positive)
Oral Fluids, Room 17
38.0 (Suspect)
Oral Fluids, Room 18
34.7 (Positive
Event 5
Air Filters (n=4)
³40 (Negative)
Cycle threshold (Ct) indicates the number of PCR cycles required for the sample fluorescence to reach a predefined threshold for identification (<38 = positive, ~38-40 = suspect, ≥40 = negative). Lower Ct values correspond to higher viral RNA concentration.
Future Plans
It is essential to identify which ambient weather conditions, if any, are favorable for air dispersion of infective PRRSv and which conditions will significantly limit dispersion. As research continues, the suspected ideal conditions for sampling downwind of mechanically ventilated PRRSv-positive barns or irrigation systems applying lagoon effluent from PRRSv-positive pigs will be 0 to 50°F with low to moderate wind speed and full cloud cover. At least 24 hours of continuous sampling is also expected to produce greater opportunity for positive air samples.
The continued inability to isolate the virus from manure samples is curious, given the universally positive samples we identified from the positive barns. However, the PRRSV is believed to require as few as 10 viral particles to be transmitted. Given the potentially very low concentration of viral material in manure, and the significant PCR inhibitors present in complex organic samples, the team continues to explore new sample preparation and testing methods for this matrix.
Lastly, further investigation into the potential roles of flies and maggots is warranted, particularly with the discovery of sufficient PRRSV genomic material in the gut of surface sterilized flies to yield a positive PRRSV result via RT-qPCR.
Authors
Presenting author
Logan Hafer, Undergraduate Research Assistant, Department of Biological Systems Engineering, University of Nebraska-Lincoln
Corresponding author
Dr. Amy Millmier Schmidt, Professor, Department of Biological Systems Engineering and Department of Animal Science, University of Nebraska-Lincoln, aschmidt@unl.edu
Additional author(s)
Dr. Benny Mote, Associate Professor, Department of Animal Science, University of Nebraska-Lincoln
Dr. Hiep Vu, Associate Professor, Department of Animal Science, University of Nebraska-Lincoln
Butler, J. E., Lager, K. M., Golde, W., Faaberg, K. S., Sinkora, M., Loving, C., & Zhang, Y. I. 2014. Porcine reproductive and respiratory syndrome (PRRS): an immune dysregulatory pandemic. Immunologic research, 59, 81-108. https://link.springer.com/article/10.1007/s12026-014-8549-5.
Dee, S., T. Clement, and E. Nelson. 2023. Transmission of porcine reproductive and respiratory syndrome virus in domestic pigs via oral ingestion of feed material. J of the Am Vet Med Assoc, 262(1). https://doi.org/10.2460/javma.23.08.0447
Osemeke, O.H., T. Donovan, K. Dion, D.J. Holtkamp and D.C.L. Linhares. 2021. Characterization of changes in productivity parameters as breeding herds transitioned through the 2021 PRRSV Breeding Herd Classification System. J Swine Health Prod. 2022;30(3):145-148. https://doi.org/10.54846/jshap/1269
Acknowledgements
Funding for this research was provided by the Nebraska Pork Producers Association under award #22-063 and an Undergraduate Student Research Program award from the UNL Institute of Agriculture and Natural Resources, Agricultural Research Division.
The authors are solely responsible for the content of these proceedings. The technical information does not necessarily reflect the official position of the sponsoring agencies or institutions represented by planning committee members, and inclusion and distribution herein does not constitute an endorsement of views expressed by the same. Printed materials included herein are not refereed publications. Citations should appear as follows. EXAMPLE: Authors. 2025. Title of presentation. Waste to Worth. Boise, ID. April 7–11, 2025. URL of this page. Accessed on: today’s date.
Scheduling conflicts, equipment breakdowns, and wet field conditions can wreak havoc on spring manure application and planting schedules. This webinar will provide valuable insights into maximizing the efficiency and timing of manure application for growing crops, especially corn. By exploring innovative techniques for liquid manure application and the potential for in-season poultry litter application, participants will learn possible ways to navigate challenges in crop management while ensuring nutrient efficiency and maintaining crop yield and quality. This presentation was originally broadcast on January 17, 2025. Continue reading “Application of Manure on Growing Crops”
Agriculture is the largest source of ammonia emissions and contributes to nitrogen deposition which can impact ecosystem health. This webinar introduces the topic of nitrogen deposition and provides an overview of the role of the National Atmospheric Deposition Program (NADP) in determining nitrogen deposition sources. In addition, the speakers provide an overview of a region being impacted by agriculture related nitrogen deposition and discusses agricultural management practices that may reduce ammonia emissions and nitrogen deposition. This presentation was originally broadcast on September 20, 2024.Continue reading “The Role of Agriculture in Atmospheric Nitrogen Deposition: Sources, Impacts, and Management”
Have you heard or read about circularity and the circular economy? These buzzwords describe sustainability concepts that are being adopted in many sectors, including food animal production. This webinar shares definitions for these concepts and how they can inform thinking about changes to animal systems and manure management. This presentation was originally broadcast on June 21, 2024.Continue reading “Staying in the Loop: Circularity in Integrated Crop and Livestock Production”
Most manure book values used today from the MidWest Plan Service (MWPS) and American Society of Agricultural and Biological Engineers (ASABE) were derived from manure samples prior to 2003. To update these manure test values, the University of Minnesota in partnership with the Minnesota Supercomputing Institute, is working to build a dynamic manure test database called ManureDB. During this database construction, the University of Minnesota collected manure data spanning the last decade from five labs across the country. Trends, similarities, and challenges arose when comparing these samples. Having current manure test numbers will assist in more accurate nutrient management planning, manure storage design, manure land application, and serve agricultural modeling purposes.
What Did We Do?
We recruited five laboratories for this preliminary study who shared some of their manure sample data between 2012-2021, which represented over 100,000 manure samples. We looked at what species, manure types (liquid/solid), labels, and units we had to work with between the datasets to make them comparable. Once all the samples were converted into either pounds of nutrient/ton for solid manure or pounds of nutrient/1000 gallons for liquid manure, we took the medians of total nitrogen, ammonium-nitrogen (NH4-N), phosphate (P2O5), and potassium oxide (K2O) analyses from those samples and compared them to the MWPS and ASABE manure nutrient values.
What Have We Learned?
There is no standardization of laboratory submission forms for manure samples. The majority of samples have minimal descriptions beyond species of animal and little is known about storage types. With that said, we can still detect some general NPK trends for the beef, dairy, swine, poultry manure collected from the five laboratories in the last decade, compared to the published book values. For liquid manure, the K2O levels generally increased in both the swine and poultry liquid manure samples. For the solid swine manure and solid beef manure, total N, P2O5, and K2O levels all increased compared to the published book values. The solid dairy manure increased in P2O5 and K2O levels, and the solid poultry manure increased in total N and K2O. See Figure 1 for the general trends in liquid and solid manure for swine, dairy, beef, and poultry.
Table 1. Manure sample trends 2012-2021 compared to MWPS/ASABE manure book values. (+) = trending higher, (o) = no change/conflicting samples, (-) = trending lower
Liquid
Total N
NH4–N
P2O5
K2O
Swine
o
o
–
+
Dairy
–
o
–
o
Beef
o
o
o
o
Poultry
o
+
–
+
Solid
Total N
NH4–N
P2O5
K2O
Swine
+
o
+
+
Dairy
o
o
+
+
Beef
+
–
+
+
Poultry
+
o
o
+
Future Plans
The initial data gives us a framework to standardize fields for the future incoming samples (location, manure type, agitation, species, bedding, storage type, and analytical method) along with creating a unit conversion mechanism for data uploads. We plan to recruit more laboratories to participate in the ManureDB project and acquire more sample datasets. We will compare and analyze this data as it becomes available, especially more detailed data for each species. We will be designing ManureDB with statistical and data visualization features for future public use.
Authors
Nancy L. Bohl Bormann, Graduate Research Assistant, University of Minnesota
This work is supported by the AFRI Foundational and Applied Science Program [grant no. 2020-67021-32465] from the USDA National Institute of Food and Agriculture, the University of Minnesota College of Food, Agricultural and Natural Resource Sciences, and the Minnesota Supercomputing Institute.
The authors are solely responsible for the content of these proceedings. The technical information does not necessarily reflect the official position of the sponsoring agencies or institutions represented by planning committee members, and inclusion and distribution herein does not constitute an endorsement of views expressed by the same. Printed materials included herein are not refereed publications. Citations should appear as follows. EXAMPLE: Authors. 2022. Title of presentation. Waste to Worth. Oregon, OH. April 18-22, 2022. URL of this page. Accessed on: today’s date.
Manage Cookie Consent
To provide the best experiences, we use technologies like cookies to store and/or access device information. Consenting to these technologies will allow us to process data such as browsing behavior or unique IDs on this site. Not consenting or withdrawing consent, may adversely affect certain features and functions.
Functional
Always active
The technical storage or access is strictly necessary for the legitimate purpose of enabling the use of a specific service explicitly requested by the subscriber or user, or for the sole purpose of carrying out the transmission of a communication over an electronic communications network.
Preferences
The technical storage or access is necessary for the legitimate purpose of storing preferences that are not requested by the subscriber or user.
Statistics
The technical storage or access that is used exclusively for statistical purposes.The technical storage or access that is used exclusively for anonymous statistical purposes. Without a subpoena, voluntary compliance on the part of your Internet Service Provider, or additional records from a third party, information stored or retrieved for this purpose alone cannot usually be used to identify you.
Marketing
The technical storage or access is required to create user profiles to send advertising, or to track the user on a website or across several websites for similar marketing purposes.