Influence of Swine Manure Application Method on Concentrations of Methanogens and Denitrifiers in Agricultural Soils

Waste to Worth: Spreading science and solutions logoWaste to Worth home | More proceedings….
Abstract

Soil microbial communities have been proposed as indicators of soil quality due to their importance as drivers of global biogeochemical cycles and their sensitivity to management and climatic conditions. Despite the importance of the soil microbiota to nutrient transformation and chemical cycling, physio-chemical properties rather than biological properties of soils are traditionally used as measures of environmental status. In general, much is unknown regarding the effect of management fluctuations on important functional groups in soils systems (i.e., methanogens, nitrifiers and denitrifiers). It is only recently that it has been possible, through application of sophisticated molecular microbiological methods, to sensitively and specifically target important microbial populations that contribute to nutrient cycling and plant health present at the field-scale and in differentially managed soil systems.

Fig. 1. Swine slurry surface application.

In this study, quantitative, real-time PCR (qPCR) was used to quantify changes in denitrifiers (narG) and methanogens (mcrA) in agricultural soils with three different swine effluent application methods including surface application, direct injection, and application in combination with soil aeration. Results show that concentrations of bacteria were high in all treatments (2.9 ± 1.4 X 10⁹ cells per gram of soil); about 25% higher than in controls with no slurry added. Concentrations of methanogens and denitrifiers were slightly higher (around 50%) when slurry was applied by injection or aeration (5.3 ± 2.4 X 10⁷ cells and 2.8 ± 1.8 X 10⁷ cells per gram of soil, respectively) as compared to no till  (2.4 ± 1.6 X 10⁷ cells and 1.6 ± 1.0 X 10⁷ cells per gram of soil, respectively).

These results suggest that application method has little influence on concentrations of functional groups of microorganisms. These results will be discussed in light of results of GHG sampling conducted during the same study.

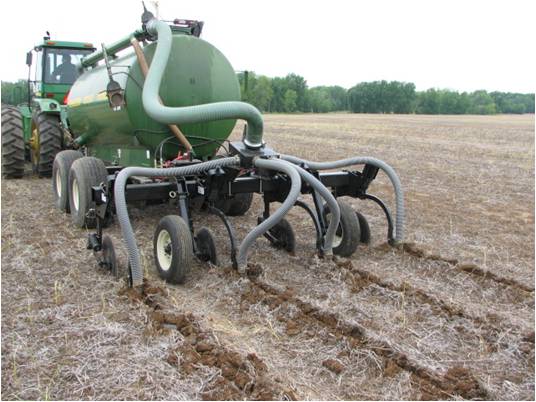
Fig. 2. Swine slurry application by direct injection.

Why Study Greenhouse Gases and the Manure-Soil Interaction?

Although agricultural production has been identified as a significant source of green house gas (GHG) emissions, relatively little scientific research has been conducted to determine how manure management strategies effect GHG production upon land application. Even fewer studies have taken into consideration the microorganisms associated with applied manures. Microbial communities are responsible for nutrient transformation and chemical cycling in soil systems and many important functional groups (i.e., methanogens, nitrifiers and denitrifiers) are extremely sensitive to environmental management and climate conditions. The goal of this study was to evaluate how swine slurry land application methods effect microbial communities associated with nitrogen cycling and GHG production.

Fig. 3. Swine slurry application in combination with soil aeration.

What Did We Do?

We used molecular microbial methods to quantify changes in nitrifiers (amoA), denitrifiers (nirK, nosZ and narG) and methanogens (mcrA) in agricultural soils receiving swine slurry applied by (A) surface application (Fig. 1) (B) direct injection (Fig. 2) or (C) application in combination with soil aeration (Fig. 3). Soil samples were taken from triplicate plots 13 days after effluent application.

Above – Fig. 4. Concentration of methanogens (mcrA) and nitrate reducing bacteria (narG) as measured by quantitative, real-time PCR analysis of targeted genes (in parentheses). Swine slurry was applied by three methods surface, direct injection (Inj) or in combination with aeration (Aer). Chemical fertilizer (Fert) and plots with no fertilizer (Control) were also included. Initial slurry was removed before application. Cells in soils from plots with surface applied slurry were sampled at two depths (1.3 cm and 5.1 cm). Error bars represent the standard deviation of triplicate plot samples.
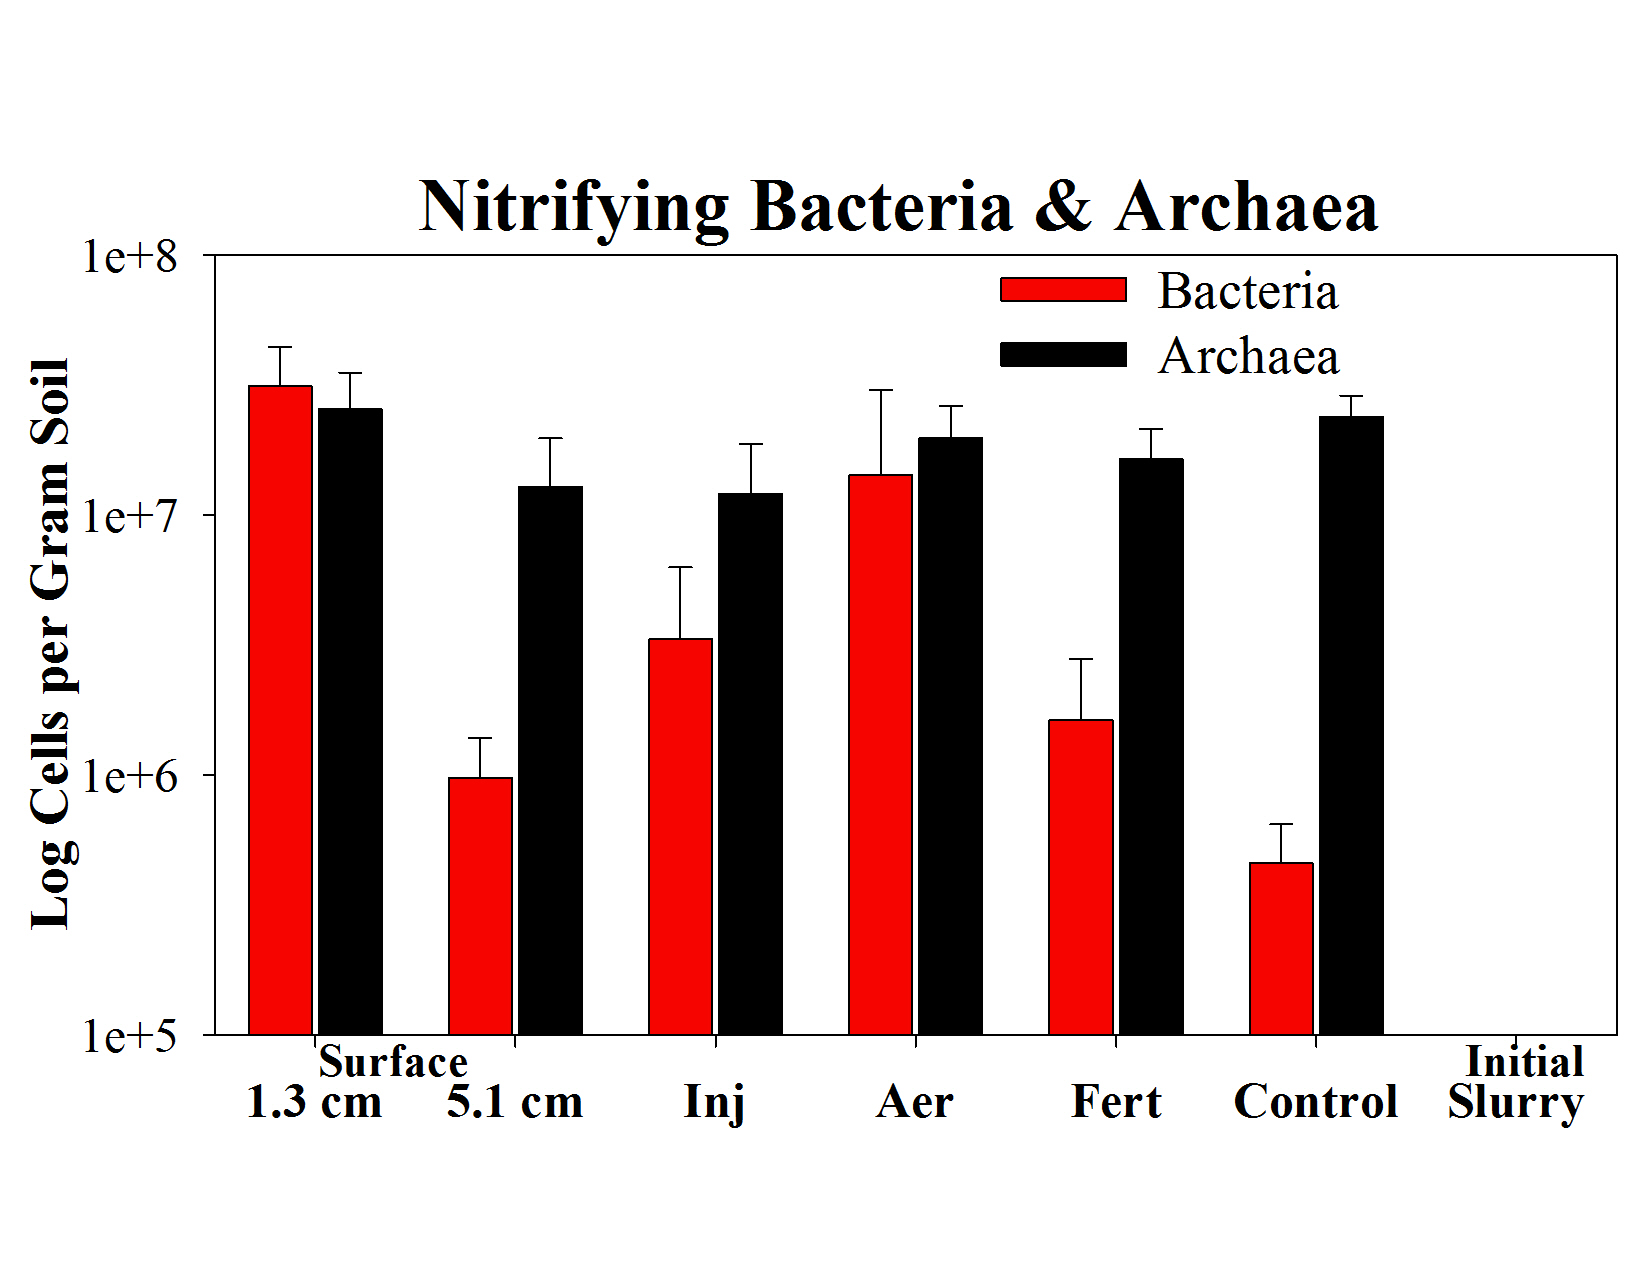
Below – Fig. 5. Concentration of nitrifying bacteria or archaea as measured by quantitative, real-time PCR analysis of the amoA specific for each group. Swine slurry was applied by three methods surface, direct injection (Inj) or in combination with aeration (Aer). Chemical fertilizer (Fert) and plots with no fertilizer (Control) were also included. Initial slurry was removed before application. Cells in soils from plots with surface applied slurry were sampled at two depths (1.3 cm and 5.1 cm). Error bars represent the standard deviation of triplicate plot samples.

What Have We Learned?

  1. Sampling cell concentrations at different soil depths (1.3 cm or 5 cm) from plots with surface applied slurry significantly influenced results (Fig. 4, Fig. 5 and Fig 6).
  2. Slurry applied by any method significantly increased (7 logs) concentrations of nitrate reducing bacteria and methanogens (Fig 4). Methanogens were present in the slurry while nitrate reducers were not measurable in slurry or control plots.
  3. Nitrifying bacteria significantly increased in concentration after slurry addition (i.e. 7, 31, 2 and 68 times higher than control plots for slurry applied by injection, aeration or surface application (1.3 cm and 5 cm), respectively); concentrations of nitrifying archaea did not change from initial levels after slurry addition (Fig. 5).
  4. Concentrations of bacteria, fungi and denitrifiers on plots with slurry applied were two to nine times higher than concentrations in controls with no slurry (Fig. 6).

Future Plans

Findings from this study underscore the importance of measuring both microbial populations and gas production when evaluating the impact of manure application on emissions. Emission data provided important information about the kind and rate of GHG emissions (see reference below for details; Sistani et al (2011) Soil Sci. America J. 74(2): 429-435). However, microbial analyses showed that select groups of nitrifiers and denitrifiers (but not all groups) were affected by manure application. Findings from microbial analyses will be the basis for development of future studies to target and manipulate specific microbial populations in ways that inhibit their ability to produce GHG.

Fig. 6. Change in concentration of targeted population in each treatment relative to that in the control with no slurry or fertilizer added. Concentrations of bacteria (16S RNA gene), fungi (18S RNA gene), nitrite reducing bacteria (nirK) or nitrous oxide reducing bacteria (nosZ) were measured by quantitative, real-time PCR analysis of targeted genes (in parentheses). Swine slurry was applied by three methods surface, direct injection (Inj) or in combination with aeration (Aer). Chemical fertilizer (Fert) and plots with no fertilizer (Control) were also included. Initial slurry was removed before application. Cells in soils from plots with surface applied slurry were sampled at two depths (1.3 cm and 5.1 cm). Error bars represent the standard deviation of triplicate plot samples.

Authors

Dr. Kimberly Cook, Research Microbiologist, USDA Agricultural Research Service, kim.cook@ars.usda.gov

Dr. Karamat Sistani, Research Soil Scientist, USDA Agricultural Research Service

Additional Information

USDA-ARS Bowling Green, KY Location Webpage: http://www.ars.usda.gov/main/site_main.htm?modecode=64-45-00-00


Relevant Publications:

Sistani, K.R., Warren, J.G., Lovanh, N.C., Higgins, S., Shearer, S. 2010. Green House Gas Emissions from Swine Effluent Applied to Soil by Different Methods. Soil Sci. America J. 74(2): 429-435.

Acknowledgements

We would like to thank Jason Simmons and Rohan Parekh for valuable technical assistance. This research is part of USDA-ARS National Program 214: Agricultural and Industrial By-products

The authors are solely responsible for the content of these proceedings. The technical information does not necessarily reflect the official position of the sponsoring agencies or institutions represented by planning committee members, and inclusion and distribution herein does not constitute an endorsement of views expressed by the same. Printed materials included herein are not refereed publications. Citations should appear as follows. EXAMPLE: Authors. 2013. Title of presentation. Waste to Worth: Spreading Science and Solutions. Denver, CO. April 1-5, 2013. URL of this page. Accessed on: today’s date.

Benefits of Using Liquid-Solid Separation with Manure Treatment Lagoons

Waste to Worth: Spreading science and solutions logoWaste to Worth home | More proceedings….

Why Study Manure Treatment Lagoons?

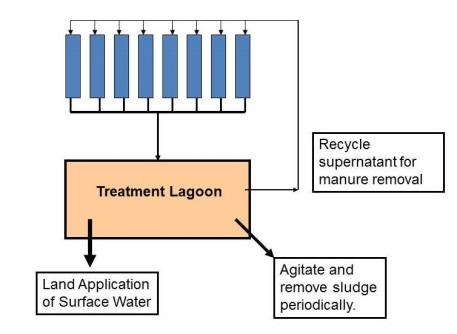
Treatment lagoons are one of the most common biological treatment methods used on swine and dairy farms that use recycled supernatant as a means to remove manure from animal housing facilities by flushing. A properly functioning treatment lagoon will provide adequate treatment to allow reuse of the effluent without compromising animal health or generating strong odor.

chart

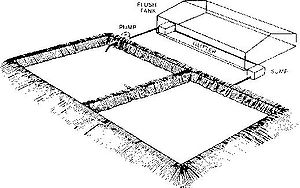
A typical treatment lagoon system used on swine and dairy farms.

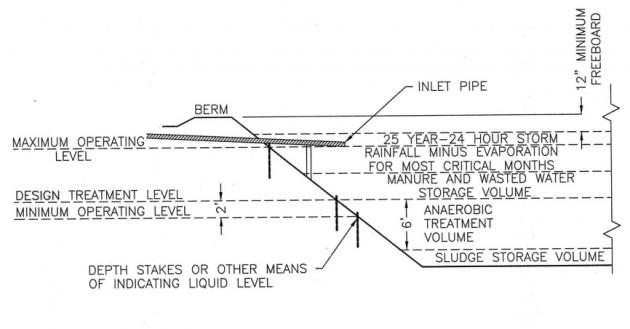
A lagoon should have a minimum biological treatment volume and provide sufficient volume for settling and storage of  sludge to provide the needed levels of treatment prior to recycling. This presentation will provide a summary of the benefits of using liquid-solid separation to maintain and potentially reduce the required treatment volume, reduce sludge build-up, increase useful life of an existing lagoon, and to reduce the size of new lagoons based on the ASABE Standard. Information will also be provided concerning desired loading rates and supernatant concentrations for recycling, and impacts of odor production potential.

chart

Components of a treatment lagoon for animal manure.

What Did We Do?

The ASABE Lagoon Standard (ANSI/ASAE EP403.4, ASABE 2011) was used to calculate lagoon treatment volumes for swine and dairy manure using volatile solid loading rates for a variety of climates ranging from a cold climate, such as Southern Minnesota (3 lb VS/1000 ft3-day), to a hot climate, such as Central Florida (6.0 lb VS/1000 ft3-day). Liquid-solid separation methods can provide a reduction in the mass of VS in the liquid fraction by 10% to 80%. The corresponding reduction in treatment volume were also determined for swine and dairy manure over a wide range of climates.

The ASABE Standard also provides a method to estimate sludge storage volume requirments per year for swine and dairy lagoons that is based on the total solids loaded into a lagoon. The impact of implementing solid-liquid separation on the sludge accumulation rate was also destermined for TS removals in the range of 20% to 80%.

What Have We Learned?

The percent reduction in treatment volume of a lagoon was the same as the mass fraction of VS removed by liquid-solid separation. That is, a 30% reduction in VS provided a 30% reduction in treatment volume. The practical result is that implementation of liquid-solid separation system that can remove 30% of the VS would allow pork producers in the Midwest to use similar treatment volumes as pork producers located in South Carolina or Central Georgia.

Liquid-solid separation also reduced sludge build up in lagoons by the same percentage as the TS removal efficiency. Therefore, a 30% reduction in TS will reduce sludge accumulation by30%.

Reduction in TS and VS loading can help to reduce odors from lagoons, reduce the size of the lagoon needed to provide treatment, and can yield better treated surface water for flushing manure from the buildings.

Removal of large portions of the VS (60% to 80% reduction) using high-rate liquid-solid separation methods has the added benefit of greatly reducing the amount of the organic-N loaded. As a result, less organic-N will be converted to ammonium-N in a lagoon where a portion will be lost to the air as ammonia.

Future Plans

This information will be published as part of a new USDA-NRCS technical note or as part of the National Engineering Handbook, Part 651 Agricultural Waste Management Field Handbook.

Authors

Dr. John P. Chastain, Professor and Extension Agricultural Engineer,  School of Agricultural, Forestry, and Environmental Sciences, Clemson University jchstn@clemson.edu

Jeffrey P. Porter, P.E. Environmental Engineer   Manure Management Team USDA-Natural Resources Conservation Service

Additional Information

Solid-Liquid Separation Alterntives for Manure Handling Treatment, a new USDA-NRCS technical note or as part of the National Engineering Handbook, Part 651 Agricultural Waste Management Field Handbook.

Acknowledgements

Piedmont-South Atlantic Coast Cooperative Ecosystems Studies Unit (CESU).  This Cooperative and Joint Venture Agreement allowed for this work to take place.

Manure Management Team USDA-Natural Resources Conservation Service, Greensboro, NC

Additional support was provided by the Confined Animal Manure Managers Program, Clemson Extension, Clemson University, Clemson, SC.

The authors are solely responsible for the content of these proceedings. The technical information does not necessarily reflect the official position of the sponsoring agencies or institutions represented by planning committee members, and inclusion and distribution herein does not constitute an endorsement of views expressed by the same. Printed materials included herein are not refereed publications. Citations should appear as follows. EXAMPLE: Authors. 2013. Title of presentation. Waste to Worth: Spreading Science and Solutions. Denver, CO. April 1-5, 2013. URL of this page. Accessed on: today’s date.

Greenhouse Gas Emissions from Livestock & Poultry

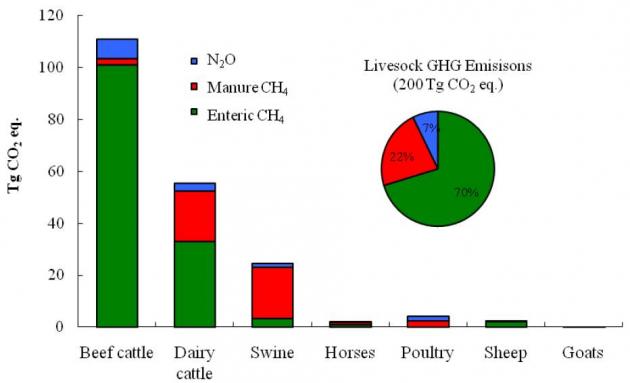
Agriculture is both a source and sink for greenhouse gases (GHG). A source is a net contribution to the atmosphere, while a sink is a net withdrawal of greenhouse gases.  In the United States, agriculture is a relatively small contributor, with approximately 8% of the total greenhouse gas emissions, as seen below.  Most agricultural emissions originate from soil management, enteric fermentation (the ruminant digestion process that produces methane), energy use, and manure management.  The primary greenhouse gases related to agriculture are carbon dioxide, methane, and nitrous oxide. Within animal production, the largest emissions are from beef followed by dairy, and largely dominated by the methane produced in during cattle digestion.

U.S. GHG Inventory

U.S. greenhouse gas inventory with electricity distributed to economic sectors (EPA, 2013) 

Ag Sources of GHGs

U.S. agricultural greenhouse gas sources (Adapted from Archibeque, S. et al., 2012)

Greenhouse gas emissions from livestock in 2008 (USDA, 2011)

Soil Management

Excess nitrogen in agriculture systems can be converted to nitrous oxide through the nitrification-denitrification process. Nitrous oxide is a very potent greenhouse gas, with 310 times greater global warming potential than carbon dioxide.  Nitrous oxide can be produced in soils following fertilizer application (both synthetic and organic).

As crops grow, photosynthesis removes carbon dioxide from the atmosphere and stores it in the plants and soil life. Soil and plant respiration adds carbon dioxide back to the atmosphere when microbes or plants breakdown molecules to produce energy.  Respiration is an essential part of growth and maintenance for most life on earth. This repeats with each growth, harvest, and decay cycle, therefore, feedstuffs and foods are generally considered to be carbon “neutral.”

Some carbon dioxide is stored in soils for long periods of time.  The processes that result in carbon accumulation are called carbon sinks or carbon sequestration.  Crop production and grazing management practices influence the soil’s ability to be a net source or sink for greenhouse gases.  Managing soils in ways that increase organic matter levels can increase the accumulation (sink) of soil carbon for many years.

Animals

The next largest portion of livestock greenhouse gas emissions is from methane produced during enteric fermentation in ruminants – a natural part of ruminant digestion where microbes in the first of four stomachs, the rumen, break down feed and produce methane as a by-product. The methane is released  primarily through belching.

As with plants, animals respire carbon dioxide, but also store some in their bodies, so they too are considered a neutral source of atmospheric carbon dioxide.

Manure Management

A similar microbial process to enteric fermentation leads to methane production from stored manure.  Anytime the manure sits for more than a couple days in an anaerobic (without oxygen) environment, methane will likely be produced.  Methane can be generated in the animal housing, manure storage, and during manure application. Additionally, small amounts of methane is produced from manure deposited on grazing lands.

Nitrous oxide is also produced from manure storage surfaces, during land application, and from manure in bedded packs & lots.

Other sources

There are many smaller sources of greenhouse gases on farms. Combustion engines exaust carbon dioxide from fossil fuel (previously stored carbon) powered vehicles and equipment.  Manufacturing of farm inputs, including fuel, electricity, machinery, fertilizer, pesticides, seeds, plastics, and building materials, also results in emissions.

To learn more about how farm emissions are determined and see species specific examples, see the Carbon Footprint resources.

To learn about how to reduce on-farm emissions through mitigation technology and management options, see the Reducing Emissions resources.

 Additional Resources

Additional Animal Agriculture and Climate Change Resources


Author: Crystal A. Powers, UNL
Reviewers:

How do you calibrate a manure spreader?

Calibrating a manure spreader is critical to ensure that the appropriate rate of manure nutrients is being applied to a field. For some livestock operations, this practice may be a required practice as part of their permit. Calibration will differ depending on the equipment and type of manure being applied.

If you know the capacity of the spreader, you need to determine the width of each pass and the distance it takes to empty the spreader to determine the rate of application. A measuring wheel is a useful tool and can often be borrowed from a local Cooperative Extension or Natural Resources Conservation Service (NRCS) office. After you have determined both of those measurements, use the charts in the publication linked below to determine application rate.

If the capacity of the manure spreader is unknown and solid manure is being spread, you can use a process that involves setting out plastic sheets or tarps of known size and driving the manure spreader over them and weighing the amount of manure that is collected on the sheets. A 22-square-foot tarp is a convenient size because the net weight of the manure on the sheet will be equal to the application rate in tons per acre. A step-by-step guide on making these calculations for other size tarps is available in the publication linked below.

For more, including specifics on calibrating solid, liquid, and irrigation manure equipment, visit Calibrating Manure Application Equipment.

Author: Jill Heemstra, University of Nebraska Extension Educator

What’s the P Index?

The P Index is the Phosphorus Index, a risk assessment tool to quantify the potential for phosphorus runoff from a field. The P Index helps to target critical source areas of potential P loss for greater management attention. It includes source and transport factors. Source factors address how much P is available (for example, soil test P level and P fertilizer and manure application amounts). Transport factors evaluate the potential for runoff to occur (for example, soil erosion, distance and connectivity to water, soil slope, and soil texture). The P Index allows for relative comparisons of P runoff risk. When the P Index is high, recommendations are made either to apply manure on a P basis or not to apply manure at all. When the P Index is low, manure can be applied on a N basis. Also, if the P Index is high, the factors that are responsible for the higher risk of P loss are identified, and this information provides guidance for management practices to reduce the risk. For example, if the P Index is high because of high soil erosion, a recommendation to implement soil conservation best management practices (BMPs) may lower the risk and allow safe manure application.

For additional information:

To find your state’s P Index, do a web search for “phosphorus index” plus your state name.

Author: Jessica Davis, Colorado State University

How can I prevent leaching of nitrate into groundwater from manure applications?

Nitrate contamination of groundwater occurs when excess nitrate in the soil profile moves along with water that is moving down past the root zone of the crop. In most cases, it is not possible to keep water from moving past the roots, so the only other option for preventing nitrate leaching is to avoid having excess nitrate present in the root zone during times when leaching events are likely to occur. Determine the available nitrogen content of manure prior to application, and don’t apply more available nitrogen than the crop can use. Make the applications as close to the time the crop will use the nitrogen as possible.

Although only available nitrogen is subject to leaching, organic form nitrogen will become available as it mineralizes, at which time it too can leach if not utilized by the crop. The amount of nitrogen that will mineralize prior to and during the crop season should be taken into account when calculating manure application rates. If significant mineralization from previous applications is expected, plan to have a crop present to utilize it prior to leaching events.

Recirculation Systems for Manure Removal

Recirculation Systems for Manure Removal in Hog Confinements

Originally published as PIH-63.

Authors: Don D. Jones, Purdue University; Eldridge Collins, Jr., Virginia Tech

Reviewers: Doug Hamilton, Oklahoma State University; Jay Harmon, Iowa State University


Figure 1

Recirculation systems involve the addition of varying amounts of dilution water in order to improve the removal of manure from the animal area. The two types of recirculation systems used in pork production facilities are underslat flushing and pit recharge systems. Both systems use a shallow gutter that is flushed or drained periodically to remove waste from the building to the lagoon or storage basin. Open gutter systems have been used in the past but are no longer recommended because of concerns with disease transmission.

A flush system operates by using a surge of water to flush manure from the gutter. Water is periodically released into the gutter, usually with a flush tank (Figure 1). The amount of flush water and the flush frequency are designed to provide enough water to ‘scour’ manure from the gutter. Large volume pumps are sometimes used to provide flush water instead of flush tanks and smaller pumps. Spent flush water and manure enter the lagoon where it is treated and later reused for flushing. In areas where irrigation is practiced, fresh water may be used for flushing instead of recycled water and the flushed wastewater can be stored for later land application.

Pit recharge involves the periodic (three days to three weeks) draining of the pit contents by gravity to a lagoon/ basin, then recharging the pit with about 12 inches of new liquid in a short time, usually less than four hours. Regular pit draining removes much of the manure solids that would otherwise settle and remain in the bottom of the pit. Liquification of settled solids increases their likelihood of removal at the next pit draining. With less organic matter available for bacterial digestion, there is less gas production in the dilute pit contents, and a better in-house environment. In addition, fewer odorous gases are exhausted from the pits to the surrounding building vicinity. Regular and frequent loadings of manure also enhance lagoon performance. In farrowing and nursery buildings, pits typically are drained and refilled between groups. During winter months, cleanup water may be used as refill water to minimize radiant heat loss from the small pigs to cold recycled lagoon or basin water.

Advantages and Disadvantages

Recirculation systems have the greatest appeal to operators who wish to store manure outside the building and to those with suitable locations for lagoon or earthen basin construction, since the additional dilution water requires an earthen storage in order to economically handle the larger volume of manure. Assuming that the hog operation can accommodate a recirculation system, what are its advantages and disadvantages?

Advantages

  • Reduces in-house gases and odors. Frequent removal of the manure significantly reduces the characteristic ‘clinging’ odor inside the building and improves air quality. A three year study in North Carolina demonstrated that pit recharge systems have lower ammonia levels than either underslat flush or deep pit systems.
  • Adapts to building conversion. Older buildings are more easily converted to shallow recirculation gutters than deep pits since less construction is required.
  • Requires less land for manure application since up to 80% of the fertilizer nutrients are lost in the lagoon. (It should be noted that the P and K are concentrated in the lagoon sludge and may eventually be land applied.)

Disadvantages

  • Greater nutrient loss. Lagoon-treated animal manure has a greater nutrient loss than manure stored under a slotted floor.
  • Requires a relatively large land area for a lagoon. A lagoon takes four to six times more land area than the building itself.
  • Subject to mechanical problems. A recirculation system has mechanical components such as flush tanks and pumps that are subject to breakdown.
  • Lagoons/basins are a potential odor source if not designed and operated properly. They are not suitable in some locations, due to prolonged cold weather or proximity to neighboring residences.
  • Flushing may increase humidity in cold weather.

Basic Parts of a Recirculation System: Design and Operation – Pit Recharge System

A pipe from the main recharge line is installed into each pit, preferably as far as possible from the drain outlet. However, the location of this recharge pipe is not critical since liquid addition to the pit is the objective rather than a high velocity scouring action for flushing. The inlet pipe can be either stubbed directly into the pit wall with a conveniently located and protected butterfly valve outside the building, or it can enter the building wall near ceiling level and drop down to the pit with an inside-thebuilding valve. The diameter should not be reduced between mainline and pipe discharge.

The recharge system can be managed successfully with a flat pit floor, although a minimum slope of 1 inch in 20 feet to the drain is recommended to overcome uneven concrete construction. Enough pit depth must exist to cover the upper end of the pit floor with at least 6 inches of liquid while leaving at least 12 inches between the slats and the liquid at the highest part of the pit floor.

Underslat Flush Gutter Design

At least one-third of the floor area should be slotted. Manure removal from a flushed underslat gutter depends on the velocity, depth, duration, and frequency of the flush. These factors are determined by the dimensions and slope of the gutter and by the rate flush water is added to the gutter. To adequately clean the gutter, a flush velocity of at least 2.5ft per second is needed. A minimum of a 2.5in. depth of flow with at least a 10-second flush is recommended. For channels longer than 150ft or with flushing devices which have a longer flush duration, such as siphons, increase the flush volume proportionally to provide the needed cleaning action. A rule of thumb is to increase the initial depth of flow by 50%, or 0.5in. for each 25ft of gutter length beyond 150ft.

The flush device determines the initial depth of water flow. For instance, a 3in. siphon provides water for only about a 1in. depth of flow in a 24in. wide gutter, whereas larger siphons provide greater depths and can flush wider gutters. Since 3in. and 4in. diameter siphons release water in about 30 seconds, flush volume must be increased to compensate for the lower flowrate. A ‘tipping bucket’ flush tank can deliver a 3in. depth of flow in almost any width gutter with a 5-10 second release, while the door opening and volume of a ‘trap door’ tank can be designed to provide almost any depth of flow and flush duration.


Table 1


Figure 2

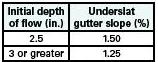
Consider depth of flow in selecting the gutter slope. Table 1 presents the recommended slopes for flushed gutters with various initial flow depths. To achieve the same cleaning action with less gutter slope, a greater depth of flow is required.

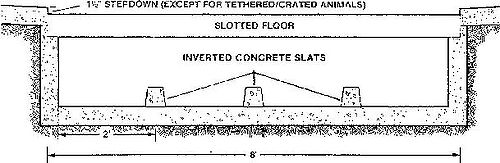
Slightly crown (1/4in.) the gutter floor and give a smooth finish. Gutters wider than 4ft should be subdivided into widths of 1.5-2 ft except for the first 10-20ft to allow the flush water to evenly distribute across the gutter width. This keeps water from channeling around waste deposits as it moves down the gutter. Inverted concrete hog slats or 6in. vinyl strips or 1×6 P.T. plank embedded in the floor work well for this purpose (Figure 2). For gutters longer than 200ft, consider draining both ends toward the middle of the building, and consult a knowledgeable building engineer for assistance.

Wherever possible, use gravity to carry waste to the lagoon or manure storage basin. Generally, a sewer line 8in. in diameter with a 0.5% slope is sufficient to carry manure to the lagoon. For flush tanks larger than 1000gal or where the same sewer line must handle several flush tanks, contact a knowledgeable engineer to determine if a larger sewer line or additional slope is needed. Locate a sump pit to collect discharged (or runoff) flushed wastewater. The drain line to the lagoon should be designed to prevent manure gases from the storage and drafts from entering the animal area.

Flush Equipment Design – Flush Frequency

Table 2


Table 3


Table 4

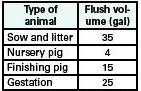
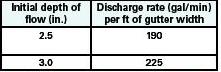
The required frequency of flushing is determined by two factors: animal density and the solids-carrying capacity of the water. The minimum flushing frequency can be determined by dividing the total daily flush volume (Table 2) by the recommended flush volume (determined by channel geometry in Table 3). Typical flush frequencies are twice a day for farrowing, nursery, and gestation buildings to four times a day for finishing buildings. When underslat gutters are flushed manually, the volume per flush is determined by simply dividing the flush volume per day by the number of flushes per day. Odors from underslat floors can be lessened by flushing at least four times a day, although pit ventilation in addition to frequent flushing is needed for best control of ammonia odors.

To insure cleaner pens in partially slotted buildings, keep hog density at about 4ft2 per 100lb of animalweight, use solid partitions except at the gutter area to help establish the desired dunging patterns, and adjust the ventilation system to keep the slat area colder than the resting area. Producers may need to floor-feed pigs during their first week in the building to help establish good dunging habits on partially slotted floors. A 1.5in. stepdown to the slats from the solid area also helps establish desired dunging habits.

Flush Devices

Figure 3


Several types of flush devices have been developed to provide the required flush volumes: automatic siphon tanks, tipping buckets, trap door tanks, manual dump tanks, and large volume pumps.

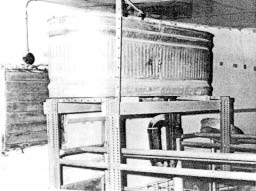
Automatic siphon tank: This tank has the singular advantage of no moving parts (Figure 3). As the tank slowly fills with water, an air bubble trapped under the bell is forced out a siphon pipe until it triggers the siphoning action. An automatic siphon tank can be placed above the pens to reduce tank floor space requirements.

Commercially available 8-24in. diameter automatic siphons can handle very large volumes of water. These flush units typically use a 1-1/2in. airrelease pipe to trigger the large siphon. Large siphons are well suited to flushing underslat gutters.

Figure 4

Tipping tank: A tipping tank dumps when it fills to a depth where the center of gravity of the water volume over-balances the pivot point. Usually the tank is elevated 4-6ft off the floor and the water is dumped backwards onto a curved spillway. This increases the velocity and lowers the head of water so it will clear a 9-10-inch opening between the bottom of the first slat and the surface of the gutter. Because the water discharges all at once, flushing velocity and depth are high and can cover a gutter 8-10ft wide (Figure 4). Gutters flushed with a tipping tank should be 12 inches deep or more to minimize water splash into the first pen.

Trap door tank: This flush tank has more moving parts than either of the above but allows greater design flexibility because both tank volume and trap door can be modified to meet individual needs. Care and precision are necessary to get a watertight seal around the door. An automated version of the trap-door or hinged-gate valved tank gives the flexibility of more frequent flushings when the operator is not present. The valve consists of a float-controlled flat plate that sets against a section of the PVC pipe in the tank bottom.

Large volume pumps: Large volume pumps can be used for flushing if sized to provide at least 100gpm per ft of gutter width, about 1-1/2in. water depth. The pump should operate 4-5min per flush channel at least two times a day for adequate flushing. Since additional cleaning is possible by operating the pump for a longer period, depth of flow does not need to be as great as with flush tank and flow dividers become more important to make sure distribution of water front is accomplished in wide gutters.

Waste Treatment Lagoons

Figure 5

A properly designed and operated lagoon is essential to the success of a flushing system (Figure 5). Although a single stage lagoon can operate satisfactorily in an underslat flushing system, a two-stage lagoon is preferred to minimize odor and potential disease transmission.

The design criteria for lagoons used with recirculation systems are the same as for conventional swine manure lagoons. See PIH-62, “Lagoon Systems for Swine Waste Treatment,” or MWPS-18, “Livestock Waste Facilities,” available from Midwest Plan Service, for design information on lagoons in your area.

Pumps and Pipes

In recirculation systems, pumps or gravity transport effluent from the lagoon to the building. In some cases, pumps are also needed at the low end of the gutter to transport wastewater to the lagoon.

Lagoon-to-Building Pump

Figure 6


Figure 7

In pit recharge, a low-pressure, self-priming centrifugal or submersible pump with enough flow capacity to recharge the largest building pit with an average of 12 inches of liquid in 4 hours or less is normally recommended. The pump intake is generally an open-ended suction pipe floating approximately 18 inches beneath the liquid surface of the lagoon. It may be screened with a 1 inch wire mesh fence or a basket with a total opening that is at least five times the opening area to the suction pipe.

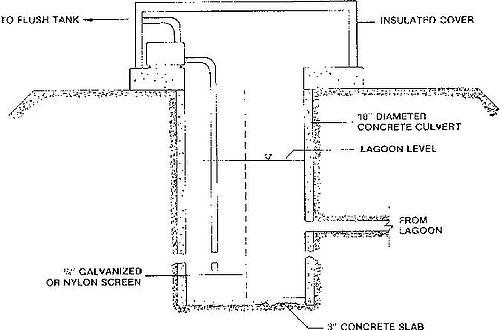
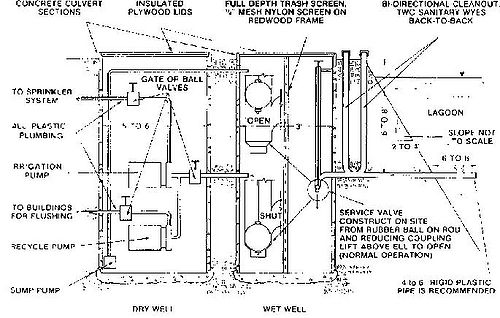
Slow speed pumps (1725rpm or less) cost more initially but usually last longer than higher speed pumps (3450rpm). Because of their shorter service life, it is a good idea to keep a replacement recharge pump on hand. Minimize the use of metal parts in contact with recycled lagoon water to prevent salt deposition that can plug the line. A lagoon-to-building pump can be placed on the lagoon bank in an insulated enclosure or in a wet-well sunk in the bank (Figures 6 and 7). The pump must be protected from freezing weather.

The intake pipe from the lagoon to the wet-well should be at least 18 in. below the lagoon surface, several feet from the bank and as far away as practical from the point where the waste enters the lagoon. Locate the pump as close as practical to the high water level of the lagoon (preferably below the low water level using a flooded suction) to minimize pump priming problems. The pipe must be installed within the berm during lagoon design and construction using anti-seep collars and proper engineering design.

Flush Gutter-to-Lagoon Pump

If a pump is needed to lift effluent from the building to lagoon, it should be a commercial grade, sewage lift-type activated with a float switch. Pump capacity should be determined in relation to the size of the sump that collects the spent wastewater to adequately handle the highest flow rate resulting from the flush tank discharges. Pump intake should have an adequate cleanable screen area.

Piping

Table 5

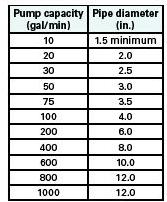
The pipe from the lagoon pump to the gutter can be relatively inexpensive plastic pipe and, if possible, should be one continuous piece. See Table 5 to determine the size you will need. Note the earlier warning about installing the pipe through the berm.

Salt Deposition Problems

If water is recycled from the treatment lagoon, salt buildup in pumps and pipes is a common problem. Avoid sharp turns in the supply pipe because they add to pressure drop and create turbulence conducive to salt precipitation. Regular addition of dilution water to the lagoon and removal of salts by irrigation will reduce problems. In most areas of the U.S., add a volume of dilution water that is equal to the volume of waste added. Use fresh water, lot runoff, roof runoff, or other sources for dilution water.

Dilute acetic or hydrochloric (muriatic) acids can be used to dissolve salt deposits. Muriatic acid can be bought in paint and hardware stores and is usually available at 20% solution. Plastic pipe can be dosed with undiluted 20% muriatic acid solution by filling the piping system with this acid, letting it stand overnight and then flushing the acid solution through the system. If possible, field spread this acidic high salt material at a very low rate, rather than back to the lagoon. If the flush system has metallic parts such as pump housing or metal valves, the acid should be diluted (1 part acid to 12 parts water) to prevent damage to the metal. CAUTION: DO NOT ADD WATER TO CONCENTRATED ACID! WHEN MAKING THE DILUTION- ALWAYS ADD THE CONCENTRATED ACID TO WATER. Use care and wear protective equipment because mixing acid can be very dangerous!

The following recommendations can reduce the rate of salt buildup on a recycling system:

  • Ground the electric pump-housing to prevent an electrostatic charge from building up on the metallic pump by attaching a cable to the pump-housing and to a ground rod driven into damp soil.
  • The pump suction line must be large enough to prevent cavitation (excess turbulence, resulting in a sharp pressure drop and increased salt deposition). A rule of thumb is that the suction line should be one standard size larger than the discharge of the pump. Locate the pump below or as close to the lagoon water level as possible to minimize the suction lift.
  • If the pump does not run continuously, modify the system so the pipes can drain between use.
  • The pipe from the lagoon to the gutter should have a minimum diameter of 1-1/2 in. The problems are not as great in larger lines as they are in smaller ones. (See Table 5).
  • Consider oversizing the supply pump and piping system, operating it on a timer, and allowing the system to drain when not in use. While more expensive to purchase, contact time between the pump and pipes and the lagoon water can be greatly minimized in this manner.


Table 1. Recommended slope for flushed gutters.

Table 2. Minimum required volume of flush water/day.

Table 3. Minimum gallons of water required to flush gutters at various depths of flow (5-10 second release).

Table 4. Tank discharge rates required to flush gutters at various depths of flow.

Table 5. Recommended pressure pipe sizes for various flow rates (Max. flow velocity=2.5fps)/

1. Determine dimensions of gutters. a) Gutter width b) Initial depth of flow (table 1 has recommendations) c) Gutter slope (table 1) 18ft 2.5in 1.5%

2. Determine flush volume and tank capacity. a) Required daily flush volume 720 hogs x gal of flush water/head/day (table 2) b) Minimum flush volume/gutter (table 3). If gutter is longer than 150ft, in¬crease flush volume by 50%. Total flush volume: gutter width x 45 gal/ft c) Volume/flush required if each gutter is flushed 6x a day. (Actual must be greater of 2.b or this volume) (Step 2a) ÷ (2 gutters x 6 flushes/day: 10,800 gal 1,215 gal 14,580 gal/day

3. Determine size of return pump from lagoon to flush tank. a) pump capacity to supply required flush volume (Step 2.d) ÷ 1,440 min/day b) Actual minutes between flushes (assume 12gpm pump is available and fills both tanks equally). (Step 2c) ÷ 12 gal/min 10.125 gpm 202.5 min

4. Determine size of return pipe (lagoon to flush tanks).* a) Select from table 5 using flow rate for pump selected in step 3. 2 in.

Pit Recharge Option Calculations

1. Determmine drop in gutter floor due to slope. Assume gutter slopes 1in/20ft. 1/20 x 160ft: 8 in. 2. Gutter width (18ft wide with dividers 2ft o.c.) 18 ft. 3. Gutter recharge depth at high end: minimum depth 6in 12 in. 4. Gutter volume if floor were level (length x width x depth at high end) (Step 3). 160ft x 18ft x 1ft: 2,880 cu ft 5. Gutter volume due to sloping floor: 1/2 x drop (Step 1) x length x width: 1/2 x 8in x1ft/12in x 160ft x 18ft: 960 cu ft. 6. Total recharge volume: Step 4 + Step 5 3,840 cu ft. 7. Total recharge volume in gallons Step 6 x 7.5 gal/cu ft: 28,800 gal 8. Recycle pump capacity needed to charge pit in 4hr: Step 7 ÷ (4hr x 60min/hr): 120 gal/min

  • Consider a larger pump and piping system and operating with a timer and float to minimize contact with corrosive lagoon water and salt deposition. A good rule of thumb is to operate the pump no more than 2 hours/day total.

Figure 1. Perspective showing the components of a flush gutter system.

Figure 2. Cross section of an underslat flushed gutter with dividers.

Figure 3. An elevated automatic siphon tank being used in a farrowing house.

Figure 4. Tipping bucket tank used for flushing underslat gutters.

Figure 5. Cut-and-fill construction for two-stage swine waste lagoon system.

Figure 6. Diagram of a wet-well configuration.

Figure 7. Pumping for a lagoon using a wet-wall and dry-wall configuration.