Are Models Useful for Evaluating or Improving the Environmental Impact of Pork Production?

green stylized pig logo

Models are basically equations that are based on real-world measurements. Measurements are made in different situations and/or different times. Models are used to make comparisons between different choices or look at “what if” scenarios without having to implement each possible option.

Generally, models that are created with large, diverse (but still compatible) data sets containing relevant information are going to be more reliable than models with smaller data sets with smaller data sets. Models can then be used to predict performance or evaluate changes in a system.

There are very good reasons to use models when looking at the environmental footprint of pork production:

  1. Efficiency. It is expensive and impractical to measure actual emissions from every farm or barn.
  2. Decision-making. Models allow farmers and their advisers to look at “what if?”. Prior to making an expensive decision, farmers can evaluate the location, type of building, manure storage, manure treatment, feed ration, etc. and select the best option.
  3. Measure progress trends. Models can be applied at different points in time to see if a farm or industry is making progress in reducing their impacts.

Are there limitations to models?

Yes. By their very nature, models are a simplified representation of a complex system. Modeling is a balance between complexity (how much information does the user need and how much time will it take?) and accuracy (how much is gained by including additional variables?).  The results must be evaluated in their appropriate context. As an example, many TV weather forecasters look at several sources of information, including models when formulating their forecast. While on a given day the forecast may be off (either due to inaccurate analysis or results) it is safe to say that overall, weather forecasting is greatly enhanced by the use of models.

Do you have an example of a model used on pig farms?

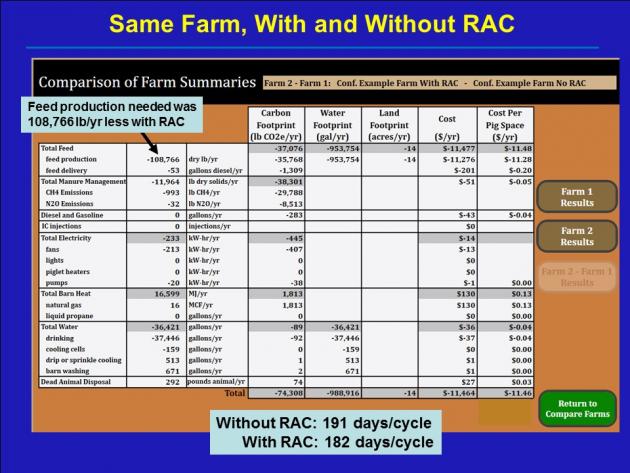
One example of a model that is currently looking at the environmental footprint of pork production is the Pork Production Environmental Footprint Calculator.  It currently estimates greenhouse gas (GHG) emissions and the day to day costs of the activities that generate those emissions, but research is underway to expand the model to include land,  and water footprints–leading to a more comprehensive “environmental footprint” model.

The model referenced above can be used for estimating the GHG emissions from the various operations on a pig farm in order to calculate the farm’s cumulative emissions. It shows where the major contributions arise, and provides a test bed for identifying strategies that reduce emissions at least cost. The model requires input information that most producers will know about their operation such as the type of barn, animal throughput, type and quantity of feed ration used, a physical description of the facilities (size of barn, insulation, fans etc.), the time in the barn, temperature profile for that area, type of manure management system (lagoon, dry lot, pit, etc.).  Sample costs for day to day farm activities are provided in the model, but can be updated by the user. The model output includes a summary of feed and energy usage for the simulation, including energy estimates for temperature control (both heating and ventilation) as well as costs.

Authors: Jill Heemstra, University of Nebraska jheemstra@unl.edu and Rick Fields, University of Arkansas rfields@uaex.edu

Reviewers: Dr. Jennie Sheerin Popp, University of Arkansas, Dr. Karl Vandevender, University of Arkansas

For More Information:

Acknowledgements

This information is part of the program “Integrated Resource Management Tool to Mitigate the Carbon Footprint of Swine Produced In the U.S.,” and is supported by Agriculture and Food Research Initiative Competitive Grant no. 2011-68002-30208 from the USDA National Institute of Food and Agriculture. Project website.

Does pig health have an impact on greenhouse gas (GHG) emissions?

green stylized pig logoAnimal health does affect greenhouse gas emissions. Sick animals are much less efficient and/or some sick animals may die.  In both of these cases, inputs are used but result in less (or no) product at the end. Most inputs, feed, water, climate control, etc. have greenhouse gas emissions associated with them.

Health status can also potentially change the characteristics of animal manure (amount, nutrient content) as feed and water consumption is disrupted. If the change causes manure to have a higher nitrogen content, the manure in storage may directly emit more nitrous oxide, a greenhouse gas.

Every day, farmers must make decisions on management of their pigs on managing health, from vaccinations to biosecurity planning. They need to consider the level of risk, the expense vs benefits, impacts on pig performance, employee time and skills, and impacts on neighbors.

With such a complexity of information and potential outcomes/impacts, more are turning toward decision tools or models to explore the potential ramifications of decisions and compare different scenarios. These models can be used to estimate outcomes such as  GHG emissions, environmental impacts, or other outputs.

Key Points – How Does Animal Health Relate to Environmental Footprint?

  • Emitted GHGs become a net loss to the system if the animal dies, or if the amount of that product (milk, meat, etc) is reduced due to poor animal health status.
  • Diseases or challenges that reduce productivity (weight gain, number of young born/weaned, milk yield or quality, etc.) tend to reduce efficiency (and increase waste) in the system.
  • Having accurate data to create decision tools or models will help provide farm decision-makers information to properly evaluate potential impacts and trade-offs as they work to improve efficiency and reduce environmental impacts.

For more information:

Acknowledgements

Authors: Rick Fields, University of Arkansas rfields@uaex.edu and Jill Heemstra, University of Nebraska-Lincoln jheemstra@unl.edu

This information is part of the program “Integrated Resource Management Tool to Mitigate the Carbon Footprint of Swine Produced In the U.S.,” and is supported by Agriculture and Food Research Initiative Competitive Grant no. 2011-68002-30208 from the USDA National Institute of Food and Agriculture. Project website.

Do Growth Enhancers Affect the Carbon Footprint of Pork Production?

green stylized pig logoIn swine production, maximizing growth rate while minimizing inputs (efficiency) is a top aim of most farmers. This helps an operation become more profitable, but it also has positive environmental benefits in that the amount of water, feed, or energy needed to produce each pound of pork is reduced. This results in fewer greenhouse gases emitted per pound of pork. (For more information on the relationship between efficiency and carbon footprint in animal agriculture see this Animal Frontiers article).

One particular growth enhancer used by pig farms is ractopamine. This is not an antibiotic, but it alters animal metabolism so that pigs produce more lean tissue (muscle) and less fat. For more on this feed additive, see this Texas A&M fact sheet).

A Comparison of Environmental Footprint With and Without Ractopamine

The image below shows a comparison of the same farm system with and without ractopamine. The results are estimated carbon, water, and land footprints as well as economic costs. The numbers were generated by the Pig Production Environmental Footprint Calculator.

The slide shows a smaller carbon footprint; -37,076 lbs of carbon dioxide equivalents per year when using ractopamine. This farm used 953,754 less gallons of water/year with the growth enhancer and required 14 less acres of land to support the farm. The economic implications (using prices from 2015) were a $11,477 advantage with ractopamine.

slide showing a comparison in carbon, water, land, and economic footprint for a farm with and without ractopamine as a growth enhancer

Slide credit: Dr. Rick Ulrich, University of Arkansas.

Are There Other Ways To Improve Growth Besides Ractopamine?

While growth enhances are a proven way to improve efficiency, there are other research-proven recommendations when making management choices to improve growth rate:

  • Phase feeding – diets change due to changing energy, protein, and other nutritional requirements are different as the animal grows
  • Balancing for specific amino acids (and not just crude protein) for each phase
  • Maintaining a clean environment
  • If in a building, keeping temperature in the optimum range

Management choices also impact health status and biosecurity protocols are used to prevent the presence of specific diseases.  In the past, antibiotics could be added to feed or water at low levels to enhance growth rate, but the concern over the proliferation of antibiotic-resistant bacteria resulted in the new policies to only utilize antibiotics to treat (rather than prevent) disease in food animals. The inclusion of antibiotics deemed medically important is being eliminated (federal rules took effect October, 2015 and the policy is in full effect at the end of 2016) for growth-promoting purposes. (For more, see this newsletter from the National Pork Producers explaining the rules to their members).

For More Information

Acknowledgements

Author: Amy Carroll, University of Arkansas

This information is part of the program “Integrated Resource Management Tool to Mitigate the Carbon Footprint of Swine Produced In the U.S.,” and is supported by Agriculture and Food Research Initiative Competitive Grant no. 2011-68002-30208 from the USDA National Institute of Food and Agriculture. Project website.

What are the different types of gasification systems for generating energy from manure?


Gasification Systems Requiring Relatively Dry Biomass

Fixed Bed Gasifier

Fixed Bed types produce low Btu gases and can use updraft or downdraft approaches. The updraft pulls hot air up from the bottom through the fuel where pyrolysis (decomposition of organics by heat in the absence of oxygen) occurs first, followed by reduction and oxidation. The syngas is not considered “clean” because it contains tars, un-combusted solids, and moisture. An advantage of updraft systems is that they are very scalable; they can be made for small or large systems. Downdraft gasifiers differ in that the oxidation step occurs after pyrolysis. This sequence creates a system where the char filters the gas. This is also a very scalable system that produces clean gas that can go right into a pipeline. A disadvantage in manure management is that manure needs to be pelletized which greatly increases the cost of using a downdraft system.

Fluidized Bed Gasifier

Fluidized bed gasifiers produce a more energy-dense syngas than fixed bed systems. A fluidized bed consists of heated inert materials through which combustion air rises upward and creates a mass of suspended solids through which the fuel can intermingle. When the temperature is high enough, the gasification reaction occurs. These systems are generally more complex than fixed bed systems and require more careful attention to operation and maintenance.

Gasification Systems That Can Process Relatively Wet Biomass

Catalytic Wet Gasification or Hydrothermal Gasification

One of the areas of great interest and research in research years is in developing gasification system that can handle wet biomass, such as raw pig manure, algal biomass, or municipal sewage. These systems require a metallic catalyst and are referred to as catalytic wet gasification or hydrothermal gasification. In addition to a high-energy syngas, this system also produces ammonia, which can be recovered and utilized as a crop fertilizer. These systems require efficient heat-recovery components and monitoring for potential catalyst-poisoning materials (especially sulfur-containing compounds) for optimum performance.

To see an example of current research in this area, visit: auger reactor gasification

For more information:

Acknowledgements

Author: Jill Heemstra, University of Nebraska jheemstra@unl.edu

This information is part of the program “Integrated Resource Management Tool to Mitigate the Carbon Footprint of Swine Produced In the U.S.,” and is supported by Agriculture and Food Research Initiative Competitive Grant no. 2011-68002-30208 from the USDA National Institute of Food and Agriculture. Project website.

How Can Algae Be Used to Manage Nutrients in Pig Manure?

green stylized pig logoUsually when people see the words “algae” and “manure” in the same paragraph, it is usually a negative take on the effects of manure nutrients on water. When excess nutrients are transported to water bodies (from lawn fertilizer, municipal waste treatment plants, manure and/or commercial crop fertilizer) algae use those nutrients and grow rapidly. When the nutrients are no longer sufficient for growth, the algae begins to die and decompose. This depletes oxygen in the water, which can lead to fish kills and other problems for aquatic life.

The same characteristics of algae that can make it a nuisance also make it an innovative way to treat wastewater when grown in an engineered system. The fact that the algae are able to utilize the nutrients within the water to multiply and grow rapidly can be exploited within a managed system to create a potential source of biomass, and serve as a biological mechanism to remove nutrients. The sustained biological activity of algae can also add dissolved oxygen to the water, potentially reducing the direct emissions of methane and nitrous oxide (greenhouse gases) from volatilization of stored manure. Current research is exploring the use of harvested algae as an animal feed, source of biofuel (algal oil production), or biomass in thermal energy production.

For more information:

Author: Rick Field, University of Arkansas and Jill Heemstra, University of Nebraska

Acknowledgements

This information is part of the program “Integrated Resource Management Tool to Mitigate the Carbon Footprint of Swine Produced In the U.S.,” and is supported by Agriculture and Food Research Initiative Competitive Grant no. 2011-68002-30208 from the USDA National Institute of Food and Agriculture. Project website.

Does Manure Solid-Liquid Separation Reduce Greenhouse Gas Emissions on Swine Farms?

green stylized pig logoThere is some research suggesting that separating swine manure into solids and liquids can slightly reduce greenhouse gas (GHG) emissions emitted from the manure itself. It is not likely to be significant enough for separation to be a viable strategy by itself.

The primary reason to use solid-liquid manure separation is to prepare manure for further treatment in a system that can:

  1. generate energy (such as anaerobic digestion, thermal technologies, etc.)
  2. produce products for re-use on a farm (such as bedding for dairy cows),
  3. generate compost or fertilizer.

Any of these options can reduce the GHG emissions or carbon footprint of a farm by replacing fossil-fuel intensive inputs.

For more information

Authors: Rick Fields, University of Arkansas and Jill Heemstra, University of Nebraska jheemstra@unl.edu

Acknowledgements

This information is part of the program “Integrated Resource Management Tool to Mitigate the Carbon Footprint of Swine Produced In the U.S.,” and is supported by Agriculture and Food Research Initiative Competitive Grant no. 2011-68002-30208 from the USDA National Institute of Food and Agriculture. Project website.

How Can Pig Farms Reduce Carbon Footprint?

green stylized pig logoEven though pig farms are not a large source of greenhouse gases (GHGs), the pork industry (along with many agriculture industries) are looking at GHG emissions to identify areas for improvement.

When carbon footprint is reported, you may see numbers that reflect the total GHG emissions for the entire industry or for individual farms. Sometimes you will see it reported in terms of GHGs emitted per pound of pork produced. This is a very appropriate way to examine an industry’s improvements over time as it standardizes the number against changes in number of animals, number of farms, etc.

There are several areas being researched as ways to reduce GHG emissions:

Recommended: [Fact sheet] What is a carbon footprint?

A National Pork Board report on the total production cycle showed that selection and planning of manure storage systems represents the biggest opportunity for reducing the carbon footprint of a farm. Manure emits methane and some nitrous oxide as it decomposes. Both of these GHGs, especially nitrous oxide, are more potent than carbon dioxide in their ability to trap heat.

The video below, by Rick Ulrich, University of Arkansas provides a summary of different areas that are being studied to develop a tool for pig farms on reducing environmental footprint.

Acknowledgements

Author: Jill Heemstra, University of Nebraska jheemstra@unl.edu

This information is part of the program “Integrated Resource Management Tool to Mitigate the Carbon Footprint of Swine Produced In the U.S.,” and is supported by Agriculture and Food Research Initiative Competitive Grant no. 2011-68002-30208 from the USDA National Institute of Food and Agriculture. Project website.

What Is Gasification of Manure?

green stylized pig logoWhen looking at ways to improve the environmental impact of pig production, renewable energy generation is a popular topic. One such technology, gasification, is a series of chemical reactions (see image at bottom) that involve heating a suitable organic material in a controlled, low-oxygen environment to the point that the hydrocarbons (simple organic compounds that contain only hydrogen and carbon) are converted to synthesis gas (‘syngas’). Syngas is composed of hydrogen and carbon monoxide with smaller amounts of methane and carbon dioxide, all of which can be collected and utilized for heat and energy generation.

This manure treatment technology also produces mineral-rich bio-char and ash. Since this bio-char is less bulky than raw manure (and contains most, if not all, of the nutrients) it is much easier to handle and more cost effective to transport long distances. This can be beneficial in areas where nutrients are becoming concentrated on crop fields and contributing to water quality problems. The use of bio-char as a topically applied  soil amendment is currently being  explored for its potential at reducing ionization and thus aiding in the retention of nutrients by impeding chemical transformations and volatilization.

a two ton per hour fluidized bed biomass gasifierMany different organic materials can be used in gasification; wood, plant residues, certain types of manufacturing or household waste, and manure, among other biomass sources. Standard gasification systems utilizes materials that are dry (not pump-able) like beef feedlot manure, poultry litter, or manure that has undergone solids separation. Pig or dairy cattle manure tends to be a wet material and either require drying or a system designed to handle materials like these – wet gasification systems.  Related: Different types of manure gasification systems.

For more information:

chemical representing thermochemical conversion of manure to energy and other products

Image above provided by Dr. Samy Sadaka, University of Arkansas

Authors: Rick Fields, University of Arkansas and Jill Heemstra, University of Nebraska jheemstra@unl.edu

Acknowledgements

This information is part of the program “Integrated Resource Management Tool to Mitigate the Carbon Footprint of Swine Produced In the U.S.,” and is supported by Agriculture and Food Research Initiative Competitive Grant no. 2011-68002-30208 from the USDA National Institute of Food and Agriculture. Project website.

What Is an Environmental Foot Print? (Ecological Footprint)

green stylized pig logoThe Cambridge dictionary defines environmental footprint as:

the effect that a person, company, activity, etc. has on the environment, for example the amount of natural resources that they use and the amount of harmful gases that they produce

Also referred to as an ecological footprint, this is a measure that attempts to consider multiple impacts of an activity rather than focus on a single one. In relation to the swine industry, this foot print takes into account the results of carbon, water, land and air footprints of pig farming.

Related: Evaluating the environmental footprint of pork production

How do you bring all of these different pieces together? In 2011, the U.S. National Pork Board and many land grant researchers launched a project to develop a science-based decision tool called Pig Production Environmental Footprint Calculator (PPEFC). The PPEFC has the ability to calculate (estimate) impact to greenhouse gas emissions, costs, land use, and water consumption across the pork production chain, including feed formulation and crop production. The combined analysis of all of these factors allows identification of potential ecologically and economically feasible production practices for pork producers.

One of the pieces of this project is developing an environmental footprint, cost, and nutrient database of the US animal feed ingredients and integrating it with the calculator. The calculator is built upon cradle-to-farm gate life-cycle assessment (LCA) of pork production combined with the US National Resource Council (NRC) swine nutrient requirements models (NRC 2012), farm operation inputs, and animal feed database. Farm operation inputs include: barn characteristics, utilities, manure management, dead animal disposal, and farm operation costs. For a description of the inputs, visit this conference presentation at LCA Foods 2014.

Additional Information

Factsheets: What is a water footprint? | What is a land footprint? | What is a carbon footprint?

Pig Production Environmental Footprint Calculator (National Pork Board).

Animal agriculture and:

Acknowledgements

Author: Amy Carroll, University of Arkansas

Reviewers: Jill Heemstra, University of Nebraska; Karl Vandevender, University of Arkansas

This information is part of the program “Integrated Resource Management Tool to Mitigate the Carbon Footprint of Swine Produced In the U.S.,” and is supported by Agriculture and Food Research Initiative Competitive Grant no. 2011-68002-30208 from the USDA National Institute of Food and Agriculture. Project website.

Carbon Footprint, Life Cycle Assessment and the Pork Industry

green stylized pig logoAnimal agriculture in the U.S. contributes approximately 3.5% of all man-made greenhouse gases (GHGs). If you look at pork production, it accounts for just 0.34% of all emissions. (Source: U.S. EPA Greenhouse Gas Inventory released April, 2015).

When you total up all the GHG emissions from a particular activity or process, it is called a carbon footprint. The procedure used to decide which GHG emissions are included in this total is a life-cycle assessment (LCA).

What Is a Carbon Footprint and How Is It Used?

A carbon footprint gives you a snapshot in time of the GHGs produced by the activity or process being evaluated. The number generated is especially useful for comparing different processes or different times.

Some reasons a farm, company, or industry would calculate a carbon footprint include:

  • Identifying “hot spots” in the system to prioritize areas where reductions can be made
  • Creating a baseline measure for comparing over time
  • Looking at “what-if” scenarios and comparing different options to see how each affects GHG emissions

What Goes Into a Life Cycle Analysis?

In order to be able to compare carbon footprints of different farms or different industries, the life-cycle analysis (LCA) needs to use the same parameters. To do this, many people rely upon standardized procedures such as those created by the International Organization for Standardization.

For the pork industry, the pork supply chain is broadly divided into eight stages:

  • feed production;
  • live animal production;
  • delivery to processor;
  • processing;
  • packaging;
  • distribution;
  • retail;
  • consumption/disposal.

The most important thing to remember is that if you compare two or more carbon footprints to each other, the LCA used needs to be the same. If you try to compare footprints generated using different LCAs, you will not get a true comparison.

For more information

Authors: Jill Heemstra, Nebraska Extension and Rick Fields, University of Arkansas

Acknowledgements

This information is part of the program “Integrated Resource Management Tool to Mitigate the Carbon Footprint of Swine Produced In the U.S.,” and is supported by Agriculture and Food Research Initiative Competitive Grant no. 2011-68002-30208 from the USDA National Institute of Food and Agriculture. Project website.