 A carbon footprint is a total of all the greenhouse gas emissions (GHG) from a process or industry. A life cycle assessment (LCA) is the process used to figure out what GHG emissions will be included in the footprint. More technically, it is systematic way of looking at a product’s complete life cycle and calculating a “footprint”. In addition to carbon footprints, there are efforts to calculate land, water, and other environmental footprints.
Below are highlights from several different reports that looked at the carbon footprint of the pork industry on a national and international scale. A comparison between different ways to raise pigs was also highlighted.
Snapshot of the Present Time
On a national scale, a report on the National Life Cycle Carbon Footprint Study for Production of Swine in the U.S. was conducted and published in 2011.
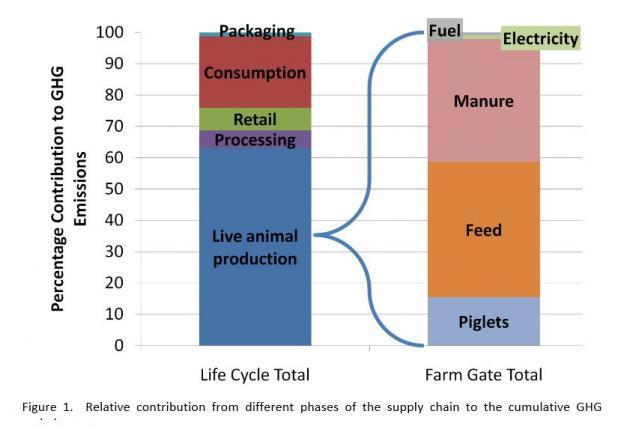
The report concluded that the carbon footprint to prepare and consume a 4 oz serving of pork was ~2.5 lbs of carbon dioxide equivalents. Figure 1 (below) from that report shows the relative breakdown of the industry’s estimated greenhouse gas emissions:
- Live animal production made up 62.1% of the emissions. That is further broken down and presented in second column (right).
- Processing – 5.6%
- Retail – 7.54%
- Consumption – 23.5% including refrigeration, cooking, and methane from food waste in landfill
- Packaging (1.3%);

Comparison Over 50 Years of Production
Another example of an industry-wide analysis, this one comparing over time, is a “50-year comparison of the carbon footprint of the U.S. swine herd 1959 – 2009” (29 pp; PDF). The pork industry overall emits more total greenhouse gases than 50 years ago, but actually emits much less per pound of pork produced because of improvements in efficiency.
From that publication:
The U.S. swine industry produces pigs far more efficiently today (2009) than in 1959. The number of hogs marketed has increased 29% (87.6 million in 1959 to 112.6 million in 2009 after removing market hogs imported directly to harvest) from a breeding herd that is 39% smaller. The efficiency gain is even more impressive when measured against the total dressed carcass weight harvested. Dressed carcass yield leaving the farm has nearly doubled in 50 years from 12.1 billion pounds to 22.8 billion pounds. This increase in productivity has resulted in an increase of 2,231 pounds (2.5x) of carcass harvested annually per sow – year. Today, it takes only five hogs (breeding and market) to produce the same amount of pork that required eight hogs in 1959.
Comparing Different Ways of Raising Pigs
An example of an LCA that looks at different types of systems is “Life-cycle assessment of commodity and niche swine operations“. (informal Q&A and journal article both available). From the journal article (bottom of page 5):
High-profitability operations have consistently lower impacts compared to low-profitability operations for both commodity and deep-bedded niche piglet production.
Global Assessment from Backyard to Industrial Systems
On an international scale, the report “Greenhouse gas emissions from pig and chicken supply chains” was published in 2013. This study looked at all scales of farms from backyard pigs to industrial production (large confinement operations). Over the entire scale, they estimated that the carbon footprint of pork for every kg (~2.2 lbs) of pig carcass weight has an emissions intensity of 6.1 kg of carbon dioxide equivalent.
This report found that backyard systems, especially in some parts of the world, have low emissions, largely due to by-product or “second-grade” feeds. Industrial pig systems tended to have more emissions intensity than backyard systems, with the emissions from liquid/slurry manure management systems being a big reason. From the conclusion of the report:
When drawing any conclusions about scope for improvement, the following points should be borne in mind: (a)differences in emission intensity may reflect differences in production systems that have arisen over time to enable the system to perform better within a given context, e.g. to make them more profitable, or resilient; (b) focusing on a single measure of efficiency (in this case GHG emissions per kg of output) can lead to positive and negative side effects on, for instance, biodiversity, water quality and animal welfare; (c) reducing GHG emissions is not the only objective producers need to satisfy, as they also need to respond to changing economic and physical conditions.
How Do Carbon Footprints Compare?
It is very important to note that when looking at data and numbers generated from different reports like these, the carbon footprints are difficult to compare unless they use the same LCA. Presenting carbon footprints from different LCA’s is an “apples to oranges” comparison. Only when the same LCA is used, can they be an “apples to apples” comparison.
Additional Information
- Pig Production Environmental Footprint Calculator
- [Fact sheet] What is a carbon footprint?
- [Archived webinar] Life Cycle Assessment Modeling for the Pork Industry (Note: the audio of the recording is not great quality – we apologize for those issues)
- What greenhouse gases are emitted by pig farms?
- Evaluating the environmental footprint of the pork industry
Acknowledgements
Authors: Amy Carroll, University of Arkansas and Jill Heemstra, University of Nebraska jheemstra@unl.edu
This information is part of the program “Integrated Resource Management Tool to Mitigate the Carbon Footprint of Swine Produced In the U.S.,” and is supported by Agriculture and Food Research Initiative Competitive Grant no. 2011-68002-30208 from the USDA National Institute of Food and Agriculture. Project website.

