Side-dressing Emerged Corn with Liquid Livestock Manure

The application of livestock manure to farm fields has always been an expense for producers. On-farm research plots were assessed in Ohio following application of  liquid swine and liquid dairy manure using drag hoses to provide side-dress nitrogen to emerged corn. A six-inch diameter drag hose was used to side-dress corn with swine finishing manure at the V3 stage for four crop seasons. The manure was incorporated at a rate of 6,500 gallons per acre to replace purchased commercial side-dress nitrogen. Plot yield results indicated liquid swine manure produced higher yields when compared to 28% urea ammonium nitrate fertilizer when applied at similar nitrogen levels and the cost savings on purchased fertilizer paid for the manure application cost. The use of liquid manure to sidedress corn can provide a new window of time for manure application in Ohio and apply manure when the nutrients could be utilized by a growing crop.

Purpose

The process of applying liquid swine finishing manure to farm fields represents a significant expense for livestock producers despite the value of the nitrogen, phosphorus and potash contained in the manure. Ohio farmers continue to reduce wheat acreage shifting more of their manure application to the fall application window. The ammonium nitrogen in fall-applied manure is subject to loss before a crop is planted the following season. In the Western Lake Erie Basin of Ohio, an area over three million acres in size, surveys have shown approximate half the livestock manure generated annually is applied in the fall after crops are harvested (Zhang et al., 2015). This allows much of the manure nitrogen to be lost to leaching before the following crop season. Recent research has determined the amount of nitrogen entering Lake Erie influences the toxicity of the hazardous algae blooms.

The ammonium nitrogen in fall applied swine finishing manure can be captured by growing cover crops. A fall cover crop study (Sundermeier, 2010) indicated that an actively growing radish crop reduced soil nitrate nitrogen levels from 21.3 ppm to 6.5 ppm. This prevented the nitrogen from being lost from the field, but only a portion of the organic matter created would mineralize the following crop season to provide nitrogen for a growing crop.

The incorporation of swine finishing manure directly into a growing corn crop with a manure tanker has proven to provide corn yields similar to commercial fertilizer (Arnold et al., 2017). However, Arnold et al. noted soil compaction was a concern with the heavy manure tanker. Using a drag hose to incorporate the manure into emerged corn should overcome the soil compaction concern and allow the corn crop to utilize the available nitrogen in the swine finishing manure. The money saved by not needing to purchase commercial nitrogen to side-dress the corn crop could exceed the cost of the manure application.

What did we do?

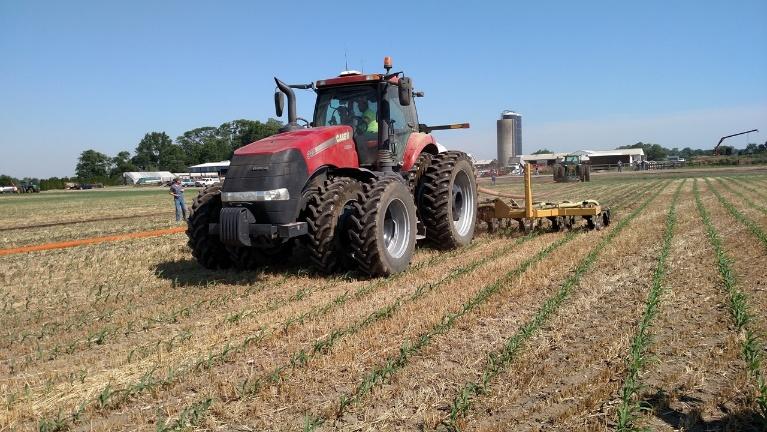
This study was designed to determine whether the ammonium nitrogen in liquid swine finishing manure could produce corn yields similar to commercial 28% urea ammonium nitrate (UAN) when the manure was side-dressed on emerged corn using an injection toolbar and soft drag hose (Figure 1).

Figure 1. Side-dressing V2 corn with liquid manure.

In each of the four years of this complete block design study, started in 2014, manure was incorporated at a rate of 6,500 gallons per acre to provide approximately 210 pounds per acre of nitrogen. The 28% UAN treatment was applied at approximately 70 gallons per acre to provide 210 pounds of nitrogen per acre. All treatments also received 10 gallons of 28 percent UAN as a row starter fertilizer at planting time to provide approximately 30 pounds of nitrogen. The two treatments (manure and commercial fertilizer) were replicated three times each season.

Figure 2. Manure drag hose across V3 corn.

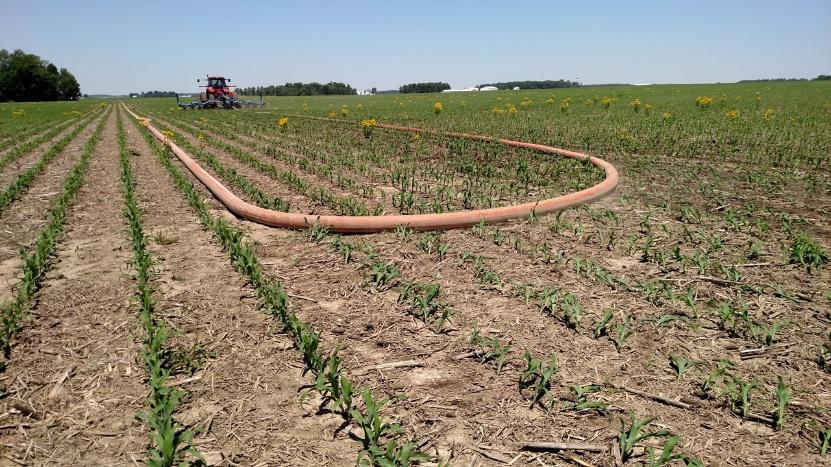
To fit the needs of the commercial manure drag hose operator, each year the corn fields were planted at a 45 degree angle with a 12-row planter using auto-steer. This allowed the commercial manure applicator to stretch the empty manure hose diagonally across the field from one corner to the other at the start of the manure application process (Figure 2).This divided the square field into two triangles and the applicator could apply manure to the entire field without the need of a second tractor to assist in moving the full manure hose. The field had 36 rows (90 feet) of end rows completely around each field allowing the drag hose operator sufficient room to make turns and keep the manure within the boundaries of the field.

The manure came from a 2,450 head swine finishing building with an eight foot deep pit under the animals. This finishing building design is common in Ohio. The manure was pumped through an eight inch diameter hose to the edge of the corn field. A six inch diameter drag hose was pulled across the field during the manure application process.

Figure 3. Drag hose damage caused the corn to lean for about a day.

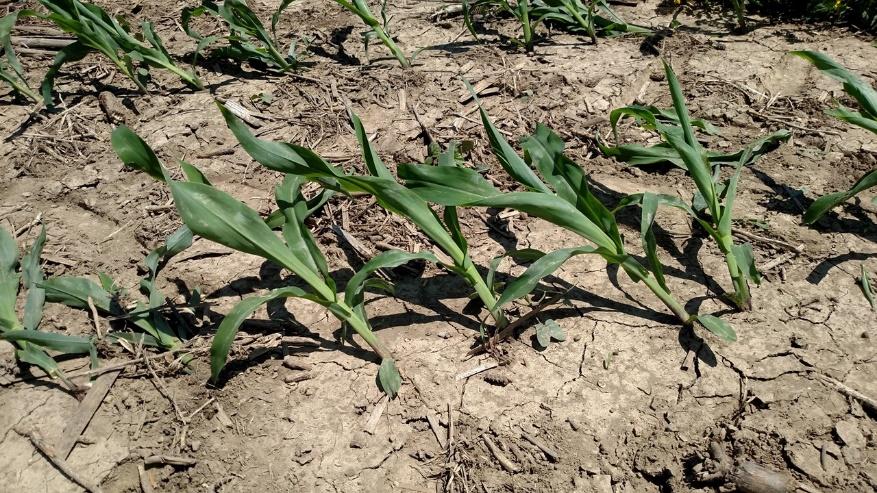
The corn flattened by the hose typically recovered, i.e. was standing upright, by the following day (Figure 3). The pressure in the hose at the building was more than 200 pounds per square inch. The hose pressure at the toolbar in the field was approximately 30 pounds per square inch. The flow rate was typically between 1,400 and 2,000 gallons per minute depending on the type of pumping equipment used, the diameter of the hoses used, and the distance from the manure storage site to the field during each of the four years.

Manure samples were collected and analyzed during the application process each season. The nitrogen, phosphorus and potassium content of the manure was similar each year so application rates were kept the same each season. The analysis indicated the manure contained 32.1 pounds of available nitrogen, 18.0 pounds of P205 and 24.9 of K20 per 1,000 gallons (Table 1).

Table 1. Average nutrient analysis of swine finishing manure applied.
Nutrient Pounds per 1,000 gallons
 Total Nitrogen 34.3
 Ammonium Nitrogen (NH4) 31.0
 Organic Nitrogen 2.2
 Available Nitrogen 32.1
 Phosphorus (P2O5) 18.0
 Potash (K2O) 24.9

The liquid manure application toolbar had rolling coulter manure application units with a wavy coulter tilling up a strip of soil approximately six inches deep and three inches wide. The manure boot applied manure over the tilled strip and the manure was covered by a pair of notched soil closing wheels. Treatments were approximately 1,200 feet long and 30 feet (12 rows) wide. The auto-steer unit used for planting the crop was transferred from the planting tractor to the 275 horsepower tillage tractor, attached to the toolbar and drag hose, for the manure application. The center unit on the toolbar was removed to prevent tillage and manure application to the center row. This enabled the drag hose to ride higher on the soil surface and lessen the scouring of the field. The manure for the center row was diverted to each side so each side received 150% of the normal manure application rate. 

In each year of the study manure was not applied to three strips, 12 rows wide, in each field. These strips were fertilized with 28% UAN the same day with the same rate of nitrogen contained in the swine finishing manure. These commercial fertilizer strips did, however, have the drag hose pulled across them as the commercial manure applicator applied manure to all other parts of the fields. Commercial 28% UAN was applied to the ends of the corn fields and edges of the corn fields where the swine manure could not be incorporated.

The fields were no-till or minimum-till and the previous crop each year was soybeans. Plant population counts were conducted each year of the study. The predominant soil type in the fields were Blount Silt loam, end moraine 0 to 2 or 2 to 4% slopes

Soil samples of each of the four fields in this study showed P205  and K20 levels to be in the maintenance range. The Mehlich III P205  levels ranged from 59 to 81 ppm and the K20 levels ranged from 149 ppm to 184 ppm (Table 2).

Table 2. Annual soil nutrient test results (Mehlich III).
Year
2014 2015 2016 2017
 pH 6.7 7.0 7.0 6.8
 Organic Matter (%) 2.9 2.5 2.6 2.8
 P2O5 (ppm) 66 76 81 59
 K2O (ppm) 161 149 162 184

At harvest time each year, yields and moisture data were collected using the combine’s monitor. The monitor was calibrated each season before the manure side-dress plots were harvested. All yields were adjusted for moisture. Yield data were analyzed by ANOVA at the 0.10 probability level. 

What we have learned?

Over the four years of this study the incorporated swine finishing manure treatments increased yields when compared to the incorporated 28% UAN treatments by an average of 14.8 bushels per acre (Table 3). This varied from no yield increase the 1st year (2014) to 33 bushel per acre yield increase in 2015, an unusually wet growing season.

Table 3. Corn yield for treatments comparing nitrogen applied as UAN at planting to side-dressed hog manure. Subscript letters a and b indicate yields that year were statistically different using ANOVA at 0.10 probability level.

Yield in Bushels per Acre

 Treatments

2014

2015

2016

2017

4-year ave.

 Incorporated 28 percent UAN

204

121a

216a

145a

171.5

 Incorporated swine manure

204

154b

222b

165b

186.3

 Least Significant Difference (0.10)

17.65

15.57

2.37

0.19

 Coefficient of Variability

2.45

4.74

0.62

0.39

The normal accumulated precipitation for the growing season (April 1 through September 30) in this area of Ohio is 23.3 inches. The 2015 season was much wetter than normal, and the 2016 season was drier than normal (Table 4).

Table 4. Annual planting dates and normal and observed temperature and precipitation data from April 1 through September 30.
Year
2014 2015 2016 2017
 Corn planting date April 25 May 15 April 20 June 1
 Normal precipitation (inches) 23.3 23.3 23.3 23.3
 Actual precipitation (inches) 21.0 32.6 16.5 23.6
 Historical average temp (°F) 65.7 65.7 65.7 65.7
 Actual average temp (°F) 65.3 66.2 67.2 65.9
 Average high temp (°F) 76.8 77.6 78.8 77.4
 Average low temp (°F) 54.8 55.8 56.7 55.4
 Total growing degree days 2,876 3,006 3,272 2,960

The application of 6,500 gallons per acre of swine finishing manure supplied approximately 210 pounds per acre of side-dress nitrogen for the corn crop while also supplying sufficient phosphorus and potash for the corn crop and the soybean crop the following year without applying excessive phosphorus (Table 5). 

Table 5. Nutrient balance of swine finishing manure side-dress of corn. Nutrient removal rates are from Vitosh et al., 2003 (Tri-State Soil Fertility Guide).
 Crop Nutrient removal in pounds per bushel:

200 bushel per acre corn crop followed by a 60 bushel per acre soybean crop

Available nitrogen (ammonium nitrogen + half the organic nitrogen)
P205 K20 P205 K20 N
 Corn 0.37 0.27 74 48
 Soybeans 0.80 1.40 54 84
 Total nutrients removed 122 138
 Nutrient content of 6,500 gallons of swine finishing manure applied 117 162 210
 Net nutrients -5 +24

In the first year of this study (2014) the field conditions for manure application were less than ideal. The field was wet and the drag hose scoured more than an inch of soil from the field resulting in some of the V1 corn plants being buried and others being pulled out. This reduced the final plant population of the corn rows next to the drag hose by approximately three thousand plants per acre. In each of the following seasons, when V3 plants were side-dressed, the field conditions were firmer and stand loss from the drag hose was not an issue. This stand reduction may have been the reason why 2014 was the only season in which manure did not yield statistically better than the commercial fertilizer.

The hose dragged across emerged plants caused an obvious lean immediately after the application process. By the following day all the plants were upright again. Stand counts indicated approximately 32,000 plants per acre across both treatments in the 2015, 2016, and 2017 seasons.

The 2015 crop season had the largest difference in crop yields between the treatments. Rainfall that season was more than nine inches above normal (Table 4). Most of this extra rainfall fell during the 35 days following the side-dress treatments. We theorize that the lower yields with the UAN treatment was a result of a greater portion of the commercial fertilizer nitrogen being lost to either denitrification or leaching than the manure nitrogen during that time period.

In the 2017 season the corn was originally planted on April 25. Emergence was so poor as to justify replanting, but field conditions were not firm enough to replant until June. The side-dress applications took place two weeks after planting as the corn grew rapidly with the warm temperatures.

The swine finishing manure application rate of 6,500 gallons per acre provided more than an adequate amount of nitrogen for the corn crop while being just short of balancing phosphorus for the two year needs of a corn-soybean rotation. The amount of potash applied with the manure was 24 pounds more than needed for the crop rotation.

The cost of purchasing 28 percent UAN fertilizer to side-dress corn averaged approximately 40 cents per pound during the four years of this study. At an application rate of 210 pounds per acre the commercial fertilizer side-dress cost was $84.00 per acre (210 pounds * $0.40 per pound). The landowner’s custom cost for applying liquid swine finishing manure was $8.00 per 1,000 gallons or $52.00 per acre (6,500 gallons at $8.00 per 1,000 gallons). The cooperating farmers in this study valued his corn at $3.40 and the 14.8 bushel advantage for the manure treated plots were valued at $50.32 per acre. He also did not need to purchase side-dress nitrogen for the acres where manure was applied, and this saved an additional $84.00 per acre.

Future plans

In this study the application of liquid swine finishing manure at side-dress produced higher corn yields, compared to commercial fertilizer, in three of the four study years. Incorporating liquid swine finishing manure as a side-dress nitrogen source to emerged corn can boost yields, reduce nutrient losses, and give livestock producers another window of time to apply manure to farm fields in-season. The money saved on purchasing commercial side-dress nitrogen can pay for the cost of the manure application to an emerged corn crop.

Ohio State University extension now owns three 12-row manure side-dress toolbars which are being loaned to livestock producers and commercial manure applicators for their use to side-dress emerged corn. We discovered that very few commercial manure applicators in Ohio currently have row-ready tractors and only a small percentage of livestock producers have large enough tractors to pull the drag hoses. Grant monies have also been secured to provide tractors to pull the sidedress toolbars.

There is strong interest from commercial manure applicators to apply manure to corn fields. This practice enables them to apply more total gallons of manure in a year. Current indications are that the application of manure to corn fields will continue to expand in the years ahead as commercial applicators gear up for this practice. Every gallon of manure applied to a growing corn crop in early June is one less gallon likely to be applied during the fall application window.

Authors

Arnold, G. , Field Specialists, Manure Nutrient Management Application, Ohio State University Extension. arnold.2@osu.edu
Custer, S., County Extension Educator, Darke County, Ohio State University

Additional information

Arnold, G. J. (2015). Corn yield results from side-dressing with liquid livestock manure. Journal of the NACAA, 8(2). Retrieved from https://www.nacaa.com/journal/index.php?jid=329

Sundermeier, A. (2010). Nutrient management with cover crops. Journal of the NACAA, 3(1). Retrieved from https://www.nacaa.com/journal/index.php?jid=45

Vitosh, M. L., Johnson, J. W., & Mengel, D. B. (2003). Tri-state Fertilizer Recommendations for Corn, Soybeans, Wheat and Alfalfa. Purdue Extension, Lafayette, IN.

Zhang, W., Wilson, R. S., Burnett, E., Irwin, E. G., & Martin, J. F. (2016). What motivates farmers to apply phosphorus at the “right” time? Survey evidence from the Western Lake Erie Basin. Journal of Great Lakes Research, 42(6), 1343–1356. https://doi.org/10.1016/j.jglr.2016.08.007

Facebook Page: Ohio State University Environmental and Manure Management

Ohio State University Extension Nutrient Stewardship YouTube: https://www.youtube.com/channel/UC7jUsQNGM8fCHjbZUdT9pKw


Acknowledgements

Thanks to Harrod Farms of Rossburg, Ohio for working with Ohio State University Extension on this research project


The authors are solely responsible for the content of these proceedings. The technical information does not necessarily reflect the official position of the sponsoring agencies or institutions represented by planning committee members, and inclusion and distribution herein does not constitute an endorsement of views expressed by the same. Printed materials included herein are not refereed publications. Citations should appear as follows. EXAMPLE: Authors. 2019. Title of presentation. Waste to Worth. Minneapolis, MN. April 22-26, 2019. URL of this page. Accessed on: today’s date.

Impacts of New Phosphorous Regulations on Composting of Animal Manures

The Problem

Concerns are mounting in states that have sensitive waterways about the release of P from manure and compost into ground and surface water. P is the limiting nutrient for many freshwater ecosystems and as such regulate the rate of eutrophication and oxygen depletion. The concerns have led to new regulations that limit the application of manure and in some cases compost products that have high concentrations of P.  Also, compost use in stormwater biofiltration swales has been called into question because of the potential leaching of P. There are concerns in the composting industry that the regulations will limit the application of compost and reduce the market for compost products.

Composting can theoretically increase the biological activity of the soil matrix and help the formation of aggregates that absorb nutrients. Compost also contains metals such as iron, magnesium, calcium and aluminum that help bind P to the soil particles.  Composting has a substantial impact on N as the high temperatures result in losses of ammonia. Depending on the stage of composting, the bacterial thermophilic phase of composting can release P during the breakdown of plant and animal tissue. In contrast the curing or fungal phase can bind nutrients into the hyphae and to the stabilized organic substrate. Additionally, soils high in organic C have lower bulk densities and prevent runoff because of the increased water holding capacity and infiltration rates*. The concept is that even though the overall P levels in the soils are increasing with compost application, only a small portion of the P is in the liquid phase and there is sufficient soil and plant uptake to limit P losses.  

*Spargo, J.T., G.K. Evanylo, and M.M. Alley. 2006. Repeated compost application effects on phosphorus runoff in the Virginia Piedmont. J. Environ. Qual. 35:2342–2351.

What did we do?

In 2014, Green Mountain Technologies (GMT) received an Animal Waste

Figure 1. Site map for Days End Farm

Technology Fund (AWTF) grant from the Maryland Department of Agriculture to install an Earth Flow composting systems at Days End Farm (DEF, Fig. 1) in Howard County and Glamor View Farms in Frederick County.  There were two types of manures that were tested, dry pack manure from Glamour View Farms and bedded horse manure from Days End Farm.

Days End Farm Horse Rescue is a non-profit, volunteer-based animal welfare organization established in 1989 to provide care and treatment for horses that have been abused or mistreated.  DEF works to rehabilitate horses, find good homes for them and educate the public about humane treatment of horses. DEF cares for between 100-150 horses annually, rehabilitating them and preparing them for adoption.

Figure 2. Locator map for Glamor View Farms

Glamour View Farm (GVF, Fig. 2) is a 146-acre dairy operation which is a part of Lager Farms. Glamour View houses approximately 180 Holstein and Jersey cows.  In 2014, Green Mountain Technologies (GMT) and GVF received an AWTF grant from the Maryland Department of Agriculture to install an Earth Flow composting system at GVF in Frederick County, Maryland.

Description of the Earth Flow Composting System

The Earth Flow (Fig. 3 & 4) is an in-vessel composting system that integrates an automated mixing system, aeration system and moisture addition system into the vessel.  The Earth Flow system accelerates the composting process by providing optimum conditions for aerobic composting. The combination of these features facilitates a thermophilic composting process for horse manure and bedding in 10-14 days.

Figure 3. Earth Flow composter end view
Figure 4. Earth Flow composter interior

The Earth Flow has an integrated mixing system (Fig. 5) that allows the compost to be mixed on a daily basis (2-4 times per day).  The traveling auger is the key to the effectiveness of the Earth Flow. It provides seven different functions that facilitate the hot composting process:

  1. Shreds.  The auger breaks up manure balls to reduce particle size and expose nutrients to the microbes.
  2. Mixes.  The auger mixes material by smearing manure onto bedding.
  3. Aerates.  The auger continually fluffs the compost to add oxygen to the compost matrix.
  4. Distributes Moisture.  The auger sweeps up wet material from the lower portions of the compost pile and elevates it to the surface.  
  5. Homogenizes.  The auger homogenizes manure with bedding for an even distribution of nutrients.
Figure 5. Auger mixing system
  1. Transports.  The auger slowly increments compost from the load end to the discharge end.
  2. Stacks.  As compost reduces in volume, the auger continually stacks the material toward the back to maximize utilization of the space.


The Earth Flow is designed such that feedstocks are loaded on one end of the vessel and finished product is discharged from the opposite end of the vessel.

The Earth Flow at Days End Farm is operated as a continuous-flow system.  In a continuous-flow system, feedstocks can be loaded at any time on the load end and the traveling auger slowly migrates compost to the discharge end.  Material can be discharged once the vessel is full and/or the user is ready to discharge compost. The standard mixing pattern of the auger is shown below.

The basis of the study was to evaluate whether composting manure would reduce the amount of P, especially the water extractable P compared to raw manure.  The theoretical basis for this reduction is that composting would add more carbon and also tie up P in the increased biomass making it less available to run off.  While N can be lost to the atmosphere as ammonia or converted to elemental nitrogen gas, P is only transportable in liquid phase and can neither be created or destroyed by the normal biological processes.  P is essentially recycled through biomass and decaying plant and animal tissues release P that is the reabsorbed by new living tissue.

Samples of raw manure were collected prior to composting and the same manure was sampled 3-4 weeks later to determine the changes in nutrient levels and water extractable P.  Samples were taken every quarter for a one year period to assess any seasonal changes. One of the proposed applications for the compost product was bedding reuse so some of the focus of the study related to product quality as a recycled bedding material.

What we learned

Bedded Horse Manure

The average total Nitrogen (N) of 0.68% comprised 0.03% Ammonia-N of the loaded mixture (over the study period) with 52% moisture and 48% solids, with a total carbon content of about 40%, resulting in a C:N ratio of 29. Total P in the loaded mixture was 0.17% of which 0.40% was P2O5. For the compost produced during this period, the total N averaged 0.6% (5980 mg/kg) of which 0.06% was ammonia (577 mg/kg) and 0.54% was organic N (5436 mg/kg) and 470 mg/kg nitrate-nitrite N. The total carbon was 44.87% (44867 mg/kg), resulting in a C:N ratio of 214, with an average moisture content of 20% (Tables 3 and 4).

The average N:P ratio for the unloaded compost is 1.5 (5980:4140). Minerals analyzed from the manure and unloaded compost showed variability between samples collected on the different dates, but all measured concentrations of calcium, magnesium, sodium, iron, aluminum, manganese, copper, and zinc were within acceptable ranges. The nearly 30% decrease in moisture content over the composting period was measured, this is of interest as the compost process is optimal at 50% moisture content with a workable range from 40-60%. When moisture reaches 35% or less the material is suitable for screening when producing a product for landscape or horticultural uses. In addition, microbial decomposition (metabolic) activity decreases substantially resulting in insufficient metabolically generated heat within the compost mass. The TKN and C:N data indicate a substantial reduction in N during the compost process. We inquired with Waypoint about data reporting errors as the N values seemed surprisingly low. They had already disposed of the samples so they were not able to rerun the test. They did offer to retest and we may have them run the data points again. If the N data is correct, then a substantial amount of N would have been lost to the air as ammonia. In contrast, two of the three P values were higher in the compost than in the raw manure.  There may be several explanations for this trend. One point of interest as the bedding reuse continues is the accumulation of P in the compost product.

Dairy Dry Pack Manure

Penn State Labs performed the lab analysis of the raw manure and compost samples on 8/7/17. The lab samples were stored at Michael Calkin’s refrigerator and shipped to Penn State. Two samples were taken at the load and unload ends of the vessel each week and combined into a single grab sample.  Ammonia and Organic N were analyzed as well as P, extractable P and carbon. Because Glamor View is operated as a batch system, the initial sample on 5/28/17 represents the raw manure at both the load and unload ends of the vessel. Each subsequent lab analysis shows the weekly change in N or P as the manure turns into compost as shown below (Fig. 6 – 8).  

Figure 6. Nitrogen levels of dry pack manure before and after composting.
Figure 7. P2O5 levels of dry pack manure before and after composting.
Figure 8. Water extractable phosphorus levels before and after composting.

Winter 2017

The nutrient levels showed no clear trend of diminishment during the 3 weeks of monitoring as shown in Table 1. The average N actually increased which seems highly unlikely given ammonia losses typically experienced during composting. The good news is that it has reasonable fertilizer value when compared to typical composts. The average P2O5 levels were unchanged during the 3-week sampling also. The water extractable P showed a slight downward trend but once again the data was scattered. The only conclusion we can make from the data is that more P was liberated during the thermophilic phase of composting than was bound up by bacterial bodies.  In retrospect, additional water extractable samples should have been performed on the cured compost to see how much water extractable P is in the product immediately before the compost is applied to fields or gardens.

Table 1. Lab Analysis of Bedded Horse Manure Before and After Three Weeks of Composting
Average results for Compost Feedstock Loaded into the Earth Flow unit at

Days End Farm in

December 2015

Average results for Compost Unloaded from Earth Flow unit at

Days End Farm in

December 2015

TEST Dec 2015 Summary (%) Average result-Dec 2015 (mg/Kg) TESTα Dec 2015 Summary (%) Average result-Dec 2015 (mg/Kg)
As Received Dry basis
Nitrogen, N % 0.39 0.95
Ammonical-N % 0.07 0.16 Total Kjeldahl Nitrogen 1.12 11200.00
Phosphorus, P % 0.10 0.23 Total Phosphorus 0.33 3346.67
Potassium, K % 0.36 0.87 Total Potassium 1.10 11033.33
Sulfur, S % 0.06 0.14 Total Sulfur 0.19 1923.33*
Magnesium, Mg % 0.13 0.32 Total Magnesium 0.38 3760.00*
Calcium, Ca % 1.76 4.53 Total Calcium 2.35 23466.67*
Sodium, Na ppm 602.00 1480.00 Total Sodium 0.18 1773.33*
Iron, Fe ppm 889.00 2173.33 Total Iron 4310.00*
Aluminum, Al ppm 368.33 873.00 Total Aluminum 3500.00*
Manganese, Mn ppm 93.07 230.00 Total Manganese 278.67*
Copper, Cu ppm 8.05 19.77 Total Copper 26.33*
Zinc, Zn ppm 33.60 82.93 Total Zinc 91.33*
Boron, B ppm 2.50 6.12 Total Volatile Solids 78.14 781400.00
Test Result Result
Moisture % 59.5 Moisture † 31.46 Moisture †
Solid % 40.5 Total Solids † 68.54 685366.67
Additional Tests Result
P2O5 (as received) , % 16.41 C/N RATIO † 40.67
K2O (as received) , % 0.428 Carbon (TOC) † 45.43 454333.33
αAll values are on a dry weight basis, except as noted by†; Detection limit on all N series is on a wet basis.

*Within normal range, Analyses by Waypoint Laboratories, Richmond, VA

Figure 9. Nitrogen levels of dry pack manure before and after composting.
Figure 10. P2O5 levels of dry pack manure before and after composting.
Figure 11. Water extractable phosphorus levels before and after composting.

Spring 2017

Unlike the last sampling event over the winter, the nutrient levels showed a clear trend of diminishment during the 3 weeks of monitoring as shown in Fig. 9-11.  The average N reduced by 30% or more during the three weeks of composting. The average P2O5 levels showed a downward trend on the unload and unchanged on the load end which is expected given that P is not lost in the compost process.  The water extractable P had a clear downward trend for both the load and unload ends of the vessel with an average 42% reduction over the 3 weeks. Water extractable P is more important than a reduction in the P2O5 levels as it indicates the amount of P available for leaching.  In general, the lab data supported the trends that are typical of composting. It is not clear if the change over the winter results were seasonal or if the sampling methods were inconsistent. One possibility is the change in feed type that the heifers receive in the summer vs winter.  In retrospect, additional water extractable samples should have been performed on the cured compost to see how much water extractable P is in the product immediately before the compost is applied to fields or gardens. This sampling would have provided a more complete picture of the entire compost process for nutrient management.   

Next Steps

There is no doubt that P chemistry and bioavailability are complicated subjects.  Based on this work and studies done by Larry Sikora at USDA and John Spargo there needs to be a more comprehensive study performed with greater control of variables to demonstrate what might actually happen in the field with P availability and losses in compost. The other effort GMT is involved in is the development of a compost feedstock recipe calculator that includes values for different feedstock P concentrations and also performs C/P ratio calculations (Fig. 12).  The calculator has an interactive dial format that immediately shows the user how the volumes of different feedstocks changes not only C/N but C/P ratios as shown below. The hope is that the software will raise awareness about P and help to make compost products with balanced nutrient ratios.

Figure 12. User interface for Compost Calc recipe calculating software.

Authors

Michael Bryan-Brown, Green Mountain Technologies, mbb@compostingtechnology.com


The authors are solely responsible for the content of these proceedings. The technical information does not necessarily reflect the official position of the sponsoring agencies or institutions represented by planning committee members, and inclusion and distribution herein does not constitute an endorsement of views expressed by the same. Printed materials included herein are not refereed publications. Citations should appear as follows. EXAMPLE: Authors. 2019. Title of presentation. Waste to Worth. Minneapolis, MN. April 22-26, 2019. URL of this page. Accessed on: today’s date.

Existing Data on Long Term Manure Storages, Opportunities to Assist Decision Makers

Long-term manure storages on dairy farms are temporary containment structures for byproducts of milk production. Manure, milkhouse wash, bedding, leachate, and runoff are stored until they can be utilized as fertilizer, bedding, irrigation, or energy. The practice of long-term storage creates stakeholders who collect data in their interactions with storages. This presents an opportunity to support data driven  decision making on best use and operation of storages.

What Did We Do?

Prevalent stakeholders who collected data on storages were identified and the information they collected was examined. Data that could assist in depicting storage infrastructure was retained. Data not collected but of value to decision makers was noted. From this a combined data set was proposed that could depict the size, state, and impact of storage infrastructure. The feasibility of such a combined data set and opportunities from it were considered.

What Have We Learned?

General volume, general configuration, and year installed are most often collected by stakeholders while detailed configuration and detailed waste type are rarely collected. Cost is not collected. (Table 1) Stakeholders do not collect data on operations of all sizes. Most data is collected on large and medium operations while data is rarely collected on small operations. Stakeholders use their own definitions and classification structures.

Table 1 Combined data to be collected to assist decision makers
Data Specificity Currently collected by
Location County State, NRCS, CNMP
City STATE, CNMP
Address STATE, CNMP
Lat, Long NONE
Storage Volume Total STATE, NRCS, CNMP
Operational STATE, CNMP
Geometric Dimensions STATE, CNMP
Above/Below Ground STATE, NRCS, CNMP
Year Built Year Built STATE, NRCS, CNMP
Year Inspected STATE, CNMP
Year Recertified STATE, CNMP
Year Upgraded STATE, CNMP
Configuration Liner (Dug,Clay,Plastic,Concrete,Steel) STATE, NRCS, CNMP
Certification(313,PE,ACI318,ACI350) STATE, NRCS, CNMP
Cover(none, rain, gas) STATE, NRCS, CNMP
Waste Volume Produced STATE, CNMP
Type(manure,washwater,leachate,runoff) STATE, CNMP
Manure Type(liquid, stack, pack, liquid sand, liquid recycled) CNMP
Advanced Treatment CNMP
Costs Total NONE
Per Component NONE
Operational NONE
*STATE-State of Michigan

*NRCS-United States Department of Agriculture Natural Resources Conservation Service

Table 2 First level characterization
Parameter
Number
Location
Age
Total Stored Capacity
Precipitation Stored Capacity
Waste Stored Capacity
Produced Waste Volume
Produced Waste Type
Produced Manure Volume
Produced Manure Type
Liner Type
Cover Type
Certification Type

A first level characterization of storage infrastructure is proposed from Table 1, Table 2. Items in the first level characterization depict the location and condition of the storage infrastructure. Each of these items may be represented over a specific geographic area, such as state, watershed, or county. In a yearly inventory each of these items may be represented over time.  

Table 3 Second level characterization
Parameter
Length of Storage Estimate
Proximity to Sensitive Area Estimate
Storage Density
Seepage Estimate
Emissions Estimate

Using Table 2 a second level characterization is proposed, Table 3. Items in the second level characterization estimate the capacity and impact of the state’s storage infrastructure. Supplementary information to estimate certain parameters is required.  Each of these items may be represented over time and specific geographic area. Cost to implement and operate storage infrastructure are the third characterization, Table 4. Each of these items may be represented over time and specific geographic area.

Table 4 Cost characterization
Parameter
Cost Estimate
Implement, Per Volume
Per Configuration
Operate, Per Volume
Per Configuration

Combining and characterizing data from different stakeholders can provide a data-driven representation of storage infrastructure. Condition, capability, and impact of the storage infrastructure can be represented over time and geographic area. Monitoring, evaluating actions, forecasting issues, and targeting priority areas1 is made feasible.  Example opportunities are as follows.

Long-term storage is desirable to enable storage of manure during winter months. Combined data can provide feedback on average days of storage in the state or watershed. The cost to achieve target days of storage may be estimated and the days of storage may be tracked over time as a result of funding efforts.

New York State released $50 million for water quality funding, which assisted in the implementation of new storages. In the implementation of these storages opportunity exits to collect cost data to inform future funding levels, quantify the increase in long-term storage provided as a result of the funding, and forecast when these storages are projected to reach the end of their lifecycle2.   

As interest in cover and flare storages increase to offset livestock emissions combined data sets can assist in evaluating feasibility of such a proposal3 4 5. Potential emissions to be captured and cost to implement can be estimated.  

Obstacles to collecting and combining data are cost, insufficiency, and misuse. As specificity in the data to be collected increases so does the cost to collect, combine, and maintain. Additionally, stakeholders have existing data collection infrastructure that must be modified at cost to allow combination. If the combined data set is not sufficiently populated by stakeholders is will depict an inaccurate representation of storage infrastructure. Finally, the risk of misuse and conflict amongst decision makers is present. Stakeholders may purposely or inadvertently use the inventory to reach erroneous conclusions.  

Future Plans

Obstacles to implementation are not insignificant. Detailed analysis is required to determine the exact data to be collected, definitions to be agreed upon, and extent of coverage such that maximum benefit will be derived for decision makers.

Full benefit of storage data is increased by additional data sets such as state-wide livestock numbers, precipitation and temperature distributions, surface water locations, ground water levels, populations center locations, well locations, shallow bedrock locations, karst locations, complaint locations, and operator violations locations. The feasibility of obtaining these data sets should be determined.

The implementation and use of storages has additional stakeholders outside of those identified here. Additional stakeholders should be identified that can enhance or derive value from a combined data set on long term storages, such as manure applicators, handling and advanced treatment industry, extension services, zoning officials, professional engineers, environmental groups, and contractors.

Authors

Corresponding author

Michael Krcmarik, P.E., Area Engineer, United States Department of Agriculture Natural Resources Conservation Service, Flint, Michigan

Michael.Krcmarik@usda.gov

Other authors

Sue Reamer, Environmental Engineer, United States Department of Agriculture Natural Resources   Conservation Service, East Lansing, Michigan

Additional Information

    1. “Conservation Effects Assessment Project (CEAP).” Ceap-Nrcs.opendata.arcgis.com, ceap-nrcs.opendata.arcgis.com/.
    2. $50 Million in Water Quality Funding Available for NY Livestock Farms.” Manure Manager, 27 Sept. 2017, www.manuremanager.com/state/$50-million-in-water-quality-funding-available-for-ny-livestock-farms-30286.
    3. Wright, Peter, and Curt Gooch. “ASABE Annual International Meeting.” Estimating the Economic Value of the Greenhouse Gas Reductions Associated with Dairy Manure Anaerobic Digestions Systems Located in New York State Treating Dairy Manure, July 16-19 2017.
    4. Wightman, J. L., and P. B. Woodbury. 2016. New York Dairy Manure Management Greenhouse Gas Emissions and Mitigation Costs (1992–2022). J. Environ. Qual. 45:266-275. doi:10.2134/jeq2014.06.0269
    5. Barnes, Greg. “Smithfield Announces Plans to Cover Hog Lagoons, Produce Renewable Energy.” North Carolina Health News, 28 Oct. 2018, www.northcarolinahealthnews.org/2018/10/29/smithfield-announces-plans-to-cover-hog-lagoons-produce-renewable-energy/.
    6. Michigan Agriculture Environmental Assurance Program. MAEAP Guidance Document For Comprehensive Nutrient Management Plans. 2015,www.maeap.org/uploads/files/Livestock/MAEAP_CNMP_Guidance_document_April_20_2015.pdf.

The authors are solely responsible for the content of these proceedings. The technical information does not necessarily reflect the official position of the sponsoring agencies or institutions represented by planning committee members, and inclusion and distribution herein does not constitute an endorsement of views expressed by the same. Printed materials included herein are not refereed publications. Citations should appear as follows. EXAMPLE: Authors. 2019. Title of presentation. Waste to Worth. Minneapolis, MN. April 22-26, 2019. URL of this page. Accessed on: today’s date.

Preliminary Study of Sand Settling Lane Designs and Performance

Sand settling lanes are increasing in popularity as a solution for reclaiming sand from the waste stream of dairy facilities.  The purpose of this study was to determine:

    • Whether sand settling systems are functioning properly for Illinois dairy facilities.
    • Whether they meet the criteria in NRCS Conservation Practice Standard (CPS) 632 – Waste Separation Facility.
    • Operation and Maintenance (O&M) criteria needed to make sand settling lane systems function properly for these and future designs.
    • Critical criteria for designing sand settling lanes.

What Did We Do?

Five sites with sand settling lanes of different designs were reviewed in Fall, 2016.  All of the sites were dairy facilities with flush systems to remove manure from confinement buildings.  All of the sites used sand from the same geographical region in Southern Illinois. Each site had a different company delivering the sand, but it appeared that some of these sites received sand from the same source.   

Measurements of the parameters that affect the functionality of the sand settling lane were taken.  One important parameter is the type of flush system used on site. A high velocity flush (HVF) system typically has wave velocity 7.5 feet per second (fps).  A low velocity flush (LVF) system has wave velocity about 3 fps. HVF systems usually have a contact time of less than 1 minute while LVF systems typically have a contact time of 10 minutes or longer.

Basic measurements were made at all five sites:  critical elevations of the confinement building flush alley, transition area (where applicable) and sand settling lane, along with lengths and widths of all of these areas.  At each site, a single flush alley was selected for testing the total flush time and the travel time for the leading wave of flush water, for the flush alley, the transition area, and the sand settling lane.  From these measurements, the velocity, flow rate, total flush volume, and surface roughness coefficient (Manning’s n) were calculated for each flush alley.  We also calculated the particle diameter of sand that would settle and estimated the sand recovery performance of the system.    

Calculating the velocity and flow rate for the sand lane was challenging because of the variability in flow depth.  The amount of sand deposition in the lane affected the flow characteristics (not only flow depth, but also slope and roughness coefficient), and varied depending on the location in the lane.  More sand was deposited at the end of the sand lane than the beginning. In cases where the settling lane had not been scraped prior to the test, it was necessary to estimate an effective slope and flow depth based on the sand deposits.  In future measurements, it will be important to measure the extent of sand deposition and depth.

The table below presents some key factors determined for the five sites studied:

Parameter

Site

1

2

3

4

5

Type of flush system (HVF or LVF)

HVF

HVF

HVF

LVF

LVF

Flush alley velocity (fps)

5.4

5.9

*4.6

3.3

3.2

Lane velocity  (fps)

3.2

2.4

2.7

2.5

**3.2

Hydraulic retention time in the sand lane (minute)

2.6

9

*

4.8

**

Manning’s n of sand lane

0.011

0.010

0.007

0.012

**0.017

Producer estimated sand recovery

90%

80% (?)

*

75%

90%

* Site 3 did not contain the entire flush within the alley, so the flush took a very long time to reach the sand lane.  The system was very new and still being fine-tuned.

** Site 5 performed as a settling basin rather than a sand lane, due to inadequate outlet conditions.

The current NRCS CPS 632 requires that the sand lanes be designed for a flow velocity between 1-2 fps, for adequate sand separation.  None of the sites visited met this criterion in the as-built and operated condition. The Standard also requires a hydraulic retention time between 3-5 minutes, which only one of the sites met.  However, some were removing sand satisfactorily; likely due to the gradation being supplied as bedding.

What Have We Learned?

Although some of the factors measured and studied in this analysis were inconclusive, a number of observations and recommendations can be made.

  1. A sand gradation curve should be a requirement for the design; the flow velocity and hydraulic retention time must be adjusted according to sand size and distribution.  This will also allow the designer to predict the sand recovery amounts and thus properly design the storage space for the reclaimed sand.
  2. Better record keeping of actual sand removal from the sand lane is recommended.  Most of the producers stated that they are reclaiming over 80% of the sand, but the piles on site do not suggest that for some producers.  Keeping records would allow them to determine if their operating procedures need to be adjusted.
  3. Better O&M instructions are needed for sand lane systems.  Every producer stated that they do not have or do not know of any O&M instructions for their system; yet this is critical for this type of system to work effectively.  Instructions would assist the producer with fine tuning the system by providing benchmarks to help determine if the system is working properly. Items in the O&M should be:
    • Design flush information, including total flush volume and flush time.  This could be broken down to where all the producer needs to do is measure the time of either the pump filling the tank and/or of the flush to determine if the system is working properly.
    • Allowable removal of liquid waste from the storage facility that supplies the flush liquid.  Instructions should include the lowest allowable liquid level for the liquid waste storages so that the flush water removed will be clean enough for the job.
    • Regular cleaning of the sand lane: this should occur daily or at a minimum once every two days.   If not, the design should account for the difference in slope and roughness coefficient caused by the accumulation of sand in the sand lane.
  4. If a pipe is used as a channel to move material from the flush alley to the sand lane, the velocity needs to be over 5 fps (preferably closer to 8 fps) so that sand does not settle out in the pipeline.  The problem is that when the velocity is that high in the pipeline, it is difficult for the velocity to be slowed to the required speed for the sand lane (1 -2 fps). A plunge pool, extension of the sand lane or other structure is needed to dissipate the energy of the flush water from the pipe before it enters the sand lane.
  5. A more realistic design Manning’s roughness coefficient (n) needs to be used for the concrete of the sand settling lane.  The designs for these sand lanes all included a Manning’s roughness coefficient of 0.015 to 0.017, but when this coefficient was calculated using the actual data collected on the four sites that were operating as sand lanes, the coefficient was much lower: about 0.012 for all of the sites.  This difference in the coefficient does not seem like much but it is significant. If all the other factors are the same but the roughness coefficient is 0.012 instead of 0.015, the velocity for a typical sand lane would change from 3.2 fps (for n = 0.012) to 2.6 fps (n = 0.015).  This 20% change in velocity makes a significant difference in the appropriate length and slope needed for the sand lane to meet the velocity criterion between 1 and 2 fps and actually settle out enough sand to make the sand lane worthwhile.  Using a larger Manning’s roughness coefficient would allow the designer to make the sand lane shorter and/or steeper, but if the larger coefficient is not realized in the as-built condition, performance will suffer.
  6. The design of the outlet from the sand lane to the receiving storage needs to be sized large enough to pass the expected flow without significantly backing up into the sand lane, unless an analysis is done to account for the backup.  Although the ponded water does allow for more sand deposition, it also significantly changes the hydraulic grade of the sand lane, increasing the hydraulic retention time above the allowable limit in the criteria of CPS 632, and affecting performance.

Future Plans

More extensive research is needed on this subject, to confirm the findings of this case study.  More accurate readings should be conducted at these or other sites with fully functioning sand settling lanes using devices that would be more precise than stopwatch recordings.    

Authors

Matt Robert, Agricultural Engineer, USDA-NRCS – Illinois

Matthew.Robert@usda.gov

Ruth Book, State Conservation Engineer, USDA-NRCS – Illinois

Ruth.Book@usda.gov

Additional Information

“Handling Sand-Laden Manure” by J.P. Harner and J.P. Murphy.  Proceedings of the 5th Western Dairy Management Conference.  Las Vegas, NV. April 4-6, 2001. Pp 47-56.  http://wdmc.org/2001/WDMC2001p047-56.pdf

NRCS National Handbook of Conservation Practices, Conservation Practice Standard– Waste Separation Facility, Code 632.  https://www.nrcs.usda.gov/wps/portal/nrcs/detailfull/national/technical/cp/ncps/?cid=nrcs143_026849

Acknowledgements

The authors would like to thank the dairy producers at each of the five Illinois sites for allowing NRCS to study the performance of their sand settling lanes.  


Videos, Slideshows and other media


sand lane
Figure 1. Sand settling lane after a flush, showing accumulated sand.  This picture is taken from the beginning of the sand lane. On each side of the sand lane is a concrete waste storage.  An opening for each concrete waste storage is located at the end of the sand lane. Flush water will enter only one storage since one of the openings is always covered.


sandlane
Figure 2. Sand Lane and concrete waste storage.  The flush water from the sand lane enters the waste storage.  Additional solids settle out in the storage while liquid is pumped to an earthen storage for land application or reused for flush water.

Check out this link to see three videos of a dairy flush system, with sand settling lane and concrete waste storage.

The authors are solely responsible for the content of these proceedings. The technical information does not necessarily reflect the official position of the sponsoring agencies or institutions represented by planning committee members, and inclusion and distribution herein does not constitute an endorsement of views expressed by the same. Printed materials included herein are not refereed publications. Citations should appear as follows. EXAMPLE: Authors. 2019. Title of presentation. Waste to Worth. Minneapolis, MN. April 22-26, 2019. URL of this page. Accessed on: today’s date.

Updating manure N and P credits: A growth chamber study

For a long time, farmers have realized the benefits of using manure as a nutrient source.  The ratio of various nutrients in manure, however, rarely matches the exact plant needs. Consequently, farmers must choose between overapplying some nutrients, or underapplying others and meeting the remaining needs with commercial fertilizers. Figuring out nitrogen (N) credits can be a difficult task since the total amount of N found in manure is not fully available the year of application, nor even after the second year of application. In addition, understanding P availability in manure is necessary because excess P can ultimately lead to eutrophication of surface waters. The amount of N that is available will depend on several factors such as animal species, bedding (if any), manure storage, and application method. We assume approximately 80% of the total manure P is available the first year, but even this can vary depending on soil texture, manure chemistry, and weather conditions. Current University of Minnesota recommendations help determine N and P credits for a variety of manures (Hernandez and Schmitt 2012). These recommendations were developed several decades ago and need an update since the diets of animals, storage of manures, and manure application equipment have changed over the years. Therefore, the primary purpose of this study is to estimate N and P mineralization from a variety of manures and soil types across different temperature regime. Our goal is to verify and/or update N and P credit recommendations from manure so that farmers are able to make better decisions when purchasing and applying commercial fertilizers in following years.  

What did we do?

Laboratory incubations were used to assess N and P release characteristics from a variety of manures in several different soil types. The incubation studies were a complete factorial with 4 replications and with manure type, soil type, and temperature as the main factors. We also included a control treatment that did not include any manure application to see how much nitrogen and phosphorus mineralized from the soils themselves. We tested 8 manures, including: dairy liquid (separated and raw [non-separated]), swine liquid (from a finishing house and a sow barn), beef manure (solid bedded pack and liquid from a deep pit), and poultry (turkey litter and chicken layer manure). Manure analyses to determine nutrient content were conducted on all samples prior to incubations. Soils for the incubations included a coarse textured soil from the Sand Plain Research Center at Becker, MN; a medium textured soil from a research field near Rochester, MN; and a fine textured soil from the West Central Research and Outreach Center in Morris, MN. Soils were collected from the top six inches of soil at each location in bulk and then air dried, ground down to pass a 2-mm sieve, and analyzed for nutrient and organic matter content.  

One liter clear glass canning jars were filled with 200 g of sieved soil and were kept at 60% of field capacity which was maintained by weighing every 4-6 days and adding deionized water as needed to replace the weight lost. We used the University of Minnesota guidelines and manure analysis results to calculate the appropriate application rate for each manure type. During the incubation study, the temperature inside the incubator was kept at either 25⁰C (77⁰F). We collected subsamples at 0, 7, 14, 28, and 56 days after the experiment had begun. Subsamples were destructively analyzed for potassium chloride extractable ammonium and nitrate and Bray-1 or Olsen extractable phosphate. Figure 1 shows the schematics of our experimental set-up and components.  

Figure 1: Growth chamber incubation study experimental set-up.

What have we learned?

At the time of writing, the experiment has only been run at one temperature, 25⁰C (77⁰F) and subsamples for days 0-28 have been collected. Ammonium and nitrate have been analyzed for subsamples for days 0-14. The remaining treatments will be completed later in 2019. Statistical analyses have not been conducted at this time.

The results of the initial soil and manure tests can be found in Tables 1 and 2, respectively. This will give an idea of the starting conditions of the soils and manures. For visual reference, Figure 2 shows the inorganic N (ammonium + nitrate) from each treatment from days 0-14 for the incubation at 25⁰C. The control samples showed that more inorganic N was present in the medium textured soil than the other soils. In general, the swine manure from both finisher and sow barns released the most inorganic N compared with other manures. Of the beef manures, the liquid deep pit manure tended to release more inorganic N than the bedded pack manure, likely due to the lack of bedding to tie up nitrogen. Of the dairy manures, the raw and liquid separated tended to release inorganic N similarly, except in the medium textured soil where the liquid separated manure released more inorganic N. Across soil types, the inorganic N release tended to be stable in the coarse textured soil, while in the medium and fine textured soil, it appears to have increased initially then slowly decreased. It is unclear why this may have happened but could be due to volatilization of ammonium, denitrification of nitrate, or immobilization of N into organic forms. More tests are needed and will be completed later in 2019.

Table 1. Initial characteristics of three soil types used in this study: coarse textured soil from Becker, MN; medium textured soil from Rochester, MN; and a fine-textured soil from Morris, MN.
Soil Characteristics Soil Textural Class
Coarse Medium Fine
Organic matter (%) 1.1 1.0 3.3
pH 5.1 5.2 7.9
Phosphorus – Olsen (ppm) 11 8 7
Potassium (ppm) 95 101 140
Magnesium (ppm) 42 49 570
Calcium (ppm) 274 310 3482
Ammonium (ppm) 3.4 2.8 8.6
Nitrate (lb/acre) 3.0 2.5 8.5
Table 2. Initial characteristics of eight manure types used in this study. The units of nutrients are in pounds per ton for solid manure and in pounds per 1000 gallons for liquid manure.
Species Type Manure Type Moisture Total N Ammonium-N Total P (as P2O5) Total K (as K2O) C:N Ratio
(%) (lbs per unit) (lbs per unit) (lbs per unit) (lbs per unit)
Beef Bedded Pack, Solid 60.5 13.43 2.37 9.59 18.01 22:1
Deep Pit, Liquid 86.6 56.72 36.7 23.43 30.83 9:1
Dairy Separated, Liquid 93.2 32.7 15.8 13.31 29.26 7:1
Raw, Liquid 88.9 33.17 15.66 13.08 31.29 13:1
Swine Finisher, Liquid 86.8 59.16 41.63 37.63 27.35 9:1
Sow, Liquid 99.3 16.5 15.69 1.38 11.34 1:1
Poultry Chicken Layer, Solid 48.6 55.51 14.39 35.78 25.91 7:1
Turkey Litter, Solid 53.0 28.2 13.16 26.69 28.65 12:1
Figure 2. The amount of inorganic-N (the sum of ammonium-N + nitrate-N) in soil mixed with various manure types in: a. coarse textured soil from Becker, MN; b. medium textured soil from Rochester, MN; and c. fine textured soil from Morris, MN.

Future plans

We plan to analyze all the 25 °C samples for nitrogen and phosphorus as well as samples from experiment at 15 and 5 °C this year. We also collected ammonia (NH3) gas samples from the headspace of each jars. We plan to analyze these samples to understand the effects of manure application on ammonia volatilization losses. In addition, on a separate set of experiments we deployed anion and cation exchange resins in each jar. These resins were replaced each week on average. We plan to extract these resins for N and P.

Authors

Dr. Suresh Niraula

Postdoctoral Associate

Department of Soil, Water, and Climate

University of Minnesota (sniraula@umn.edu)


Dr. Melissa Wilson

Assistant Professor and Extension Specialist

Manure Management & Water Quality

Department of Soil, Water, and Climate

University of Minnesota

(Corresponding author email: mlw@umn.edu)

Acknowledgements

This material is based on work that is supported by the Sugarbeet Research and Education Board of Minnesota and North Dakota as well as the Agricultural Fertilizer Research and Education Council of Minnesota.

Additional information

Hernandez JA, Schmitt MA. 2012. Manure management in Minnesota. Saint Paul (MN): University of Minnesota Extension [accessed 24 Nov 2017].

Pagliari PH, Laboski CAM. 2014. Effects of manure inorganic and enzymatically hydrolyzable phosphorus on soil test phosphorus. Soil Soc. of Am. J. 78(4): 1301-1309.

Russelle MP, Blanchet KM, Randall GW, Everett LA. 2009. Characteristics and nitrogen value of stratified bedded pack dairy manure. Crop Management 8(1). https://dl.sciencesocieties.org/ publications/cm/abstracts/8/1/2009-0717-01-RS.

The authors are solely responsible for the content of these proceedings. The technical information does not necessarily reflect the official position of the sponsoring agencies or institutions represented by planning committee members, and inclusion and distribution herein does not constitute an endorsement of views expressed by the same. Printed materials included herein are not refereed publications. Citations should appear as follows. EXAMPLE: Authors. 2019. Title of presentation. Waste to Worth. Minneapolis, MN. April 22-26, 2019. URL of this page. Accessed on: today’s date.

Predicting Manure Nitrogen and Phosphorus Characteristics of Beef Open Lot Systems

This project involves the analysis of a new data set for manure characteristics from open lot beef systems demonstrating both average characteristics and factors contribution to variability in manure characteristics among these systems. Defining the characteristics and quantities of harvested manure and runoff from open earthen lot animal systems is critical to planning storage requirements, land requirements for nutrient utilization, land application rates, and logistical issues, such as equipment and labor requirements. Accuracy of these estimates are critical to planning processes required by federal and state permitting programs. Poor estimates can lead to discharges that result in court action and fines, neighbor nuisance complaints, and surface and ground water degradation. Planning procedures have historically relied upon standard values published by NRCS (Stettler et al., 2008), MWPS (Lorimor et al., 2000), and ASABE (2014) for average characteristics.

What Did We Do?

A large data set of analyses from manure samples collected over a 15-year period from 444 independent cattle feedlot pens at a single eastern Nebraska research facility was reviewed to provide insight to the degree of variability in observed manure characteristics and to investigate the factors influencing this variability. No previous efforts to define these characteristics have included data gathered over such a wide range of dietary strategies and weather conditions. This exclusive research data set is expected to provide new insights regarding influential factors affecting characteristics of manure and runoff harvested from open lot beef systems. The objective of this paper is to share a preliminary summary of findings based upon a review of this data set.

What Have We Learned?

A review of this unique data set reveals several important preliminary observations. Standard values reported by ASABE and MWPS for beef manure characteristics in open lot systems are relatively poor indicators of the significant variability that is observed within open lot feeding systems. Our data set reveals significant differences between manure characteristics as a function of feeding period (Table 1) and substantial variability within feeding period, as illustrated by the large coefficients of variation for individual characteristics. Differences in winter and summer conditions influence the characteristics and quantities of solids, organic matter, and nutrients in the harvested manure. The timing of the feeding period has substantial influence on observed differences in nitrogen loss and nitrogen in manure (Figure 1). Nitrogen recovery for the warmer summer feeding periods averaged 51 and 6 grams/head/day in the manure and runoff, respectively, with losses estimated to be 155 grams/head/day.  Similarly, nitrogen recovery in manure and runoff for the winter feeding period was 90 and 4 grams/head/day, respectively, with losses estimated at 92 grams/head/day (Figure 1 and Koelsch, et al., 2018). In addition, differences in weather and pen conditions during and following winter and summer feeding periods impact manure moisture content and the mixing of inorganics with manure (Table 1).

Table 1. Characteristics of manure collected from 216 and 228 cattle feedlot pens during Summer and Winter feeding periods, respectively1.
University of Nebraska Feedlot in East Central Nebraska Standard Values
Summer Winter ASABE NRCS MWPS3
Mean CV2 Mean CV2 Mean Mean
Total Manure (wet basis), kg/hd/d 9.3 99% 13.1 43% 7.5 7.9
DM    % 71% 10% 63.2% 15% 67% Collected 55%
    kg/hd/d 5.4 80% 8.0 41% 5.0 manure 4.3
OM    % 24% 28% 25.3% 41% 30% is not 50%
    kg/hd/d 1.00 52% 1.87 41% 1.5 reported. 2.2
Ash    % 76% 9% 74.7% 14% 70% 50%
    kg/hd/d 4.16 72% 6.10 49% 3.5 2.2
N    % 1.3% 36% 1.19% 23% 1.18% 1.2%
    g/hd/d 51 50% 90 33% 88 95
P    % 0.37% 41% 0.34% 29% 0.50% 0.35%
    k/hd/d 17.7 55% 26.0 42% 37.5 27.7
DM = dry matter; OM = organic matter (or volatile solids)

1    Summer = April to October feeding period, Winter = November to May feeding period

2    Coefficient of variation, %

3    Unsurfaced lot in dry climate with annual manure removal.

two pie charts
Figure 1. Distribution of dietary nitrogen consumed by beef cattle among four possible ed points for summer and winter feeding periods.

Dietary concentration of nutrients was observed to influence the harvested manure P content (Figure 2) but produce minimal impact on harvested manure N content (not shown). Diet was an important predictor in observed N losses, especially during the summer feeding period. However, its limited value for predicting harvested manure N and moderate value for predicting harvesting manure P suggests that other factors such as weather and management may be influential in determining N and P recovered (Koelsch, et al., 2018).

scatter plot with trendlines
Figure 2. Influence of dietary P concentration on harvested manure P.

Significant variability exists in the quantity of total solids of manure harvested with a factor of 10 difference between the observed low and high values when compared on a mass per finished head basis (note large CVs in Table 1). This variability has significant influence on quality of the manure collected as represented by organic matter, ash content, and moisture content.

Although individual experimental trials comparing practices to increase organic matter on the feedlot surface have demonstrated some benefit to reducing nitrogen losses, the overall data set does not demonstrate value from higher pen surface organic matter for conservation of N in the manure (Koelsch, et al., 2018). However, higher organic matter manure is correlated to improved nitrogen concentration in the manure suggesting a higher value for the manure (Figure 3).

scatter plot with trendlines
Figure 3. Influence of pen surface organic matter measured as organic matter in the harvested manure) on nitrogen concentration in the manure.

It is typically recommended that manure management planning should be based upon unique analysis for manure characteristics representative of the manure being applied.  The large variability in harvested manure from open lot beef systems observed in this study further confirms the importance of this recommendation. The influence of weather on the manure and the management challenges of collecting manure from these systems adds to the complexity of predicting manure characteristics.  In addition, standard reporting methods such as ASABE should consider reporting of separate standard values based upon time of the year feeding and/or manure collection period. This review of beef manure characteristics over a 15 year period further documents the challenge of planning based upon typical or standard value for open lot beef manure.

Future Plans

The compilation and analysis of the manure and runoff data from these 444 independent measure of feedlot manure characteristics is a part of an undergraduate student research experience. Final review and analysis of this data will be completed by summer 2019 with the data published at a later time. The authors will explore the value of this data for adjusting beef manure characteristics for ASABE’s Standard (ASABE, 2014).

References

ASABE. 2014.  ASAE D384.2 MAR2005 (R2014):  Manure Production and Characteristics. ASABE, St. Joseph, Ml. 32 pages.

Koelsch, R. , G. Erickson2, M. Homolka2, M. Luebbe. 2018. redicting Manure Nitrogen, Phosphorus, and Carbon Characteristics of Beef Open Lot Systems. Presented at the 2018 ASABE Annual International Meeting. 15 pages.

Lorimor, J., W. Powers, and A. Sutton. 2000. Manure characteristics. Manure Management Systems Series MWPS-18. Midwest Plan Service. Ames Iowa: Iowa State University.

Stettler, D., C. Zuller, D. Hickman. 2008. Agricultural Waste Characteristics.  Chapter 4 of Part 651, NRCS Agricultural Waste Management Field Handbook. pages 4-1 to 4-32.


Authors

Richard (Rick) Koelsch, Professor of Biological Systems Engineering and Animal Science, University of Nebraska-Lincoln

rkoelsch1@unl.edu

Megan Homolka, student, and Galen Erickson Professor of Animal Science, University of Nebraska-Lincoln

Additional Information

Koelsch, R. , G. Erickson2, M. Homolka2, M. Luebbe. 2018. Predicting Manure Nitrogen, Phosphorus, and Carbon Characteristics of Beef Open Lot Systems. Presented at the 2018 ASABE Annual International Meeting. 15 pages.


The authors are solely responsible for the content of these proceedings. The technical information does not necessarily reflect the official position of the sponsoring agencies or institutions represented by planning committee members, and inclusion and distribution herein does not constitute an endorsement of views expressed by the same. Printed materials included herein are not refereed publications. Citations should appear as follows. EXAMPLE: Authors. 2019. Title of presentation. Waste to Worth. Minneapolis, MN. April 22-26, 2019. URL of this page. Accessed on: today’s date.

Production of Greenhouse Gases, Ammonia, Hydrogen Sulfide, and Odorous Volatile Organic Compounds from Manure of Beef Feedlot Cattle Implanted with Anabolic Steroids

Animal production is part of a larger agricultural nutrient recycling system that includes soil, water, plants, animals and livestock excreta. When inefficient storage or utilization of nutrients occurs, parts of this cycle become overloaded. The U.S. Beef industry has made great strides in improving production efficiency with a significant emphasis on improving feed efficiency. Improved feed efficiency results in fewer excreted nutrients and volatile organic compounds (VOC) that impair environmental quality. Anabolic steroids are used to improve nutrient feed efficiency which increases nitrogen retention and reduces nitrogen excretion. This study was conducted to determine the methane (CH4), carbon dioxide (CO2), nitrous oxide (N2O), odorous VOCs, ammonia (NH3), and hydrogen sulfide (H2S) production from beef cattle manure and urine when aggressive steroid implants strategies were used instead of moderate implant strategies.

What Did We Do?

Two groups of beef steers (60 animals per group) were implanted using two levels of implants (moderate or aggressive). This was replicated three times, twice with spring-born calves and once with fall-born calves, for a total of 360 animals used during the study. Both moderate and aggressive treatment groups received the same initial implant that contain 80 mg trenbolone acetate and 16 mg estradiol. At second implant, steers in the moderate group received an implant that contained 120 mg trenbolone acetate and 24 mg estradiol, while those in the aggressive group received an implant that contained 200 mg trenbolone acetate and 20 mg estradiol. Urine and feces samples were collected individually from 60 animals that received a moderate implant and 60 animals that received an aggressive implant at each of three sampling dates (Spring and Fall 2017 and Spring 2018). Within each treatment, fresh urine and feces from five animals were mixed together to make a composite sample slurry (2:1 ratio of manure:urine) and placed in a petri dish. There were seven composite mixtures for each treatment at each sampling date. Wind tunnels were used to pull air over the petri dishes. Ammonia, carbon dioxide, and nitrous oxide concentrations were measured using an Innova 1412 Photoacoustic Gas Analyzer. Hydrogen sulfide and methane were measured using a Thermo Fisher Scientific 450i and 55i, respectively. Gas measurements were taken a minimum of six times over 24- to 27-day sampling periods.

What Have We Learned?

Flux of ammonia, hydrogen sulfide, methane, nitrous oxide, and total aromatic volatile organic compounds were significantly lower when an aggressive implant strategy was used compared to a moderate implant strategy. However, the flux of total branched-chained volatile organic compounds from the manure increased when aggressive implants were used compared to moderate implants. Overall, this study suggests that air quality may be improved when an aggressive implant is used in beef feedlot animals.

Table 1. Overall average flux of compounds from manure (urine + feces) from beef feedlot cattle implanted with a moderatea or aggressiveb anabolic steroid.
Hydrogen Sulfide Ammonia Methane Carbon Dioxide Nitrous  Oxide Total Sulfidesc Total SCFAd Total BCFAe Total Aromaticsf
µg m-2 min-1 ——–mg m-2 min-1——–
Moderate 4.0±0.1 2489.7±53.0 117.9±4.0 8795±138 8.6±0.1 0.7±0.1 65.2±6.6 5.9±0.5 2.9±0.3
Aggressive 2.7±0.2 2186.4±46.2 104.0±3.8 8055±101 7.4±0.1 0.8±0.1 63.4±5.7 7.6±0.8 2.1±0.2
P-value 0.01 0.04 0.01 0.01 0.01 0.47 0.83 0.05 0.04
aModerate treatment =  120 mg trenbolone acetate and 24 mg estradiol at second implant; bAggressive treatment = 200 mg trenbolone acetate and 20 mg estradiol at second implant; cTotal sulfides = dimethyldisulfide and dimethyltrisulfide; dTotal straight-chained fatty acids (SCFA) = acetic acid, propionic acid, butyric acid, valeric acid, hexanoic acid, and heptanoic acid;  eTotal branch-chained fatty acids (BCFA) = isobutyric acid and isovaleric acid; fTotal aromatics = phenol, 4-methylphenol, 4-ethylphenol, indole, and skatole

Future Plans
Urine and fecal samples are being evaluated to determine the concentration of steroid residues in the livestock waste and the nutrient content (nitrogen, phosphorus, potassium and sulfur) of the urine and feces.

Authors

mindy.spiehs@ars.usda.gov Mindy J. Spiehs, Research Animal Scientist, USDA ARS Meat Animal Research Center, Clay Center, NE

Bryan L. Woodbury, Agricultural Engineer, USDA ARS Meat Animal Research Center, Clay Center, NE

Kristin E. Hales, Research Animal Scientist, USDA ARS Meat Animal Research Center, Clay Center, NE

Additional Information

Will be included in Proceedings of the 2019 Annual International Meeting of the American Society of Agricultural and Biological Engineers.

USDA is an equal opportunity provider and employer. 

Acknowledgements

The authors wish to thank Alan Kruger, Todd Boman, Bobbi Stromer, Brooke Compton, John Holman, Troy Gramke and the USMARC Cattle Operations Crew for assistance with data collection.

The authors are solely responsible for the content of these proceedings. The technical information does not necessarily reflect the official position of the sponsoring agencies or institutions represented by planning committee members, and inclusion and distribution herein does not constitute an endorsement of views expressed by the same. Printed materials included herein are not refereed publications. Citations should appear as follows. EXAMPLE: Authors. 2019. Title of presentation. Waste to Worth. Minneapolis, MN. April 22-26, 2019. URL of this page. Accessed on: today’s date.

Feasibility of Reducing a Dairy Farm’s Manure Enterprise Costs Using a Wet Gasification Technology

Manure management is a major system on dairy farms, and there is a goal to minimize costs and maximize benefits. Technology that would reduce the mass of the manure to be spread, produce energy and a potential by-product for off-farm sales is needed. Adding wet gasification technology to existing manure systems with the goals of reduced spreading costs and possibly increased by-product sales was evaluated on a central New York farm that was considering expanding.  For expansion to be possible, additional cropland was needed to recycle the additional manure at a further distance from the farmstead. An economic analysis examining the potential impact the wet gasification technology would have on the farm was conducted and results were shared with the dairy producer for use in making informed decisions.

What did we do?

A wet gasification technology that was presented by the manufacturer to be able to extract energy from manure solids (also reducing mass) was evaluated to determine the potential as an improvement to the farm’s existing manure management system. Application of this technology on an example farm was investigated to see what the applications might be on the existing farm (1,500 cows and 1,590 acres) and when expanded to 2,500 cows with 2,990 acres of cropland. Current and projected farm data along with cost and performance data from the manufacturer of the gasification system were used to perform an annual economic cost-benefit analysis as a way to determine the value of the system to the farm’s manure management enterprise.

Figure 1. Example Mass and Energy Flows for a Wet Gasification System

What have we learned?

There are many variables to consider, and the results of the sensitivity analysis show that the variables that influence the outcome of the total annual economic cost-benefit analysis are the ones least under the control of the technology provider or farm (capital cost, lost capital rate, milk production change due to bedding use change, nitrogen value of fertilizer, price of electricity, and value of the ash). Annual spreading costs at the time of analysis ranged from $36/acre for close fields with a low amount of manure spread, to $256/acre for further fields spread at a high amount of manure.

For the case farm analyzed, the system economics would only be favorable if optimistic values were assumed for some of the predictor variables such as high prices for the ash by-product and/or higher prices for the excess energy produced. Raw dairy manure’s moisture content is too high for efficient gasification. Wet gasification is better suited to operations where the raw manure has lower moisture content (due to substantial bedding use) or can be pre-processed to obtain  a very dilute liquid stream (that can be spray irrigated) and a solid product, having 25-30% solids, that could be processed by gasification to produce a salable ash. The values for byproducts, energy and nutrients from manure, need to be large enough to support a manure treatment system. Dairy farms need to consider the impact of a manure treatment technology on the whole farm system.

Prices to obtain a zero economic benefit (net benefits minus costs equal $0) for the expanded 2,500-cow dairy in central NY for each variable alone.
Variable Break-Even Price Comments
Capital costs ($/Unit) $0 Wet Gasification

$0 for SLS

$1,750/kW for steam gen set

Assuming grants are available

Assuming a separator already exists

Steam gen-set is $1,750/kW

Electric Price ($/kWh) $0.156/kWh

5M kWh/yr. produced

Includes $0.03/kWh maintenance cost on engine generators. (This is renewable energy but only ~50% reduction in GHG
Hauling cost ($/load) $2,530/load

159 loads/yr. reduced

8,400 gallons/load (approximately a 420-mile round trip)
Ash Sales ($/ton) $374/ton

898 tons/yr. produced

This price includes the reduced hauling costs as the water separated from the ash can be spray irrigated without hauling.

Future Plans

We continue to evaluate manure treatment systems that have the potential to reduce the mass of the manure to be spread, produce energy, partition the nutrients, reduce greenhouse gas emissions, and a produce a potential by-product for off-farm sales and extending this knowledge to dairy operators.

Corresponding author, title, and affiliation

Peter Wright, Agricultural Engineer, Dept. of Animal Science, Cornell University

Pew2@cornell.edu

Other authors

Curt Gooch, Senior Extension Associate at Cornell University, Dept. of Animal Science, PRO-DAIRY

Additional information

Additional project information can be found on the dairy environmental system webpage: www.manuremanagement.cornell.edu.

Acknowledgements

The farm and the wet gasification technology company provided the needed data to make the economic analysis. Funding for this project was supported by Cornell’s Jumpstart program.

The authors are solely responsible for the content of these proceedings. The technical information does not necessarily reflect the official position of the sponsoring agencies or institutions represented by planning committee members, and inclusion and distribution herein does not constitute an endorsement of views expressed by the same. Printed materials included herein are not refereed publications. Citations should appear as follows. EXAMPLE: Authors. 2019. Title of presentation. Waste to Worth. Minneapolis, MN. April 22-26, 2019. URL of this page. Accessed on: today’s date.

Characterization of Nutrients and GHG Emissions from Separated Dairy Manure

This study has the objectives of characterizing dairy manure pre and post solid-liquid separation (SLS), estimating and comparing processing efficiencies between different technologies, and relating emissions to manure characteristics by using modeling tools.

What did we do?

Manure samples from nine dairy farms in southern and eastern Wisconsin were collected every two weeks. All nine farms separated manure into liquid and solid streams and seven farms used anaerobic digesters (ADs) prior to solids separation (Table 1). For all farms, manure was sampled pre-processing (untreated manure) and after any individual processing step in order to isolate the performance of each treatment unit at each farm (Figure 1). All manure samples were analyzed for total solids (TS), volatile solids (VS), total nitrogen (TN), ammonia (NH3), total phosphorus (TP), total potassium (TK) and chemical oxygen demand (COD). Separation efficiency was estimated by solving a system of two equations of separation mass balance (Equations 1 and 2) based on the concentrations of each constituent.

equations

       Where:

        • X (kg) is the constituent under evaluation (e.g. TS, NH3, etc.)
        • [  ] indicates percent concentration in the solid (solid, out), liquid (liquid, out) fractions after separation, and total before separation (total, in)
        • Manure (kg) is the manure mass in the solid (solid, out), liquid (liquid, out) fractions after separation, and total before separation (total, in)

What have we learned?

Both screw press and centrifuge technologies achieve higher separation efficiencies for TS and VS than for TN, NH3, TP, and TK, meaning that more TS and VS stay with the solids fraction. Moreover, NH3 stays almost entirely in the liquid fraction. Results indicate that centrifugation might achieve higher TP separation efficiencies than screw pressing. Greenhouse gas (GHG) emissions, were affected by the management practices used to handle the liquid and solid fractions. Methane emissions from liquid storage are reduced as a percentage of the VS stays with the solids fraction. However, nitrous oxide emissions from the separated solids might increase if separated solids are stored and not quickly land applied or transported outside of the farm for posterior use.     

Future Plans

Analysis for anaerobic digestion efficiency and pathogen inactivation will be incorporated in this study to conduct a complete assessment of manure characteristics after AD and SLS and their impact on different environmental indicators.


Table 1.  Summary of each farm’s manure management process.
Farm ID

AD

SLS

Feedstock

1

Mixed plug flow

Screw press

Dairy manure

2

No

ABRU

Dairy manure

3 Complete Mix

Screw press with blower

Dairy manure

4

Mixed plug flow

Screw press

Dairy manure

5

Mixed plug flow

Screw press

Paunch manure, food waste

6

Mixed plug flow

Screw press

Dairy manure

7

Mixed plug flow

Screw press

Dairy manure

8

Complete Mix

Centrifuge

Dairy manure, ethanol byproduct, FOG

9

No

ABRU

Dairy manure

AD: anaerobic digestion, SLS: solid-liquid separation, ABRU: aerobic bedding recovery unit , FOG: fat, oil, and grease


Scheme of the manure processing technologies and sampling locations.
Figure 1. Scheme of the manure processing technologies and sampling locations.

Authors

Aguirre-Villegas Horacio Andres. Assistant Scientist. Department of Biological Systems Engineering, University of Wisconsin-Madison. aguirreville@wisc.edu

Sharara Mahmoud. Assistant Professor. Department of Biological and Agricultural Engineering. NC State University

Larson Rebecca. Associate Professor. Department of Biological Systems Engineering, University of Wisconsin-Madison

The authors are solely responsible for the content of these proceedings. The technical information does not necessarily reflect the official position of the sponsoring agencies or institutions represented by planning committee members, and inclusion and distribution herein does not constitute an endorsement of views expressed by the same. Printed materials included herein are not refereed publications. Citations should appear as follows. EXAMPLE: Authors. 2019. Title of presentation. Waste to Worth. Minneapolis, MN. April 22-26, 2019. URL of this page. Accessed on: today’s date.

Effects of Adding Clinoptilolite Zeolite on Dairy Manure Composting Mix on the Compost Stability and Maturity

The purpose of this project was to demonstrate the effects of adding natural clinoptilolite zeolites to a dairy manure compost mix at the moment of initiating the composting process on characteristics of the final compost and nitrogen (N) retention. On-farm composting of manure is one Best Management Practice (BMP) available to dairy producers. Composting reduces the volume of composted wastes by 20 to 60% and weight by 30 to 60%, which allows the final product to be significantly more affordable to transport than raw wastes. When done properly, composting can convert a considerable fraction of the N present in the raw manure into a more stable form, which is released slowly over a period of years and thereby not partially lost to the environment (Rynk et al., 1992; Magdoff and Van Es, 2009). During the manure handling and composting process, between 50 and 70% of the N can be lost as ammonia (NH3) if additional techniques are not used to increase nitrogen retention. Most of the time, manures from dairies and other livestock operations don’t have the proper carbon to nitrogen ratio (C:N) to be composted efficiently without added carbon. A balanced mix for composting should be between C:N of 30:1 to 40:1 (Rynk et al., 1992; Fabian et al., 1993). Since manures are richer in nitrogen (C:N ratios below 15:1), and bedding doesn’t add enough carbon during most of the year, a great proportion of the available N is lost as NH3 due to the lack of carbon to balance the composting process, resulting in a lower grade compost that can generate local and regional pollution due to NH3 emissions. In many arid zones there are not enough sources of carbon to balance the nitrogen present in the manure. Due to this lack of adequate carbonaceous material, additional methods to reduce the loss of N as NH3 during the composting process are needed. Several amendments have been evaluated in the past to achieve this reduction in N loss (Ndegwa et al., 2008). Zeolites are minerals defined as crystalline, hydrated aluminosilicates of alkali and alkaline earth cations having an infinite, open, three-dimensional structure. Clinoptilolite zeolite is mined in several western states including Idaho, where mining is near the dairy production areas.

This paper showcases an on-farm project that explored the effects of adding clinoptilolite to dairy manure at the time of composting as a tool to reduce NH3 emissions, retain N in the final composted product, and evaluate its effect on the final product.

What did we do?

This on-farm research was conducted at an open-lot dairy in Southern Idaho with 100 milking Jersey cows. Manure stockpiled during the winter and piled after the corral’s cleaning was mixed with fresh pushed-up manure from daily operations and straw from bedding and old straw bales, in similar proportions for each windrow. The compost mixture was calculated using a compost spreadsheet calculator (WSU-Puyallup Compost Mixture Calculator, version 1.1. Puyallup, WA). Moisture was adjusted by adding well water to reach approximately 50% to 60% moisture on the initial mix. Windrows were mixed and mechanically turned using a tractor bucket. Three replications were made for control and treatment. The control (CTR) consisted of the manure and straw mix as described. The treatment (TRT) consisted of the same mix as the control, plus the addition of 8% w/w (15%DM) of clinoptilolite zeolite during the initial mix. Windrows were actively composted for 149 days on average. Ammonia emissions were measured using passive samplers (Ogawa & Co. Kobe, Japan) and results were described in a previous Waste to Worth proceeding paper (de Haro Martí, et al. 2017). Complete initial manure (compost feedstock mix) and final screened compost nutrient lab analyses were performed for each windrow. Compost maturity tests were performed using the SOLVITA® test (Woods End Laboratories, Mt Vernon, ME). Statistical analyses were conducted using SAS 9.4 (SAS Institute, Cary, NC). Analyses included ANOVA (PROC MIXED) and paired t-test when applicable.

What have we learned?

The initial mix lab analysis revealed no significant differences in all parameters between control and treatment, except for ammonium (NH4+) where a tendency was observed. Many of the most stable parameters were very close to one another numerically, indicating a good management of the on-farm feedstock formulation and mixing. Ammonium at 553.4±100 mg/kg for CTR and 256.77±100 mg/kg for TRT showed a tendency (0.05<p≤0.1, Figure 1).

Figure 1. Ammonium ppm before and after composting   
Figure 1. Ammonium ppm before and after composting

This difference from the beginning of the process indicates that clinoptilolite has an immediate impact on NH4+ when added to the compost mix, changing the NH4+ and NH3 behavior and volatilization even during the construction of the windrow.

Nitrate (NO3) concentration in the TRT compost, 702±127 mg/kg was three times higher than the CTR, 223±127 (p= 0.05, Figure 2).

Figure 2. Nitrate ppm before and after composting

The presence of such high amount of NO3 compared to the control indicates a strong prevalence of nitrification processes (Sikora and Szmidt, 2001; Weil and Brady, 2017). Elevated NO3 concentrations are desirable in high quality compost used in plant nurseries, green houses, and horticulture, and are usually obtained from feedstock with much higher carbon content than the one used in this research. The NO3 to NH4+ ratio (NO3:NH4) in the treated windrows is also indicative of a much more stable compost than what is to be expected in a dairy compost with such low initial C:N (Sikora and Szmidt, 2001). High NO3 concentrations in compost could, however, generate a concern for NO3 leaching if the compost is not managed properly during storage and at the time of application (Miner et al., 2000; Weil and Brady, 2017). Total nitrogen (TN) on the compost was 14,933±1,379 mg/Kg (1.5%) for CTR and 11,300±1,379 mg/Kg (1.1%) for TRT (p=0.13), showing no significant difference.

Table 1. Solvita® test results on finished compost
Sample TRT or CTR

CO2
Index

NH3
Index

Maturity Index Compost Condition O2 depletion Phytotoxicity Noxious hazard pH NH4+ Estimate (ppm) N-Loss potential
W 1 CTR 6.5 3.5 5.5 Curing 1.60% Medium/ Slight Moderate /Slight 9.1 500 Moderate/Low
W 2 CTR 6.5 2 4.5 Active 2.50% High Severe 9.3 1500 M/ High
W 5 CTR 6.5 2 4.5 Active 2.50% High Severe 9.8 1500 M/ High
W 3 TRT 7 5 7 Finished 0.70% None None 9.5 <200 V Low-None
W 4 TRT 7 5 7 Finished 0.70% None None 8.9 <200 V Low-None
W 6 TRT 6 5 6 Curing 1.20% None None 9.3 <200 V Low-None

The Solvita® test results from the screened composts (Table 1) show a significant difference (p=0.007) in the NH3 test results between CTR, index 2.5±0.35 and TRT, index 5.0±0.35. Carbon Dioxide (CO2) test results showed no significant differences between CTR and TRT. All other calculated parameters showed a significant difference between control and treatment. Maturity index was 4.8±0.33 for CTR and 6.7±0.33 for TRT (p<0.02). Oxygen depletion was 0.022±0.002 for CTR and 0.009±0.002 for TRT (p<0.02). NH4+ estimate was 1167 for CTR and <200 for TRT (p=0.05). Other estimated test parameters indicate a significant difference between CTR and TRT results. Control windrows showed more unstable conditions, reaching the active or curing status, medium to high phytotoxicity, moderate to severe noxious hazard, and moderate to low N-loss potential. In contrast, treatment windrows showed more stable conditions, including reaching finished and curing status, no phytotoxicity or noxious hazard, and very low to no N-loss potential.

These results, coupled with the NO3:NH4 ratio and much higher NO3 values in the zeolite amended compost, indicate that the addition of clinoptilolite zeolite to a dairy manure compost mix in this study induced nitrification processes, produced NH4+ retention, NH3 emissions reduction, and lower oxygen depletion without significantly modifying the CO2 production. It also led to compost maturity characteristics that are regularly achieved only in compost mixes with much higher carbon content  and C:N ratios, usually associated with high quality composts. No negative effects were observed in the composting process or final product.

Future Plans

A greenhouse trial on silage corn comparing treatment and control compost effects followed. Results need to be analyzed and published.

Authors

Mario E. de Haro-Martí. Extension Educator. University of Idaho Extension, Gooding County, Gooding, Idaho. mdeharo@uidaho.edu  

Mireille Chahine. Extension Dairy Specialist. University of Idaho Extension, Twin Falls R&E Center, Twin Falls, Idaho.

Additional information


References:

de Haro-Martí, M.E., H. Neibling, M. Chahine, and L. Chen. 2017. Composting of dairy manure with the addition of zeolites to reduce ammonia emissions. Waste to Worth, Advancing Sustainability in Animal Agriculture conference. Raleigh, North Carolina.

Fabian, E. E., T. L. Richard, D. Kay, D. Allee, and J. Regenstein. 1993. Agricultural composting: a feasibility study for New York farms. Available at:  http://compost.css.cornell.edu/feas.study.html . Accessed 04/28/2011.

Lorimor, J., W. Powers, A. Sutton. 2000. Manure Characteristics. Manure Management System Series. Midwest Plan Service. MPWS-18 Section 1. Iowa State University.

Magdoff, F., & Van Es, H. (2009). Building soils for better crops – Sustainable soil management (3rd ed.). Brentwood, MD, USA: Sustainable Agriculture Research and Education program.

Miner, J. R., Humenik, F. J., & Overcash, M. R. 2000. Managin livestock wastes to preserve environmental quality (First ed.). Ames, Iowa, USA: Iowa State University Press.

Mumpton, F.A. 1999. La roca magica: Uses of Natural Zeolites in Agriculture and Industry. Proceedings of the National Academy of Sciences of the United States of America, Vol.     96, No. 7 (Mar. 30, 1999), pp. 3463-3470

Ndegwa, P. M., Hristov, A. N., Arogo, J., & Sheffield, R. E. 2008. A review of ammonia emission mitigation techniques for concentrated animal feeding operations. Biosystems Eng. (100), 453-469.

Rink, R., M. van de Kamp, G.B. Willson, M.E. Singley, T.L. Richard, J.J. Kolega, F.R. Gouin, L.L. Laliberty Jr., D.K. Dennis. W.M. Harry, A.J. Hoitink, W.F.Brinton. 1992. On-Farm Composting Handbook. NRAES-54. Natural Resource, Agriculture, and Engineering Service. Cooperative Extension. Ithaca, New York.

Sikora, L. J., & Szmidt, R. A. 2001. Nitrogen sources, mineralization rates, and nitrogen nutrition benefits to plants from composts. In P. J. Stofella, & B. A. Kahn (Eds.), Compost utilization in horticultural cropping systems (pp. 287-306). Boca Raton, Florida, USA: CRC Press LLC.

Weil, R. R., & Brady, N. C. 2017. The nature and properties of soils (Fifteenth. Global Edition ed.). Harlow, Essex, England: Pearson Education Limited.

Acknowledgements

This project was made possible through a USDA- ID NRCS Conservation Innovation Grants (CIG) # 68-0211-11-047. The authors also want to thank the involved dairy farmer and colleagues that helped during this Extension and research project. Thanks to USDA-ARS Kimberly, ID for the loan and sample analysis of the Ogawa passive samplers.

The authors are solely responsible for the content of these proceedings. The technical information does not necessarily reflect the official position of the sponsoring agencies or institutions represented by planning committee members, and inclusion and distribution herein does not constitute an endorsement of views expressed by the same. Printed materials included herein are not refereed publications. Citations should appear as follows. EXAMPLE: Authors. 2019. Title of presentation. Waste to Worth. Minneapolis, MN. April 22-26, 2019. URL of this page. Accessed on: today’s date.