
The Problem
Concerns are mounting in states that have sensitive waterways about the release of P from manure and compost into ground and surface water. P is the limiting nutrient for many freshwater ecosystems and as such regulate the rate of eutrophication and oxygen depletion. The concerns have led to new regulations that limit the application of manure and in some cases compost products that have high concentrations of P. Also, compost use in stormwater biofiltration swales has been called into question because of the potential leaching of P. There are concerns in the composting industry that the regulations will limit the application of compost and reduce the market for compost products.
Composting can theoretically increase the biological activity of the soil matrix and help the formation of aggregates that absorb nutrients. Compost also contains metals such as iron, magnesium, calcium and aluminum that help bind P to the soil particles. Composting has a substantial impact on N as the high temperatures result in losses of ammonia. Depending on the stage of composting, the bacterial thermophilic phase of composting can release P during the breakdown of plant and animal tissue. In contrast the curing or fungal phase can bind nutrients into the hyphae and to the stabilized organic substrate. Additionally, soils high in organic C have lower bulk densities and prevent runoff because of the increased water holding capacity and infiltration rates*. The concept is that even though the overall P levels in the soils are increasing with compost application, only a small portion of the P is in the liquid phase and there is sufficient soil and plant uptake to limit P losses.
*Spargo, J.T., G.K. Evanylo, and M.M. Alley. 2006. Repeated compost application effects on phosphorus runoff in the Virginia Piedmont. J. Environ. Qual. 35:2342–2351.
What did we do?
In 2014, Green Mountain Technologies (GMT) received an Animal Waste

Technology Fund (AWTF) grant from the Maryland Department of Agriculture to install an Earth Flow composting systems at Days End Farm (DEF, Fig. 1) in Howard County and Glamor View Farms in Frederick County. There were two types of manures that were tested, dry pack manure from Glamour View Farms and bedded horse manure from Days End Farm.
Days End Farm Horse Rescue is a non-profit, volunteer-based animal welfare organization established in 1989 to provide care and treatment for horses that have been abused or mistreated. DEF works to rehabilitate horses, find good homes for them and educate the public about humane treatment of horses. DEF cares for between 100-150 horses annually, rehabilitating them and preparing them for adoption.

Glamour View Farm (GVF, Fig. 2) is a 146-acre dairy operation which is a part of Lager Farms. Glamour View houses approximately 180 Holstein and Jersey cows. In 2014, Green Mountain Technologies (GMT) and GVF received an AWTF grant from the Maryland Department of Agriculture to install an Earth Flow composting system at GVF in Frederick County, Maryland.
Description of the Earth Flow Composting System
The Earth Flow (Fig. 3 & 4) is an in-vessel composting system that integrates an automated mixing system, aeration system and moisture addition system into the vessel. The Earth Flow system accelerates the composting process by providing optimum conditions for aerobic composting. The combination of these features facilitates a thermophilic composting process for horse manure and bedding in 10-14 days.


The Earth Flow has an integrated mixing system (Fig. 5) that allows the compost to be mixed on a daily basis (2-4 times per day). The traveling auger is the key to the effectiveness of the Earth Flow. It provides seven different functions that facilitate the hot composting process:
- Shreds. The auger breaks up manure balls to reduce particle size and expose nutrients to the microbes.
- Mixes. The auger mixes material by smearing manure onto bedding.
- Aerates. The auger continually fluffs the compost to add oxygen to the compost matrix.
- Distributes Moisture. The auger sweeps up wet material from the lower portions of the compost pile and elevates it to the surface.
- Homogenizes. The auger homogenizes manure with bedding for an even distribution of nutrients.

- Transports. The auger slowly increments compost from the load end to the discharge end.
- Stacks. As compost reduces in volume, the auger continually stacks the material toward the back to maximize utilization of the space.
The Earth Flow is designed such that feedstocks are loaded on one end of the vessel and finished product is discharged from the opposite end of the vessel.
The Earth Flow at Days End Farm is operated as a continuous-flow system. In a continuous-flow system, feedstocks can be loaded at any time on the load end and the traveling auger slowly migrates compost to the discharge end. Material can be discharged once the vessel is full and/or the user is ready to discharge compost. The standard mixing pattern of the auger is shown below.
The basis of the study was to evaluate whether composting manure would reduce the amount of P, especially the water extractable P compared to raw manure. The theoretical basis for this reduction is that composting would add more carbon and also tie up P in the increased biomass making it less available to run off. While N can be lost to the atmosphere as ammonia or converted to elemental nitrogen gas, P is only transportable in liquid phase and can neither be created or destroyed by the normal biological processes. P is essentially recycled through biomass and decaying plant and animal tissues release P that is the reabsorbed by new living tissue.
Samples of raw manure were collected prior to composting and the same manure was sampled 3-4 weeks later to determine the changes in nutrient levels and water extractable P. Samples were taken every quarter for a one year period to assess any seasonal changes. One of the proposed applications for the compost product was bedding reuse so some of the focus of the study related to product quality as a recycled bedding material.
What we learned
Bedded Horse Manure
The average total Nitrogen (N) of 0.68% comprised 0.03% Ammonia-N of the loaded mixture (over the study period) with 52% moisture and 48% solids, with a total carbon content of about 40%, resulting in a C:N ratio of 29. Total P in the loaded mixture was 0.17% of which 0.40% was P2O5. For the compost produced during this period, the total N averaged 0.6% (5980 mg/kg) of which 0.06% was ammonia (577 mg/kg) and 0.54% was organic N (5436 mg/kg) and 470 mg/kg nitrate-nitrite N. The total carbon was 44.87% (44867 mg/kg), resulting in a C:N ratio of 214, with an average moisture content of 20% (Tables 3 and 4).
The average N:P ratio for the unloaded compost is 1.5 (5980:4140). Minerals analyzed from the manure and unloaded compost showed variability between samples collected on the different dates, but all measured concentrations of calcium, magnesium, sodium, iron, aluminum, manganese, copper, and zinc were within acceptable ranges. The nearly 30% decrease in moisture content over the composting period was measured, this is of interest as the compost process is optimal at 50% moisture content with a workable range from 40-60%. When moisture reaches 35% or less the material is suitable for screening when producing a product for landscape or horticultural uses. In addition, microbial decomposition (metabolic) activity decreases substantially resulting in insufficient metabolically generated heat within the compost mass. The TKN and C:N data indicate a substantial reduction in N during the compost process. We inquired with Waypoint about data reporting errors as the N values seemed surprisingly low. They had already disposed of the samples so they were not able to rerun the test. They did offer to retest and we may have them run the data points again. If the N data is correct, then a substantial amount of N would have been lost to the air as ammonia. In contrast, two of the three P values were higher in the compost than in the raw manure. There may be several explanations for this trend. One point of interest as the bedding reuse continues is the accumulation of P in the compost product.
Dairy Dry Pack Manure
Penn State Labs performed the lab analysis of the raw manure and compost samples on 8/7/17. The lab samples were stored at Michael Calkin’s refrigerator and shipped to Penn State. Two samples were taken at the load and unload ends of the vessel each week and combined into a single grab sample. Ammonia and Organic N were analyzed as well as P, extractable P and carbon. Because Glamor View is operated as a batch system, the initial sample on 5/28/17 represents the raw manure at both the load and unload ends of the vessel. Each subsequent lab analysis shows the weekly change in N or P as the manure turns into compost as shown below (Fig. 6 – 8).


Winter 2017
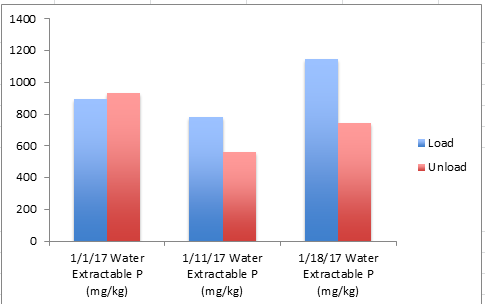
The nutrient levels showed no clear trend of diminishment during the 3 weeks of monitoring as shown in Table 1. The average N actually increased which seems highly unlikely given ammonia losses typically experienced during composting. The good news is that it has reasonable fertilizer value when compared to typical composts. The average P2O5 levels were unchanged during the 3-week sampling also. The water extractable P showed a slight downward trend but once again the data was scattered. The only conclusion we can make from the data is that more P was liberated during the thermophilic phase of composting than was bound up by bacterial bodies. In retrospect, additional water extractable samples should have been performed on the cured compost to see how much water extractable P is in the product immediately before the compost is applied to fields or gardens.
| Table 1. Lab Analysis of Bedded Horse Manure Before and After Three Weeks of Composting | |||||
|---|---|---|---|---|---|
| Average results for Compost Feedstock Loaded into the Earth Flow unit at
Days End Farm in December 2015 |
Average results for Compost Unloaded from Earth Flow unit at
Days End Farm in December 2015 |
||||
| TEST | Dec 2015 Summary (%) | Average result-Dec 2015 (mg/Kg) | TESTα | Dec 2015 Summary (%) | Average result-Dec 2015 (mg/Kg) |
| As Received | Dry basis | ||||
| Nitrogen, N % | 0.39 | 0.95 | |||
| Ammonical-N % | 0.07 | 0.16 | Total Kjeldahl Nitrogen | 1.12 | 11200.00 |
| Phosphorus, P % | 0.10 | 0.23 | Total Phosphorus | 0.33 | 3346.67 |
| Potassium, K % | 0.36 | 0.87 | Total Potassium | 1.10 | 11033.33 |
| Sulfur, S % | 0.06 | 0.14 | Total Sulfur | 0.19 | 1923.33* |
| Magnesium, Mg % | 0.13 | 0.32 | Total Magnesium | 0.38 | 3760.00* |
| Calcium, Ca % | 1.76 | 4.53 | Total Calcium | 2.35 | 23466.67* |
| Sodium, Na ppm | 602.00 | 1480.00 | Total Sodium | 0.18 | 1773.33* |
| Iron, Fe ppm | 889.00 | 2173.33 | Total Iron | 4310.00* | |
| Aluminum, Al ppm | 368.33 | 873.00 | Total Aluminum | 3500.00* | |
| Manganese, Mn ppm | 93.07 | 230.00 | Total Manganese | 278.67* | |
| Copper, Cu ppm | 8.05 | 19.77 | Total Copper | 26.33* | |
| Zinc, Zn ppm | 33.60 | 82.93 | Total Zinc | 91.33* | |
| Boron, B ppm | 2.50 | 6.12 | Total Volatile Solids | 78.14 | 781400.00 |
| Test | Result | Result | |||
| Moisture % | 59.5 | Moisture † | 31.46 | Moisture † | |
| Solid % | 40.5 | Total Solids † | 68.54 | 685366.67 | |
| Additional Tests | Result | ||||
| P2O5 (as received) , % | 16.41 | C/N RATIO † | 40.67 | ||
| K2O (as received) , % | 0.428 | Carbon (TOC) † | 45.43 | 454333.33 | |
| αAll values are on a dry weight basis, except as noted by†; Detection limit on all N series is on a wet basis.
*Within normal range, Analyses by Waypoint Laboratories, Richmond, VA |
|||||


Spring 2017
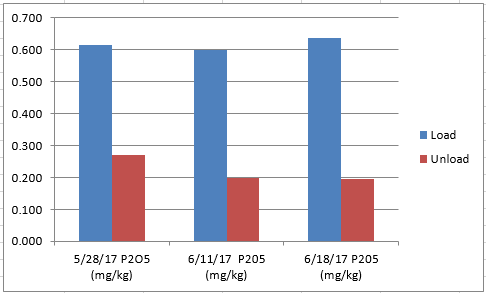
Unlike the last sampling event over the winter, the nutrient levels showed a clear trend of diminishment during the 3 weeks of monitoring as shown in Fig. 9-11. The average N reduced by 30% or more during the three weeks of composting. The average P2O5 levels showed a downward trend on the unload and unchanged on the load end which is expected given that P is not lost in the compost process. The water extractable P had a clear downward trend for both the load and unload ends of the vessel with an average 42% reduction over the 3 weeks. Water extractable P is more important than a reduction in the P2O5 levels as it indicates the amount of P available for leaching. In general, the lab data supported the trends that are typical of composting. It is not clear if the change over the winter results were seasonal or if the sampling methods were inconsistent. One possibility is the change in feed type that the heifers receive in the summer vs winter. In retrospect, additional water extractable samples should have been performed on the cured compost to see how much water extractable P is in the product immediately before the compost is applied to fields or gardens. This sampling would have provided a more complete picture of the entire compost process for nutrient management.
Next Steps
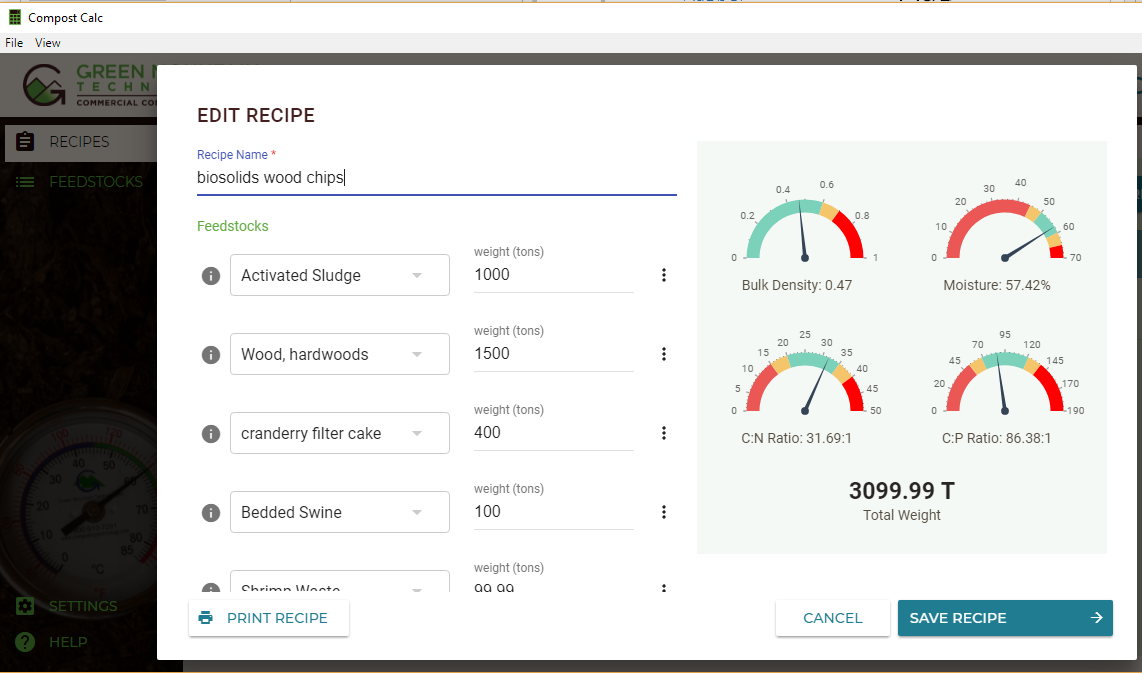
There is no doubt that P chemistry and bioavailability are complicated subjects. Based on this work and studies done by Larry Sikora at USDA and John Spargo there needs to be a more comprehensive study performed with greater control of variables to demonstrate what might actually happen in the field with P availability and losses in compost. The other effort GMT is involved in is the development of a compost feedstock recipe calculator that includes values for different feedstock P concentrations and also performs C/P ratio calculations (Fig. 12). The calculator has an interactive dial format that immediately shows the user how the volumes of different feedstocks changes not only C/N but C/P ratios as shown below. The hope is that the software will raise awareness about P and help to make compost products with balanced nutrient ratios.
Authors
Michael Bryan-Brown, Green Mountain Technologies, mbb@compostingtechnology.com
The authors are solely responsible for the content of these proceedings. The technical information does not necessarily reflect the official position of the sponsoring agencies or institutions represented by planning committee members, and inclusion and distribution herein does not constitute an endorsement of views expressed by the same. Printed materials included herein are not refereed publications. Citations should appear as follows. EXAMPLE: Authors. 2019. Title of presentation. Waste to Worth. Minneapolis, MN. April 22-26, 2019. URL of this page. Accessed on: today’s date.