Ionophores are a type of antibiotics that are used in cattle production to shift ruminal fermentation patterns. They do not kill bacteria, but inhibit their ability to function and reproduce. In the cattle rumen, acetate, propionate, and butyrate are the primary volatile fatty acids produced. It is more energetically efficient for the rumen bacteria to produce acetate and use methane as a hydrogen sink rather than propionate. Ionophores inhibit archaea forcing bacteria to produce propionate and butyrate as hydrogen sinks rather than working symbiotically with methanogens to produce methane as a hydrogen sink. Numerous research studies have demonstrated performance advantages when ionophores are fed to beef cattle, but few have considered potential environmental benefits of feeding ionophores. This study was conducted to determine if concentrations of greenhouse gases, odorous volatile organic compounds (VOC), ammonia, and hydrogen sulfide from beef cattle manure could be reduced when an ionophore was fed to finishing cattle.
What Did We Do?
Four pens of feedlot cattle were fed an ionophore (monensin) and four pens received no ionophore (n=30 animals/pen). Samples were collected six times over a two-month period. A minimum of 20 fresh fecal pads were collected from each feedlot pen at each collection. Samples were mixed within pen and a sub-sample was placed in a small wind-tunnel. Duplicate samples for each pen were analyzed. Ammonia, carbon dioxide (CO2), and nitrous oxide (N2O) concentrations were measured using an Innova 1412 Photoacoustic Gas Analyzer. Hydrogen sulfide (H2S) and methane (CH4) were measured using a Thermo Fisher Scientific 450i and 55i, respectively.
What Have We Learned?
Table 1. Overall average concentration of compounds from feces of beef feedlot cattle fed diets with and without monensin.
Total CH4 concentration decreased when monensin was fed. Of the VOCs measured, only total sulfide concentration was lower for the manure from cattle fed monensin compared to those not fed monensin. Ammonia, N2O, CO2, H2S, and all other odorous VOC were similar between the cattle fed monensin and those not fed monensin. The results only account for concentration of gases emitted from the manure and do not take into account any urinary contributions, but indicate little reduction in odors and greenhouse gases when monensin was fed to beef finishing cattle.
Future Plans
A study is planned for April – July 2019 to measure odor and gas emissions from manure (urine and feces mixture) from cattle fed with and without monensin. Measurements will also be collected from the feedlot surface of pens with cattle fed with and without monensin.
Authors
Mindy J. Spiehs, Research Animal Scientist, USDA ARS Meat Animal Research Center, Clay Center, NE
Bryan L. Woodbury, Agricultural Engineer, USDA ARS Meat Animal Research Center, Clay Center, NE
Kristin E. Hales, Research Animal Scientist, USDA ARS Meat Animal Research Center, Clay Center, NE
Additional Information
Dr. Hales also looked at growth performance and E. coli shedding when ionophores were fed to finishing beef cattle. This work is published in Journal of Animal Science.
Hales, K.E., Wells, J., Berry, E.D., Kalchayanand, N., Bono, J.L., Kim, M.S. 2017. The effects of monensin in diets fed to finishing beef steers and heifers on growth performance and fecal shedding of Escherichia coli O157:H7. Journal of Animal Science. 95(8):3738-3744. https://pubmed.ncbi.nlm.nih.gov/28805884/.
USDA is an equal opportunity provider and employer.
Acknowledgements
The authors wish to thank Alan Kruger, Todd Boman, and the USMARC Cattle Operations Crew for assistance with data collection.
The authors are solely responsible for the content of these proceedings. The technical information does not necessarily reflect the official position of the sponsoring agencies or institutions represented by planning committee members, and inclusion and distribution herein does not constitute an endorsement of views expressed by the same. Printed materials included herein are not refereed publications. Citations should appear as follows. EXAMPLE: Authors. 2019. Title of presentation. Waste to Worth. Minneapolis, MN. April 22-26, 2019. URL of this page. Accessed on: today’s date.
Over the last 15 years it has become common to build new poultry production facilities on a piece of property that will provide the necessary land area for all of the barns and support facilities, and that comply with the setbacks (i.e. surface water, nearest neighbors) required by local, state, and federal regulations. The manure management plan in such cases depended on the transport of poultry manure to remote cropland that was often not owned and managed by the poultry producer. In some states, the law held the poultry producer legally responsible for any possible environmental consequences associated with irresponsible spreading or handling. Such laws tended to limit transport distances due to the lack of liability transfer. In other states, like South Carolina, poultry manure brokers were required to have a state permit that allowed for the transfer of liability from the producer to the broker by means of a contract. The broker became liable for proper application rates, adherence to setback requirements, application at agronomic rates, and other state requirements. While transfer of liability did encourage the movement of manure from nearby fields with high soil-test phosphorous contents to remote fields that could benefit from all plant nutrients in manure it also gave rise to an increase in the number or farms that were permitted with manure brokerage as the only manure nutrient management alternative.
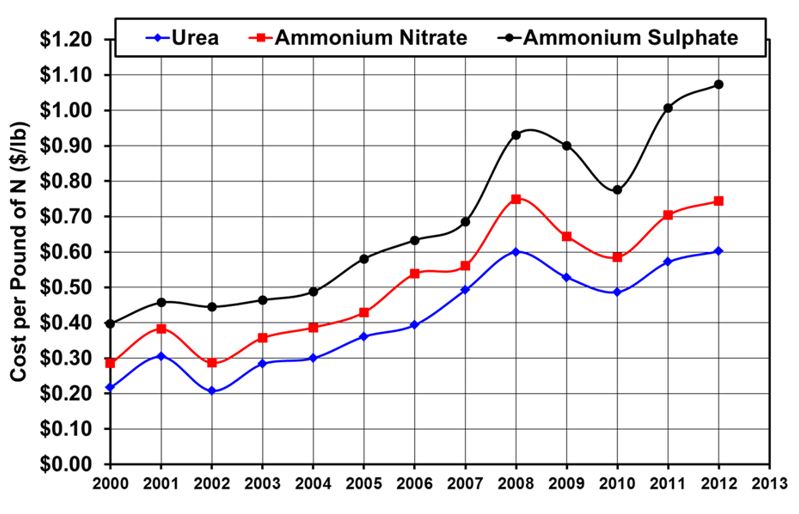
During the period from 2002 to 2008 when many new poultry farms were being built the average prices of N, P2O5, and K2O were increasing due to surges in fuel prices. Nitrogen prices increased in a linear manner from 29 to 75 cents per pound or a 2.6 fold increase in price (Table 1 and Figure 1). Prices of the other major nutrients, P2O5 and K2O, increased by over a factor of 3 for the same six year period (Figure 2). Such increases in the cost of fertilizers greatly increased demand for poultry manure, and further encouraged poultry producers to build barns that depended on brokerage as the only manure management option without any considerations of potential decreases in manure value. In recent years, fertilizer prices have decreased and brokerage of manure is not as attractive. The objective of this study was to determine the impact of fertilizer price fluctuations on the value of broiler litter, high-rise layer manure, turkey grow-out litter, and turkey brooder litter.
Table 1. Fertilizer composition information and equation used to convert price per ton to price per pound.
Fertilizer Description
Nutrient Content Per Ton of Fertilizer
Urea – 46% N by weight
920 lb N/ton
Ammonium Nitrate – 34% N by weight
680 lb N/ton
Ammonium Sulfate – 21% N and 24% by weight
420 lb N/ton
Conc. Super-Phosphate – 46% P2O5 by weight
920 lb P2O5 /ton
Potassium Chloride – 60% K2O by weight
1200 K2O / ton
Equation Used to Convert Fertilizer Price to Price per Pound of Nutrient
$ / lb Nutrient = $ / Ton of Fertilizer÷ lb Nutrient / Ton
Figure 1. Variation in nitrogen prices based on national averages from 2000 to 2012 (USDA-ERS, 2013).
Figure 2. Variation in P2O5 and K2O prices based on national averages from 2000 to 2012 (USDA-ERS, 2013).
What did we do?
Fertilizer Nutrient Content of Poultry Manure
The type of poultry raised in a building and the amount of bedding used causes a wide variation in the plant nutrient content of the manure removed from the building. The manure composition used in the study was taken from data obtained in South Carolina and is shown in Table 2. Broiler litter and turkey grow-out litter were the most similar since pine shavings were used as bedding and several flocks of birds were grown-out on the litter prior to building clean-out. Clean-out frequency varies greatly from every 1 to 1.5 years. The data shown in Table 2 corresponded to annual litter clean-out. The moisture contents (MC) of these two litters were also similar (24% for the broiler litter and 26% for the turkey grow-out litter). Turkey production begins on a brooder farm where chicks are placed, brooded, and the poults are transported to a grow-out farm. These farms are unique in that the litter was completely changed after each flock. The result is that litter from a brooder farm is much drier (14% moisture content) and contains less manure than any other type of poultry manure. The lower manure content also resulted in lower plant nutrient content. Manure from a high-rise layer barn was at the other extreme. Since no bedding was added to the manure the moisture content was much higher (47%). The high moisture content resulted in lower plant available nitrogen (PAN) content as compared to broiler litter, as well as lower phosphorus content (expressed as P2O5) and potassium (expressed as K2O).
Table 2. Poultry manure composition (lb / ton) used in the analysis (Chastain et al, 2001).
Nutrient
Broiler Litter(MC = 24%)
Layer Manure(MC = 47%)
Turkey Grow-out Litter (MC = 26%)
Turkey Brooder Litter (MC = 14%)
Ammonium-N
10
12
12
2.6
Nitrate-N
3.6
None detected
0.4
0.6
Org-N
43.8
22
42
37.2
Total-N
57.4
34
54
40.4
PAN – inc *
38
23
35
25
P2O5
66
51
64
29
K2O
57
26
37
20
* PAN – inc. = Incorporated plant available N = 0.60 x Org-N + 0.80 x Ammonium-N + Nitrate-N
Data for all three forms of nitrogen are provided in Table 2. However, not all of the nitrogen in manure is available for use by a crop. For this study, it was assumed that poultry manure was incorporated on the same day that it was applied by disking. As a result, 80% of the ammonium-N was counted as plant available. The amount of organic-N (Org-N) mineralized was assumed to be 60% based on common recommendations in South Carolina, however mineralization rates vary based on soil temperature, pH, and moisture. All the small amounts of nitrate contained in the manure was counted as available. The equation used for PAN estimates is provided with the table. Additional information concerning the estimate of plant available-N is provided by Chastain et al (2001).
The three plant nutrients used in our analysis are shown in bold colors in Table 2 for each type of poultry manure. They were the PAN, which is the best estimate of the nitrogen in manure that can be substituted for fertilizer-N, P2O5, and K2O.
Fertilizer Component Prices Used
The price of a pound of fertilizer nitrogen depends of the source. The price data shown previously in Figure 1 shows clearly that the most expensive source of nitrogen was ammonium sulfate, followed by ammonium-nitrate and urea. Ammonium-sulfate, the most expensive source of N, has few advantages unless soil-test results indicate that addition of large amounts of sulfur is needed. Ammonium-nitrate is one of the most common types of nitrogen used to manufacture complete fertilizers. It has the advantage of being water soluble, and is not as readily lost to the air as ammonia as compared to urea. Urea has the advantages of being more water soluble than ammonium-nitrate, and contains 35% more N per ton than ammonium-nitrate. The primary disadvantage of urea is that a significant amount (20% to 40%) can be lost to the air by ammonia volatilization unless it is incorporated in the soil to a depth of at least one inch. So the basic question to decide is: which N-price should be used to define the value of the plant available-N in poultry manure? The price of urea was selected because urea and poultry manure behave similarly with regards to ammonia volatilization losses.
The prices of N, P2O5, and K2O were shown to fluctuate widely from 2000 to 2012 (see Figures 1 and 2). The largest cause of these price fluctuations was the price of energy (i.e. oil) needed to manufacture and transport fertilizers. As a result, the prices of these three major plant nutrients were not allowed to vary independently in the analysis. That is, prices of all three nutrients had to be selected by year because of the dependence of all three on energy prices.
It was not a study objective to try to predict future prices since that would be possible, nor was it to perform calculations for each year. To do so would provide many numbers, but would obscure the basic points to be learned. Instead, the approach used was to select nutrient prices by year and use the years that encompassed the linear increase that began in 2004 as well as major peaks and valleys seen in the price of nitrogen in 2008, 2010, and 2012. Prices were also obtained from market reports to obtain prices for the fourth quarter of 2016 (USDA-SC, 2016; DTN, 2016). The actual prices used by year for the analysis are given in Table 3.
Table 3. Component fertilizer prices used in the analysis (USDA-ERS, 2013). The prices shown for 2016 were average prices obtained from market publications from the fourth quarter (USDA-SC, 2016; DTN, 2016).
Year
$/lb N (Urea)
$/lb P2O5
$/lb K2O
2004
0.30
0.29
0.15
2008
0.60
0.87
0.47
2010
0.49
0.55
0.43
2012
0.60
0.72
0.54
2016
0.37
0.26
0.27
Value of Poultry Manure Used as a Complete Fertilizer – N,P, and K
The first step in the study was to calculate the value of a ton of poultry manure by multiplying the price of N, P2O5, and K2O for each year (Table 3) by the amount of these nutrients per ton of manure (Table 2). This assumes that all of the nutrients in the manure can be used to grow a marketable crop. This is only true if the soil is poor in fertility or the excess P can be used by other crops in the rotation without application of additional manure. Many brokerage contracts in South Carolina, are based on application of 2 tons of litter per acre prior to a primary crop, such as corn or cotton. Additional litter is not spread on the second crop which is often soybeans. The results for the first step are provided in Table 4.
Table 4. Variation in the value of various types of poultry manure ($/ton) based on variability in price of N, P2O5, and K2O. Prices assume that all of the nutrients in the manure can be used in a crop rotation.
Year
Broiler (MC = 24%)
Layer (MC = 47%)
Turkey Grow-out (MC = 26%)
Turkey Brooder (MC = 14%)
2004
39.09
25.59
34.61
18.91*
2008
107.01
70.39
94.07
49.63
2010
79.43
50.50
68.26
36.80
2012
101.10
64.56
87.06
46.68
2016
46.61
28.79
39.58
22.19*
* Denotes values too low to be part of a viable brokerage contract with typical brokerage prices being in the range of $20 to $25 per ton of manure.
The most important observations that can be made from the results given in Table 4 are given below.
The value of broiler and turkey grow-out litter followed similar fluctuations. The values ranged from about $35 to $39 per ton in 2004 to a maximums of $94 to $107 per ton in 2008. By the end of 2016 the value of turkey grow-out litter and broiler litter ranged from about $40 to $47 per ton. During the years with high fertilizer prices brokerage customers that were paying $40 to $50 to spread 2 tons of litter per acre were receiving much more fertilizer value than they were paying for.
Turkey brooder litter consistently had the lowest value per ton as compared to the others due to low nutrient content and the large amounts of bedding used. The value of a ton of this type of litter was too low in 2004 and 2016 to be viable for litter brokerage contracts. Even during years with high fertilizer prices (2008 and 2012) turkey brooder litter was rarely brokered since it was so dry. Such dry, low-density manure that was mostly pine shavings further reduced the amount of litter and fertilizer value that could be fit into a typical trailer.
Layer manure consistently had lower value per ton as compared to broiler and turkey grow-out litter. The lower value was due to the much higher moisture content which diluted the nutrient value of the manure. Layer litter was a viable brokerage option, but not for long haul distances.
Value of Poultry Manure Applied to Fields with Sufficient P2O5
A common situation is when soil-test results indicate that a field has sufficient P2O5 in the soil for not only the crop to be grown immediately, but also for the next crop in the rotation (soybeans for example). In such cases, the P2O5 in poultry manure has no value, and only the N and K2O in the manure can be used as a fertilizer substitute. The results for this situation are provided in Table 5.
Table 5. Variation in the value of various types of poultry manure ($/ton) based on N and K2O prices. It was assumed that soil-test indicate that no P2O5 was needed.
Year
Broiler (MC = 24%)
Layer (MC = 47%)
Turkey Grow-out (MC = 26%)
Turkey Brooder (MC = 14%)
2004
19.95*
10.80*
16.05*
10.50*
2008
49.59
26.02
38.39
24.40
2010
43.13
22.45*
33.06
20.85*
2012
53.58
27.84
40.98
25.80
2016
29.45
15.53*
22.94*
14.65*
* denotes values are two low to be part of a viable brokerage contract with typical brokerage prices being in the range of $20 to $25 per ton of manure.
The results indicated that when the N price was $0.30/lb and K2O averaged $0.15/lb in 2004 the value of poultry manure was too low to be moved at contact prices of $20 to $25 per ton. Also, at prices associated with 2008, 2010, and 2012 the value of broiler and turkey grow-out litter ranged from $33 to $54 per ton. Layer and turkey brooder litter were poor to marginal values for brokerage contacts when the P2O5 was not needed over the entire range of fertilizer prices.
Comparing the results for 2008 for broiler litter indicates that if P2O5 was not needed the value fell from $107.01/ton to $49.59/ton. That is, the value of the litter was reduced by 54%. The year with the next highest value, 2012, eliminating the need for P2O5 reduced the litter value by 47%. Large drops in litter value can also be observed for other types of poultry manure by comparing the values in Tables 4 and 5. These results indicate that the P2O5 contained in poultry manure is one of the largest sources of value.
Value of Poultry Manure as Only a Source of Nitrogen
The analysis was performed again to reflect the value of poultry manure if nitrogen is the only major nutrient needed based on soil-test results. The results given in Table 6 clearly show that nitrogen alone never provided enough value to support brokerage contracts.
Table 6. Variation in the value of various types of poultry manure ($/ton) when nitrogen is the only nutrient needed based on soil-test results.
Year
Broiler (MC = 24%)
Layer (MC = 47%)
Turkey Grow-out (MC = 26%)
Turkey Brooder (MC = 14%)
2004
11.40*
6.90*
10.50*
7.50*
2008
22.80*
13.80*
21.00*
15.00*
2010
18.62*
11.27*
17.15*
12.25*
2012
22.80*
13.80*
21.00*
15.00*
2016
14.06*
8.51*
12.95*
9.25*
* denotes values are two low to be part of a viable brokerage contract with typical brokerage prices being in the range of $20 to $25 per ton of manure.
Results for a Four-House Broiler Farm
The previous results demonstrated that high litter nutrient contents combined with strong fertilizer prices yielded litter values that were much greater than the amount paid to litter brokers. The results also demonstrated that P2O5 was one of the key contributors to litter value. The results of the analysis were applied to a four-house broiler farm to more clearly demonstrate the practical implications. Fertilizer prices from January 2019 in central South Carolina were also added to the analysis. The key assumptions and results are provided in Table 7.
Table 7. Application of analysis results to a 4-house broiler farm. Building size = 50 ft x 500 ft, litter production was assumed to be 580 tons/year (145 tons/house/yr) with a price of $10/ton paid to the broiler producer ($5800/year).
Year
N Price ($/lb)
P2O5 Price ($/lb)
K2O Price ($/lb)
Litter Value ($/ton)
Value of 580 tons of litter ($/Year)
Value from N (%)
Value from P2O5 (%)
Value From K2O (%)
Loss to Producer ($/Year)
2004
0.30
0.29
0.15
39.09
22,672
29
49
22
16,872*
2008
0.60
0.87
0.47
107.01
62,066
21
54
25
56,266
2010
0.49
0.55
0.43
79.43
46,069
23
46
31
40,269
2012
0.60
0.72
0.54
101.1
58,638
23
47
30
52,838
2016
0.37
0.26
0.27
46.61
27,034
30
37
33
21,234
2019**
0.38
0.54
0.31
67.75
39,295
21
53
26
33,495
* The price paid to a broiler producer in a brokerage contract ranges from 0 to $15/ton of litter. A value of $10 /ton of litter is common. The loss was calculated as: (litter value ($/ton) – $5800).
** Prices from central South Carolina obtained in January 2019.
The results indicate that the total value of litter on a four house farms that produces 580 tons of litter per year varied from $22,672 per year in 2004 to a maximum of $62,066 per year in 2008. Currently, the value in January 2019 was estimated to be $39,295/year. In every year, the P2O5 contained in the litter contributed the most to the litter value. This contrasts with the common assumption that the high P2O5 content in litter is a problem as compared to nitrogen. The results point out that the most value can be obtained from litter by giving phosphorous use the priority in manure management. Assuming that the broiler producer was consistently paid $10/ton of litter by the broker the annual litter income was only $5800 per year. If the producer had integrated broiler production with crop production using a rotation that would realize all the fertilizer value in the litter the total litter value would have served to improve profitability of the cropping enterprise. If the producer relied on brokerage as the sole manure management strategy then the annual loss to the producer ranged from $16,872 to $56,266 per year depending on fertilizer prices.
What these results also point to, but do not quantify, is the variation in risk. Producers who built farms using brokerage as the sole manure management plan during the years of high fertilizer prices gave away litter that was worth 3.9 to 10.7 times more than they were paid. They also have incurred a great risk since brokerage contracts typically last only one year, and crop producers who once were happy to purchase brokered litter are no longer consistent customers. Such producers are forced to quickly find other litter use alternatives often in areas where agricultural and forest land may not be close to the farm. Building broiler barns relying on annual brokerage contracts as the sole manure management option has been shown to be short sighted, and has a low probability of being economically or environmentally sustainable. Co-locating poultry production with some sort of profitable plant production enterprise that can use all of the fertilizer value in the litter is preferred. The next most viable alternative may be to use litter to produce high-quality compost for high volume, consistent markets.
What have we learned?
It was found that the value of poultry manure as a complete fertilizer (N,P,K) varied from $18.91 to $107.01 per ton depending of component prices (N, P, K), moisture content, and the amount of bedding used. If the receiving fields did not require phosphorous, based on soil test, the realized value ranged from $10.50 to $49.59 per ton. Finally, if soil-test indicate that N was the only major nutrient needed the value decreased to $7.50 to $22.80 per ton. During the same time frame, brokerage prices ranged from $20 to $50 per ton depending on haul distance and spreading service. However, most brokerage contracts were based on $20 to $25 per ton of manure. Several practical observations were made from the results:
Brokerage of litter may only be a viable alternative when the receiving cropland needs a complete fertilizer and when the N, P, and K contents of the manure are not diluted by water or bedding.
Manure brokerage is not economically sustainable if N is the only major nutrient needed by the receiving cropland.
Integrated farms that can use the manure produced by the poultry barns to fertilize their own cropland have the potential to reduce the legal and economic risk to the execution of a manure nutrient management plan.
Poultry farms that currently rely on litter brokerage as the only manure management plan are losing customers and need to look at other alternatives that provide a less risky and sustainable use for the mature produced.
Analysis of the impact of fluctuations in fertilizer price on litter produced from four broiler houses indicated that the full value of the litter ranged from $22,672 to $62,066 per year. The P2O5 contained in the litter accounted for the majority of the fertilizer value (37% to 54%). As a result, complete utilization of litter phosphorous in a crop rotation is the key to realizing the maximum value from litter.
Author
John P. Chastain, Ph.D., Professor and Extension Agricultural Engineer
Department of Agricultural Sciences, Agricultural Mechanization & Business Program, Clemson University, 245 McAdams Hall, Clemson, SC 29634-0312
jchstn@clemson.edu
Sources of Additional Information
Chastain, J.P., J.J. Camberato, and P. Skewes. (2001). Poultry Manure Production and Nutrient Content. Chapter 3B in Confined Animal Manure Managers Certification Program Manual: Poultry Version, Clemson University Extension, Clemson SC, pp 3b-1 to 3b-17. Available at: https://www.clemson.edu/extension/camm/manuals/poultry_toc.html
USDA-SC (2016). Dept of Ag Market News, South Carolina Crop Production Report Dec. 8.
Zublena, J.P., J.V. Baird, and J.P. Lilly. (1997). SoilFacts: Nutrient Content of Fertilizer and Organic Materials (AG-439-18).
Acknowledgements
This study was supported by the Clemson Extension Confined Animal Manure Managers Program.
The authors are solely responsible for the content of these proceedings. The technical information does not necessarily reflect the official position of the sponsoring agencies or institutions represented by planning committee members, and inclusion and distribution herein does not constitute an endorsement of views expressed by the same. Printed materials included herein are not refereed publications. Citations should appear as follows. EXAMPLE: Authors. 2019. Title of presentation. Waste to Worth. Minneapolis, MN. April 22-26, 2019. URL of this page. Accessed on: today’s date.
This presentation will provide an overview of Pennsylvania’s Commercial Manure Hauler and Broker Certification program and highlight results of the industry survey. Pennsylvania’s Manure Hauler and Broker Certification Program was mandated by state law in 2006. The unique program has five certification levels, each with unique education requirements (Table 1). In 2018, a survey was completed by 218 certified individuals at eleven Continuing Education Credit events.
Analysis of the survey revealed a significant positive relationship between certification level and score on knowledge questions. Company owners, managers and supervisors are required to attend more educational programs, and these individuals scored higher on knowledge questions than their employees. Those individuals surveyed worked on an average of 38.5 farms per year. Results of the survey indicated that the program empowers industry professionals with science-based knowledge. Thus, enabling wise field-level decisions across many farms, acres, and manure handling scenarios with positive implications on water quality.
The goals of the survey were to 1) gather descriptive information about certified individuals, 2) test certified individual on key program competencies, and 3) use test results as a tool for evaluation of educational impact and shortfalls to guide future programming. Furthermore, results can validate program effectiveness in discussions with local, state, and federal agencies. Such a body of facts is pertinent and timely as governmental agencies and agricultural interest groups work together to meet goals established for the Chesapeake Bay and beyond.
Program educators feel that survey results supported their thoughts that educational efforts and certification help the industry to continually improve responsible handling of manure nutrients in the state and affirm that these programs have real favorable impacts on water and air quality.
A peer-reviewed journal article is expected to be available later in 2019 that will include greater depth of information on the program and survey.
Table 1: Description of Certification Levels and Continuing Education Credit (CEC) requirements of Pennsylvania’s Commercial Manure Hauler and Broker Certification Program.
Certification Level
Brief Description
Certification Education Requirements
Continuing Education Credit (CEC) Requirements
Manure Hauler Level 1
Transport but not land-apply manure.
Completes verification form and understanding checklist.
None. Must complete checklist annually.
Manure Hauler Level 2
Transport and land-apply manure. Must be supervised.
Studies workbook and completes examination at county office.
6 CECs in 3-year period.
Manure Hauler Level 3
Owner or manager. Can supervise Hauler Level 2 ‘s.
Attends Act 49 Orientation certification class and completes examination.
9 CECs in 3-year period.
Manure Broker Level 1
Assumes ownership of manure and determines its end-use. Cannot write Nutrient Balance Sheet. Can supervise Hauler Level 2 ‘s.
Attends Act 49 Orientation certification class and completes examination.
9 CECs in 3-year period.
Manure Broker Level 2
Assumes ownership of manure and determines its end-use. Can write Nutrient Balance Sheet. Can supervise Hauler Level 2 ‘s. Can take additional course to write P-Index plans.
Attends Act 49 Orientation certification class and completes examination. Attends Nutrient Balance Sheet class and completes examination.
12 CECs in 3-year period, 3 or more of which must be specific to Nutrient Balance Sheets.
The authors are solely responsible for the content of these proceedings. The technical information does not necessarily reflect the official position of the sponsoring agencies or institutions represented by planning committee members, and inclusion and distribution herein does not constitute an endorsement of views expressed by the same. Printed materials included herein are not refereed publications. Citations should appear as follows. EXAMPLE: Authors. 2019. Title of presentation. Waste to Worth. Minneapolis, MN. April 22-26, 2019. URL of this page. Accessed on: today’s date.
The recent development of the Newtrient on-line catalog (www.newtrient.com/Catalog/Technology-Catalog; see accompanying conference proceedings about the catalog) revealed the need to establish a set of environmental and farm operational based critical indicators (CIs). The indicators are useful in identifying manure treatment technologies that primarily best address dairy farm environmental sustainability but include some social aspects.
What did we do?
The Newtrient Technical Advancement Team, comprised of academic and industry professionals in dairy manure management, developed and implemented a novel methodology that identifies technologies that best address dairy farm sustainability mainly from an environmental but also from a social perspective. A project-amended process used by the International Organization for Standardization (ISO) was used as the basis for methodology development; the methodology is known as the Newtrient Evaluation and Assessment of Technology (NEAT) process.
For this work, six specific CIs were selected based on key environmental challenges/opportunities facing the dairy industry; they are: nitrogen recovery, phosphorus recovery, liquid manure storage requirements, greenhouse gas reduction, odor reduction, and pathogen reduction. A literature search was performed to evaluate 20 manure treatment technology types under five technology categories (Table 1).
A scoring system relative to the baseline condition of long-term (anaerobic) manure storage was developed and applied to each technology type and an appropriate relative score for each CI was determined. The NEAT results are presented in an easy to understand dashboard called the NEAT Matrix (Figure 1).
What have we learned?
Use of the NEAT process across the 20 manure treatment technology types confirms that there is no single technology type that can address all the environmental and operational indicators. An integrated manure management system that is comprised of strategically selected technologies may be assembled to move each dairy farm toward sustainability.
Table 1. Technology categories and associated manure treatment technology types evaluated using the Newtrient Evaluation and Assessment of Technology (NEAT).
Technology Category
Evaluated Technology Types
Primary solid-liquid separation
Centrifuge
Rotary screen
Screw press
Slope screen
Secondary solid-liquid separation
Clean water membrane
Evaporative technologies
Ultrafiltration membrane
Physical and biochemical stabilization
Active solids drying
Composting
Drum composter bedding
Surface aeration
Nutrient recovery
Ammonia stripping
Chemical flocculation
Struvite crystallization
Nitrification/denitrification
Energy recovery
Anaerobic digestion
Gasification
Hydrothermal Carbonization
Pyrolysis
Torrefaction
Figure 1. Generic example of the Newtrient Evaluation and Assessment of Technology (NEAT) Matrix
Future Plans
Future research in this area will continue to focus on using NEAT to evaluate integrated manure management systems designed specifically to achieve farm goals/needs.
Corresponding author, title, and affiliation
Curt Gooch, Environmental Systems Engineer, PRO-DAIRY Dairy Environmental System Program, Dept. of Animal Science, Cornell University.
cag26@cornell.edu
Other authors
Mark Stoermann (Newtrient, LLC), Garth Boyd (Context), Dana Kirk (Michigan State University), Craig Frear (Regenis), and Frank Mitloehner (UC Davis).
Additional information
Additional project information, is available on the Newtrient website: www.newtrient.com
Acknowledgements
Newtrient, LCC and the paper authors thank the following supporters of Newtrient: Agri-Mark, Inc., Dairy Farmers of America, Inc., Dairy Management Inc., Foremost Farms USA, Land O’Lakes, Inc., Maryland Virginia Milk Producers Cooperative Association, Inc., Michigan Milk Producers, National Milk Producers Federation, Prairie Farms Dairy, Inc., Select Milk Producers, Inc., Southeast Milk, Inc., St. Albans Cooperative Creamery, Tillamook County Creamery Association, and United Dairymen of Arizona
The authors are solely responsible for the content of these proceedings. The technical information does not necessarily reflect the official position of the sponsoring agencies or institutions represented by planning committee members, and inclusion and distribution herein does not constitute an endorsement of views expressed by the same. Printed materials included herein are not refereed publications. Citations should appear as follows. EXAMPLE: Authors. 2019. Title of presentation. Waste to Worth. Minneapolis, MN. April 22-26, 2019. URL of this page. Accessed on: today’s date.
Conceptualizing, modeling, and controlling carbon flows at the farm scale can improve efficiency in production, reduce costs, and promote beneficial products and byproducts of agricultural processes through best management practices. On dairy farms, opportunities exist for farmers to control factors affecting greenhouse gas (GHG) emissions and diversions from production and operations. Complex programs to model the effects of different carbon management strategies on net emissions are very useful to farmers, but lack visualization of flows through a user interface to show effects of different management choices in real time.
Previously, a collaborative research team at Penn State University and the University of Wisconsin-Madison has developed a Virtual Dairy Farm website to share information about how dairy farms incorporate best management practices and other on-farm production choices to reduce environmental impacts. The website is organized in two model farm configurations, a 150-cow and a 1500-cow modern dairy farm. Website users can find information on different components of the farm by exploring locations on the farm. Links to information about farm operations are structured in multiple levels such that information is understandable to the general public but also supported by technical factsheets for agriculture professionals.
What did we do?
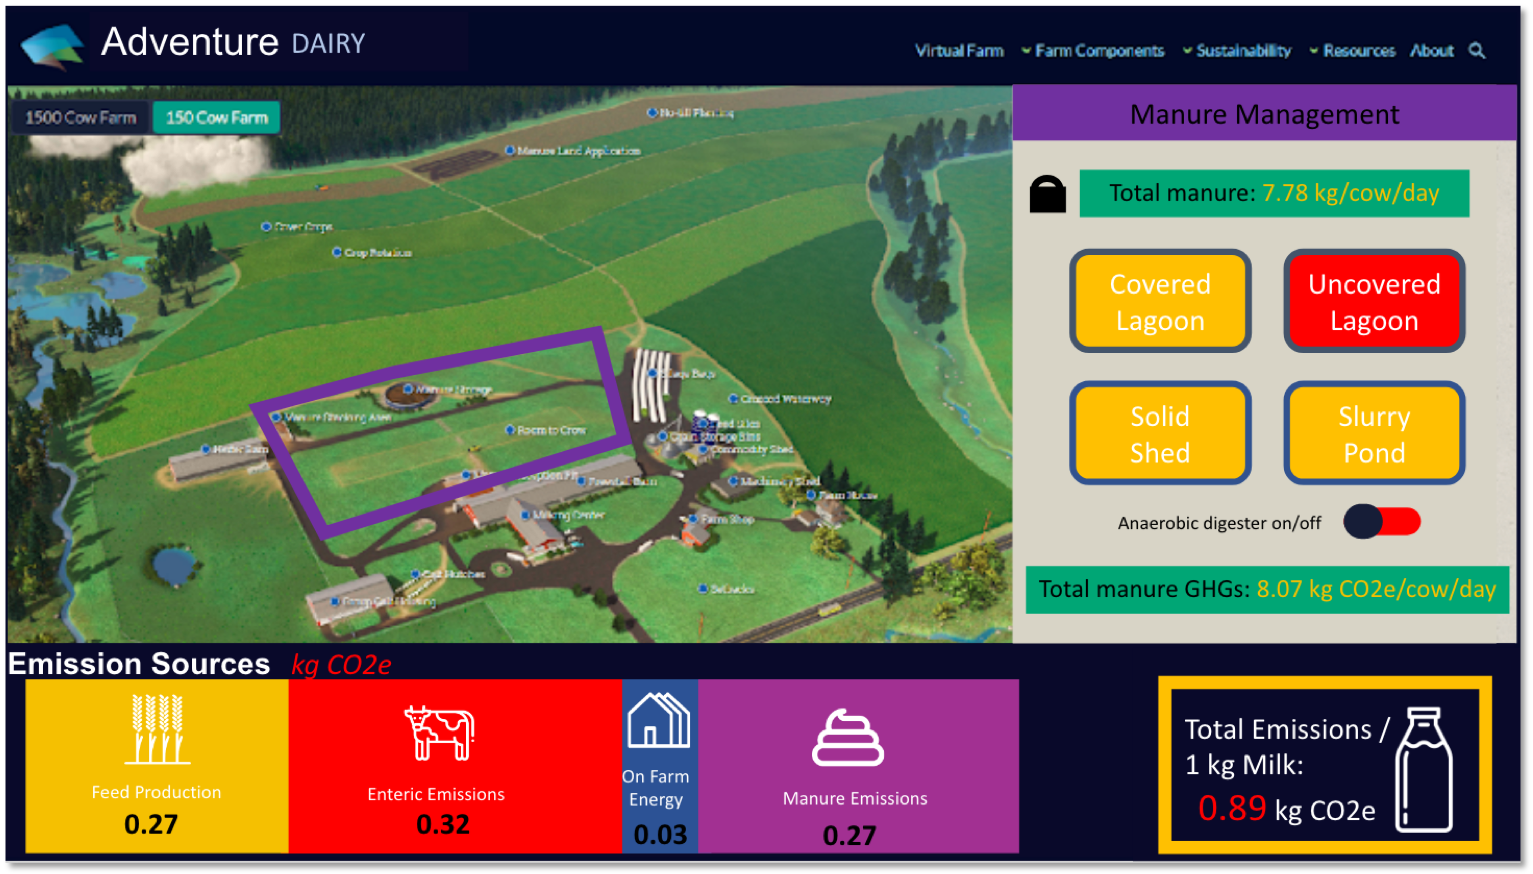
Building on the strengths of the Penn State Virtual Dairy Farm interactive website, the Team has developed a concept for an “Adventure Dairy” package for users to explore how management choices affect total on-farm GHG emissions for a model Pennsylvania dairy farm (Figure 1). Five main categories serve as management portals superimposed on the Virtual Dairy interface, including Cow Life Cycle, Manure Management, Crop Production, Energy Use on Farm, and Feed on Farm.
Figure 1. Example landing page for the proposed Adventure Dairy website. Different regions to explore to access the GHG emissions calculator are highlighted in different colors.
For each category, users can select from multiple options to see how these decisions increase or decrease emissions. Along the bottom of the webpage, a calculator displays the net carbon balance for the model system and change emissions estimates as users choose feed composition, land use strategies, and other important components (Figure 2). Under each category, users can make choices about different management practices that affect on-farm carbon cycling. For example, different choices for feed additives change total net GHG emissions, and, in turn, can affect total manure production. A change in management and operational choices, such as storage, is visually communicated through interactions and on the interface (Figure 3). These management portals can be seamlessly integrated with the Virtual Dairy Farm as an addition to the right sidebar. The click-through factsheets currently a part of the interface can be preserved through new informational “fast facts” overlays with accompanying infographics and charts. Pathways to optimizing carbon flows to ensure maximum production and minimum environmental impact will be featured as “demo” examples for users.
Figure 2. Example Adventure Dairy user interface for manure management. User choices to increase and decrease total GHG emissions are included in the right sidebar. Along the bottom of the page, a ribbon shows the total emissions from each category.Figure 3. A different user choice for manure storage type on the Adventure Dairy interface. Total GHG emissions decrease by 14% because of the switch from an uncovered to a covered anaerobic lagoon because of reduced volatilization of methane.
What have we learned?
This model offers a novel platform for more interactive software programs and websites for on-farm modeling of carbon emissions and will inform future farm management visualizations and data analysis program interfaces. The Team envisions the Adventure Dairy platform as an important tool for Extension specialists to share information with dairy professionals about managing carbon flows on-farm. Simultaneously, consumers increasingly seek information on the environmental impacts of agriculture. This interactive website is a valuable educational and technical tool for a variety of audiences.
Uniquely, a multidisciplinary team of agriculture and engineering graduate students from multiple institutions are leading this project, as facilitated by faculty. This Cohort Challenge model allows for graduate students to engage with complex food-energy-water nexus problems at the level of faculty investigators in a virtual educational resource center. Future INFEWS-ER teams and “wicked problems” challenge projects will continue to develop this model of learning and producing novel research products.
Future plans
The Cohort Challenge Team is entering a peer/faculty review process of the simplified carbon model for the Virtual Dairy Farm website. The user interface for the Adventure Dairy calculator is not currently a part of the Penn State Virtual Dairy Farm. The Team will be working with software developers to integrate our model in the existing interface. Additional components under consideration for inclusion in the Adventure Dairy calculator include cost comparisons for different best management practices, an expanded crop production best management calculator, and incorporation of
Authors
Student Team: Margaret Carolan,1 Joseph Burke,2 Kirby Krogstad,3 Joslyn Mendez,4 Anna Naranjo,4 and Breanna Roque4
Project Leads: Deanne Meyer,4 Richard Koelsch,3 Eileen Fabian,5 and Rebecca Larson6
Department of Civil and Environmental Engineering, University of Iowa, Iowa City, IA crln@uiowa.edu
Texas A&M University
University of Nebraska-Lincoln
University of California-Davis
Penn State University
University of Wisconsin-Madison
Acknowledgements
Funding for the INFEWS-ER was provided by the National Science Foundation #1639340. Additional support was provided by the National Institute for Food and Agriculture’s Sustainable Dairy CAP and the National Center for Supercomputing Applications at the University of Illinois at Urbana-Champaign.
The authors are solely responsible for the content of these proceedings. The technical information does not necessarily reflect the official position of the sponsoring agencies or institutions represented by planning committee members, and inclusion and distribution herein does not constitute an endorsement of views expressed by the same. Printed materials included herein are not refereed publications. Citations should appear as follows. EXAMPLE: Authors. 2019. Title of presentation. Waste to Worth. Minneapolis, MN. April 22-26, 2019. URL of this page. Accessed on: today’s date.
Growth in the livestock and poultry industries in Nebraska faces hurdles is greatly influenced by county zoning and local decision-making. Variation in policies from one county to the next and in decisions made by county boards creates significant challenges for agricultural operations and for local communities looking to remain vibrant and grow. Many were requesting that a common tool be developed for county officials to use that would bring greater consistency and objectivity to the evaluation of proposals to expand animal feeding operations.
What was done?
In 2015, the Nebraska Legislature passed legislation (LB106) that directed the Nebraska Department of Agriculture to convene a committee of experts to develop an assessment matrix for livestock development. A 10-person advisory committee, including county officials, livestock industry representatives, and me [representing the University of Nebraska] was approved by Governor Ricketts later that year. In keeping with directions outlined in Nebraska LB106, the committee:
Reviewed tools already developed by counties in Nebraska and by other states, mainly those used in Iowa and Wisconsin.
Developed a tool (Excel spreadsheet or pdf) that produces quantifiable results based upon scoring of objective criteria;
Made concerted efforts to assure that the tool is practical to use when applying for conditional-use permits or special exceptions and when county officials score these applications; and
Ensured that all criteria had definite point selections and provided a minimum threshold total score that is required to ‘pass’.
In 2016, the resulting Nebraska Livestock Siting Assessment Matrix (‘Livestock Matrix’) was posted for comments and approved for dissemination by the Nebraska Department of Agriculture. The Livestock Matrix was recently reviewed and updated by the advisory committee, and the current version is available for public access at http://www.nda.nebraska.gov/promotion/livestock_matrix/index.html.
What we have learned?
Development of the Livestock Matrix was a highly formative process. Overall, the factors that consumed the vast majority of discussion and effort involved the following:
Need for simplicity. Strong sentiments were expressed that the Livestock Matrix should be easy to complete, with little or no need for assembling additional information or consultation.
Desire for transparency. Clarity was paramount, with parties on both sides expecting to see numbers and requirements specified up front, which excluded process-based approaches.
Questions of merit. Many ‘generally good ideas’ and recommendations were removed when benefits were not well understood or defined, or a practice was considered an industry norm.
Will to retain control. Perceived loss of control or potential for new regulation ended discussion of some ideas that otherwise had merit.
Voluntary tool:
LB106 specified that the matrix be “Designed to promote the growth and viability of animal agriculture in this state”, and as a result, the advisory committee was comprised of supporters of [responsible growth of] the livestock and poultry industries. Support for local control runs deep in Nebraska, though, and one of the most significant hurdles arose early on due to amended language in the final bill, “…develop an assessment matrix which may be used by county officials to determine whether to approve or disapprove” applications. Voluntary consideration and adoption of the Livestock Matrix at local levels totally changed the nature of the discussions, and made it very challenging to develop a single tool that would have widespread appeal and rate of adoption, virtually guaranteeing that varied policies and practices would still exist. Despite this challenge, the matrix committee pushed through to develop a ‘template tool’, which has been adopted – either as is or as a template – by some counties.
County setbacks:
The next major hurdle faced was how to handle county setback distances. With the Livestock Matrix being voluntary, it quickly became clear that county officials were not going to adopt a tool that limited their use of and control over setback distance requirements. After mulling over options, the committee decided that satisfying the county’s setback requirement would be the primary criterion for obtaining 30 of the 75 points needed to receive a passing score. To promote positive change, the committee developed sets of sliding-scale ‘base separation distances for odor’ using an approach that drew from the science-based Nebraska Odor Footprint Tool (NOFT). The intent was that county officials would use these distances [preferably] in establishing county setbacks or as an alternative approach that could be accepted by a county. Direct use of the NOFT and inherent NOFT concepts within the Livestock Matrix was greatly limited by concerns over the NOFT requiring additional work of applicants, not being sufficiently transparent, and not being applicable for all applicants (esp. open-lot cattle feeders).
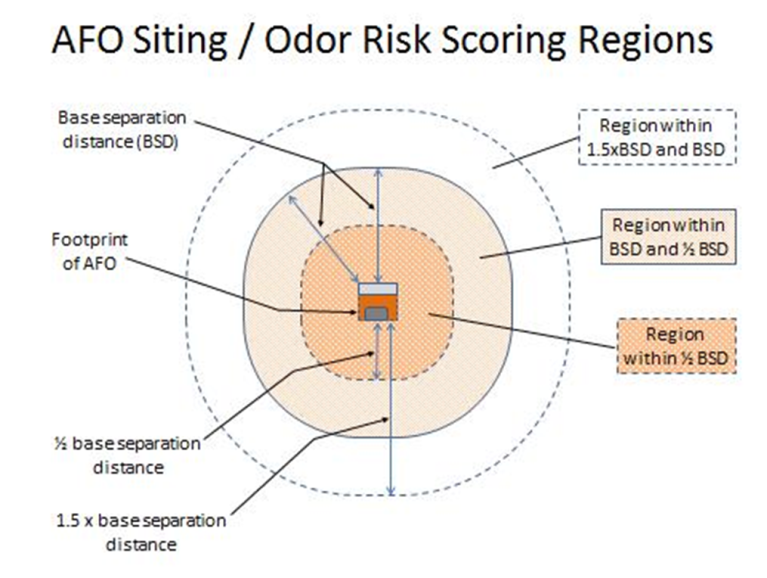
The idea of using ‘transitional planning zones’ that add or deduct points based upon consideration of locations of all residents within 1.5 times the separation distance for odor is presented in the alternative approach (Figure 1).
Figure 1. Illustration of planning zones for assessing odor risk.
The intent was to bring more information into decisions than just what is the distance to the closest neighbor relative to the county setback. The zones are mainly presented for information purposes, as there was considerable hesitance to adopt a scoring system that was not considered sufficiently simple and transparent to merit replacing a set separation distance being the criterion.
Water quality / permits:
Committee members shared the view that a proposed expansion that would secure required environmental permits (via Nebraska Department of Environmental Quality, NDEQ) and meet the county’s setback requirement, if any, should generally earn a passing score and not be exposed to local requirements that are often employed to delay and deter operations from expanding. There was disagreement, however, on whether an applicant should need to complete the rest of the assessment if these two conditions were met. This issue weighed the applicant’s time and effort completing the assessment against the potential that glaring concerns (point deductions) may arise in another area and that communities may not see the matrix as being comprehensive and credible. The current matrix conveys an expectation that all main sections be scored, but has been streamlined to minimize required time and effort.
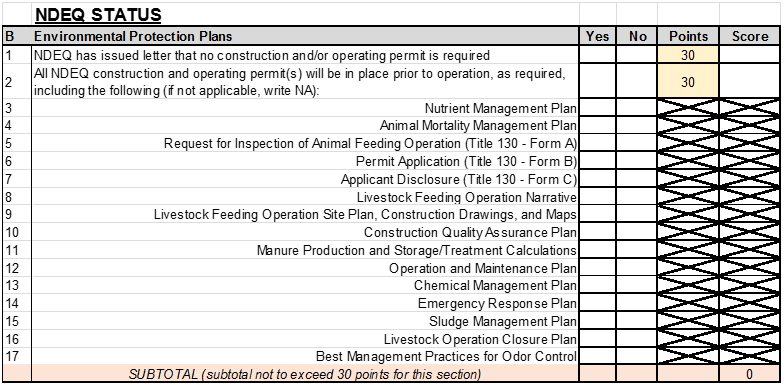
There were also differing views on whether the Livestock Matrix should highlight the various water quality protections that would be put in place or simply that NDEQ requirements would be satisfied. While there was significant early interest by several committee members to promote and educate the public on stewardship practices required of permitted feeding operations, the desire to reinforce the value of determinations made by NDEQ and to keep the tool very practical to complete and assess carried in the end. As a result, applicants must indicate that NDEQ approval has been or will be secured to obtain 30 of the 75 points needed to receive a passing score (Figure 2), while indication of the practices that will be implemented is encouraged, but does not affect the score received.
Figure 2. Section to be completed within the Livestock Matrix that addresses environmental protection plans and permits.
This section of the Livestock Matrix arose was discussed again as the committee considered those applicants who would receive a letter from NDEQ stating that a permit would not be required – primarily applicable to small animal feeding operations and operations that involved dry manure. The challenge presented was, ‘Does having official approval to go forward without needing a permit offer the same protections and merit the same points as would exist if required plans were developed to secure permits?’ The issue became prominent when a broiler processing facility was approved for construction, which required constructing hundreds of new broiler (chicken) houses in the state, none of which would likely require an NDEQ permit. The main concern was that such facilities could be approved without having nutrient management plans (and a few other desired plans) in place to limit potential nutrient loading of ground and surface waters from application of manure at rates exceeding crop needs. The company associated with the current large poultry expansion took a proactive stance and internally requires all of its growers to have nutrient management plans in place and qualify for an NDEQ permit, resolving the immediate concerns, but not the longer-term issue with the Livestock Matrix. The committee will continue to examine ways to better highlight and reinforce the importance of nutrient management within the Livestock Matrix without suggesting changes in NDEQ regulation.
Other environmental sections:
Six more sections address various environmental risks and protections, including:
Environmental and zoning compliance record
Water quality protection – livestock facilities
Odor and dust control for facilities
Manure application practices
Manure application separation
Additional assurance of environmental protection
Each of these sections was refined down to a list of items that the committee believed merited inclusion in determining the total score.
Non-environmental sections:
Additional sections address other topics such as:
Traffic
Locations of the authorized representative and the site manager relative to the facility
Communication with the community
Economic impact
Landscaping and aesthetics
Each of these areas was well-understood to influence acceptance by the community. Probably the biggest challenge for the committee was assigning appropriate section scores and total passing scores to value the importance of these areas without suggesting that an environmentally risky application could achieve a passing score through strong scores in these other areas.
Impacts and Implications
In developing the Nebraska Livestock Siting Assessment Matrix, the committee made available a well-critiqued tool for voluntary consideration by county officials. Overall, the Livestock Matrix strikes a sometimes uncomfortable balance between being comprehensive and scientifically correct and being transparent and easy to use. Although the Livestock Matrix will likely fall short of the original goal of achieving consistency and uniformity in Nebraska’s county zoning policies and practices, county officials are considering the matrix as a template zoning tool or as a gauge for evaluating and adjusting current policy.
Next Steps
The Nebraska Department of Agriculture is continuing to promote adoption of the Nebraska Livestock Siting Assessment Matrix, especially to counties looking to be officially designated as “Livestock Friendly”. The matrix will be evaluated again in 1-2 years.
Authors
Richard R. (Rick) Stowell, Extension Specialist – Animal Environment, Rick.Stowell@unl.edu
The other members serving on the committee included: John Csukker; Elizabeth Doerr, Leon Kolbet, Dean Krueger, Mark McHargue, Jennifer Myers, Sarah Pillen, Andrew Scholting, Steve Sill.
The authors are solely responsible for the content of these proceedings. The technical information does not necessarily reflect the official position of the sponsoring agencies or institutions represented by planning committee members, and inclusion and distribution herein does not constitute an endorsement of views expressed by the same. Printed materials included herein are not refereed publications. Citations should appear as follows. EXAMPLE: Authors. 2019. Title of presentation. Waste to Worth. Minneapolis, MN. April 22-26, 2019. URL of this page. Accessed on: today’s date.
The purpose of this project was to demonstrate a mobile fluidized-bed cone for extraction of phosphorus in the form of struvite (magnesium-ammonium phosphate) from undigested (raw) liquid dairy manure. Since Ca binds inorganic P, a particular emphasis was placed on evaluating the effect of oxalic acid as an acidifier and Ca binder.
Dairies often have excess P in manure in relation to the need for on-farm crop production. Easily mineable reserves of phosphorus (P) worldwide are limited, with a majority residing in Morocco (USGS 2013). One approach to recycling P is to capture excess P from dairy manure in the form of struvite for off-farm export as a nutrient source for crop production.
What we did
A portable trailer-mounted fluidized-bed cone (volume of 3200 L) was used to extract phosphorus in the form of struvite (magnesium-ammonium phosphate) from undigested (raw) liquid dairy manure. Batches of 13,000 liters of manure were evaluated and the system was operated at a flow rate of ~ 32 liters per minute. Sulfuric acid or oxalic acid-sulfuric acid were used to decrease the pH, and sodium hydroxide was used to raise the pH. Oxalic acid was chosen for evaluation due to its dual ability to decrease pH and bind calcium.
What we learned
Results of concentration of total P or ortho-P (OP) after manure treatment through the fluidized bed suggested no advantage of the combination of oxalic acid with sulfuric acid to decrease the concentration of P (see Figures 1 and 2). More detailed analyses of centrifuged post-bed samples of manure effluent indicated that the oxalic acid was binding the free calcium, but the resulting Ca compounds remained suspended in the effluent. Centrifuged manure samples had Ca contents ~23% of un-centrifuged samples when oxalic/sulfuric acid was used as a pH reducer. Centrifuged manure samples had Ca contents ~84% of un-centrifuged samples when sulfuric acid was used as a pH reducer. With raw manure, oxalate does not appear to be beneficial, unless there is a more effective step to drop Ca-oxalate out of suspension, such as centrifuging.
Figure 1. Concentration of OP or P in manure after pre-treatment with oxalic and sulfuric acid.
Figure 2. Concentration of OP or P in manure after pre-treatment with sulfuric acid.
Future Plans
Anaerobically digested (AD) manure will be evaluated with the same set of conditions that were utilized with raw dairy manure to determine potential benefits of using oxalic acid with AD manure.
Authors
Joe Harrison1, Kevin Fullerton1, Elizabeth Whitefield1, and Keith Bowers2.
1Washington State University
2Multiform Harvest
jhharrison@wsu.edu
Citations and video links
U.S. Geological Survey, Mineral Commodity Summaries, January 2013. http://minerals.usgs.gov/minerals/pubs/commodity/phosphate_rock/mcs-2013-phosp.pdf
Dairy Struvite Video: Capturing Phosphorus from Dairy Manure in the Form of Struvite on 30 Dairy Farms in WA state
Alfalfa Struvite Video: Struvite, a Recycled Form of Phosphorus from Dairy Manure, used as Fertilizer for Alfalfa Production
Acknowledgements
This project funded by the USDA NRCS CIG program and the Dairy Farmers of Washington.
The authors are solely responsible for the content of these proceedings. The technical information does not necessarily reflect the official position of the sponsoring agencies or institutions represented by planning committee members, and inclusion and distribution herein does not constitute an endorsement of views expressed by the same. Printed materials included herein are not refereed publications. Citations should appear as follows. EXAMPLE: Authors. 2019. Title of presentation. Waste to Worth. Minneapolis, MN. April 22-26, 2019. URL of this page. Accessed on: today’s date.
Aerobic treatment has potential to be more practical for any size operation, reduce odors, reduce risk of runoff by facilitating application to growing crops, and reduce energy use when distributing manure nutrients.
Farm-based aeration, created through an upward/outward surface flow, was first introduced in the 1970’s and brought partial success. With significant performance issues, challenges with struvite within manure recycling pipes/pumps, and the growing trend to store manure within pits under barns, further research with manure aeration was largely abandoned. Very little research has been done on aerobic treatment within manure storage systems since traditional aeration using air blowers has been considered too expensive. Previous research sought to mimic traditional domestic wastewater treatment systems which also purposely perform denitrification. Not always a goal for farm operations in years past, retaining Nitrogen within wastes used as fertilizer is now usually a goal. Thus, past aerobic treatment systems were not designed to fully benefit today’s modern farms.
In 2006, hog producers were introduced to an updated version of equipment providing Widespreading Induced Surface Exchange (WISE) aeration, specifically for reducing hog manure odor while irrigating lagoon effluent. The results became a “wonder” for the site’s CAFO permit engineer. Documentation showed that significant aeration was occurring at a rate much higher than could occur with the energy input used by traditional bubble blowers. This indicated that aeration of manure ponds and lagoons may not be too expensive after all. More questions led to a USDA NRCS-supported study, which revealed much more information and brought out more questions. The final report of that study is available at http://pondlift.com/more-info/, along with other information on the technologies described.
The NRCS-funded study revealed the basis for previous performance failures, while it also showed the basis for getting positive aeration performance at liquid manure storage sites: Ultimately, this information showed that large reductions of manure odor can be obtained while offering a new paradigm for eliminating most potential manure runoff through WISE aeration as the first step.
The paradigm change summary:
Aeration provides aerobic bacteria based manure decomposition while in storage.
Aerobic bacteria produce only carbon dioxide, which is considered carbon neutral when converting manure’s nutrients to fertilizer, reduced greenhouse gas (Aerobic gives off no other greenhouse gasses such as methane or oxides, and few odors)
“No odor” allows direct distribution of decomposed manure nutrients onto crops during growing season. (Distribution is done during growing season, using automated irrigation equipment).
Low-cost automated manure distribution reduces farm operation costs, but also allows the nutrients to be distributed to equal acres during a wider application time frame (not limited to when crop land is barren in spring or before fall freezeup.)
A wider application time frame allows multiple applications at smaller doses onto growing crops. Depending on nutrient application goals and equipment, irrigation rates can be as little as 1/8th inch of water, multiple times through the year, instead of one large dose.
Irrigation equipment is likely not operating when potential runoff conditions are pending, especially when the entire spring/summer/fall periods are available for distribution.
When nutrients are applied onto growing crops at low dosage rates during periods when irrigation is desired, very little potential for runoff is present. Only a small portion of 1/8” of water onto a crop canopy rarely reaches the ground. The nutrient rich water quickly binds with the dry surface soil when it does get past the crop canopy during summer application.
Current manure distribution distribution requires that most farmers fight to get raw manure distributed onto cropland before spring planting (which is often a wet time of year), OR after crops are harvested and bales removed. Although farmers and regulators wish that all manure handling is performed before freezeup, it is not the case: It happens more than anyone admits. Manure application to frozen ground is an understated and unquantified manure runoff cause. Such runoff can be eliminated by the new paradigm of application onto growing crops.
Further, the “side use” of treated effluent has significant benefit compared to raw manure. Aerobic Bacteria-Laden Effluent (ABLE water) is extremely proficient in its use within flume systems and for automatic flushing of alleys. The aerobic bacteria within the treated water is “hungry” to go to work, to pick up fresh food as it passes over the floor/alley, on its way back to the storage pond.
The layman’s explanation is similar to urban water delivery pipes and wastewater pipes buried within city streets:
Historically, dairy operators quickly learned that fresh well water will create a “slime” on surfaces, causing extremely slippery floors and alleys which injure cows. To eliminate much of the slipperiness, they stopped using fresh water and instead used raw manure from the pond. In many cases, they would add water to the pond, when manure got too thick and again caused slippery areas.
Unseen by most people are the 2 pipe systems under streets carrying our water and sewer. Factually, one pipe has slime, and the other pipe is amazingly clean: While acknowledging the newspaper notices that fire hydrants are going to be “flushed” several times/year, most don’t realize the purpose for doing so is to flush the slime from our drinking water pipes! The slime is not toxic to humans due to chlorination, but its buildup reduces pipe capacity, and its color is unpleasant to see in drinking water. In the case of unaerated fresh water used at farms, it tends to grow the slime that dairymen simply can’t afford on their alleys/floors.
Meanwhile, most people won’t look into a sewer manhole to note how “clean as a dinner plate” it looks! Sewerage pipes are designed for high capacity peak flow but normally runn at very low levels. This allows tremendous aeration activity within the system as water tumbles at manholes and as flows change direction. Thus, the aeration, food, and bacteria within properly operating sewer systems have very little odor, with the bacteria laden effluent continuously cleaning the sewer pipe. Sewer Pipes indeed look “brand new” even after operating for decades! Those who effectively aerate their manure pond water so they have high aerobic populations within the effluent, and use that effluent for flushing alleys and flumes are quite happy with the resultant cleaning of the alleys, floors, and flumes.
Lastly, ABLE water likely has traits of “compost tea”: Compost Tea is made by steeping in water, a quantity of completed compost, rich with soluble nutrients, bacteria, fungi, protozoa, nematodes and microarthropods. After removing the steeped compost solids, the remaining effluent is rich with those items recognized by many as necessary for building the soil and most effective for plant growth. The tea is to be used quite soon after it is created, but aeration can lengthen the storage period. Within aerobically treated manure ponds, because aeration is being performed continuously, compost tea-like benefits are anticipated to be included to crops having the WISE treated effluent application.
What did we do?
A basic hypothesis for WISE technology was developed in 2014 to explain why aeration levels are significantly higher compared to bubble blower technology. This hypothesis explains how/why results are being obtained and allows purposeful thought on how to maximize performance.
Meanwhile, engineering solutions were developed for the two main issues of equipment available at the time: 1) Previous equipment was heavy and required boom trucks/cranes to install/remove it for servicing (250 to 900 lb.), and 2) The propeller orientation/shape would inherently draw in stringy material that wraps on the propeller shaft, which then requires removal (see problem 1). New equipment was designed that weighs less than 120 lb. and is easily installed by hand (Figure 1).
Figure 1. One of two WISE technology models, this for open ponds (44” wide). The other model fits through a doorway to be installed in the manure storage pits of deep-pit hog barns.
What have we learned?
After years of testing the new design, the equipment proved to be able to operate without inviting stringy material to wrap on the propeller and to be easy to handle by hand. The design was declared an engineering success and marketing began.
In addition, nitrogen retention rates for aerobic manure treatment are much higher than published, most likely due to the traditional domestic wastewater treatment process assumptions of the 1970’s and the use of partial aeration, due to high costs of bubble blowers, instead of continuous aeration used within WISE aeration activity.
Prior to the 2018 North American Manure Expo, data was collected at 3 different farms in the Brooking SD area, each farm having a different brand/style of providing aeration. Due to the uncontrolled variables, results varied within each farm and also varied from the other farms. Although no clear specific results were determined, one specific trend was that installing equipment at a higher operational rate (1 device/50 animal units) than the study used (1 device/70animal units), offered higher nitrogen retention than can be expected from the NRCS funded study, which is higher than currently published aeration rates. This leads me to believe that there may be some misunderstood biological process for retaining nitrogen within aerobically treated effluent using WISE aeration. It appears there are some things unequivocally misunderstood about aerobic manure treatment and the nutrients retained, most likely also associated with the items commonly identified/targeted with Compost Tea discussions. The potential for changing the current manure handling paradigm to one where odor is not an issue, and application of manure nutrients onto growing crops which might also reduce manure runoff warrants further study.
The presentation will also touch on some basic misunderstandings about ammonia/ammonium, provide “do’s” and “don’ts” of installations and/or studies, and identify additional subjects for study.
What are the next steps?
Associated technology is being developed to perform foliar application. If farmers can’t handle manure differently, why would they do additional work, just to distribute it the same way they do now? The presentation will include basic information for a Self-Propelled Extremely Wide Portable Linear Irrigator (SPEWPLI). This equipment is projected to be able to irrigate/fertigate a full 160-acre field in 5 passes, and then be quickly moved to the next field. It is anticipated that manure pumpers would use existing equipment to deliver liquid manure to fields and use the SPEWPLI equipment as an alternative to conventional drag-hose injection. Foliar feeding has proven beneficial, applying nutrients directly onto growing crops (in canopy) when they best increase yields. By changing the distribution window to summertime, farmers don’t need to apply only in spring or in fall, or leave fields un-planted so manure can be applied in the summer.
While most farmers will not spend money to buy technology which only rids manure of odor while they continue to handle it as they have in the past, since there is very little economic return for only controlling odor, there are other aspects of WISE aeration technology to provide economic return, which then provides odor relief as a “free” benefit.
More information is needed on the benefits of distributing manure nutrients directly to growing crops and on the economics of low-cost, automated systems.
More information is needed in maximizing aeration for the energy used by way of this technology.
More information is needed in how nitrogen can possibly be tied up and reserved by the other bacteria, fungi, protozoa, nematodes and microarthropods within compost tea-like effluent.
A listing of such subject study items, likely to be doctorate dissertation level projects, will be included in the presentation.
Because our brand resolves issues that other equipment has, we will make it available for academic study at field sites and for others to use for additional research in the use of WISE aeration technology.
The authors are solely responsible for the content of these proceedings. The technical information does not necessarily reflect the official position of the sponsoring agencies or institutions represented by planning committee members, and inclusion and distribution herein does not constitute an endorsement of views expressed by the same. Printed materials included herein are not refereed publications. Citations should appear as follows. EXAMPLE: Authors. 2019. Title of presentation. Waste to Worth. Minneapolis, MN. April 22-26, 2019. URL of this page. Accessed on: today’s date.
Many states have regulations that require education for livestock producers and manure applicators. Adults that must attend these types of programs are often there solely to fulfill requirements and are not willing learners. While regulations may specify topics that must be addressed, most do not spell out teaching methods for these educational programs. It is well known that active learning promotes better retention of the material. In Nebraska however, these programs traditionally have been a combination of pre-recorded and live PowerPoint presentations as they are easier to develop and for educators that may not be manure experts to host. In recent years, the Nebraska Animal Manure Management team has been working to make their manure training program more interactive. This workshop highlights hands-on activities related to odor management, stockpiling and transporting manure, and equipment calibration. Audience members are encouraged to bring examples of hands-on activities that they are using to share with others.
Purpose
One example of an interactive teaching tool. Shoebox calibration kits allow participants to simulate a manure calibration in the classroom.
The objective of this workshop is to encourage idea-sharing and collaboration in the development of activities and teaching techniques to better manure-related programming across state lines.
Lessons Learned in Nebraska in 2019
Hands-on activities have enhanced our programming in Nebraska by increasing participation during our training events. Participants can no longer sit back and watch videos (or pretend to watch videos). While we do not require testing to receive certification, we feel that we have really improved our program. We received more written feedback about the program in the “comments” section of the evaluation and often received praise for the instructors, which we had never gotten before. For most of the activities that we made major changes to, there was about a 20% improvement in the number of attendees that selected moderately high to significant knowledge improvement (3 or 4 on a scale of 0-4) when compared to the previous year’s evaluation results. Because on average we also had a 13% improvement for activities that were not drastically changed, this result may be skewed, but is still an interesting change. Looking at the data makes one wonder whether the increased interaction between and amongst participants and instructors resulted in higher marks overall because participants were generally more satisfied with the program – even those parts that were not changed.
The authors are solely responsible for the content of these proceedings. The technical information does not necessarily reflect the official position of the sponsoring agencies or institutions represented by planning committee members, and inclusion and distribution herein does not constitute an endorsement of views expressed by the same. Printed materials included herein are not refereed publications. Citations should appear as follows. EXAMPLE: Authors. 2019. Title of presentation. Waste to Worth. Minneapolis, MN. April 22-26, 2019. URL of this page. Accessed on: today’s date.
This two-part workshop exposes participants to a wide variety of existing and new technology, and how these applications can enhance learning and programming.
During each part of the session, there will be a series of short presentations, opportunity for sharing of ideas, followed by time to ask questions and try the tech at tables around the room.
Session moderated by Alison Holland, University of Minnesota Extension
Part 1: Bringing Science to Life Through Immersive Imagery and 3-D Modeling
Megan Weber and Angela Gupta, University of Minnesota Extension
Lecture-free, interactive online course
3D IS models
Augmented reality in IS
360-imagery
Part 2: New Education and Engagement Strategies with Familiar Tech Tools
Pollinator Qualtrics Survey
Julie Weisenhorn, University of Minnesota Extension
Qualtrics: Not Just for Surveys Anymore! Create Online Modules & Learning Centers
Abby Neu, University of Minnesota Extension
Mapping for Teaching and Showing Program Impact
Alison Holland, University of Minnesota Extension
The authors are solely responsible for the content of these proceedings. The technical information does not necessarily reflect the official position of the sponsoring agencies or institutions represented by planning committee members, and inclusion and distribution herein does not constitute an endorsement of views expressed by the same. Printed materials included herein are not refereed publications. Citations should appear as follows. EXAMPLE: Authors. 2019. Title of presentation. Waste to Worth. Minneapolis, MN. April 22-26, 2019. URL of this page. Accessed on: today’s date.
Manage Cookie Consent
To provide the best experiences, we use technologies like cookies to store and/or access device information. Consenting to these technologies will allow us to process data such as browsing behavior or unique IDs on this site. Not consenting or withdrawing consent, may adversely affect certain features and functions.
Functional
Always active
The technical storage or access is strictly necessary for the legitimate purpose of enabling the use of a specific service explicitly requested by the subscriber or user, or for the sole purpose of carrying out the transmission of a communication over an electronic communications network.
Preferences
The technical storage or access is necessary for the legitimate purpose of storing preferences that are not requested by the subscriber or user.
Statistics
The technical storage or access that is used exclusively for statistical purposes.The technical storage or access that is used exclusively for anonymous statistical purposes. Without a subpoena, voluntary compliance on the part of your Internet Service Provider, or additional records from a third party, information stored or retrieved for this purpose alone cannot usually be used to identify you.
Marketing
The technical storage or access is required to create user profiles to send advertising, or to track the user on a website or across several websites for similar marketing purposes.