NRCS has a new technical document entitled “Solid-Liquid Separation Alternatives for Manure Handling and Treatment.” It was created through efforts from Dr. John Chastain, Clemson University with funding provided by USDA-NRCS.
This document brings together both the theory behind solid-liquid separation and the practical application of many different separation technologies. Several farm scale demonstration projects are also summarized in the report. Solid-liquid separation can serve to achieve many livestock operational objectives such as nutrient partitioning, improved pumping characteristics, solids removal from storage facilities and reduced organic loadings. The use of separation technologies is essential for many operations and has become an integral part of the efficient performance of these livestock facilities. Some of the purposes and uses of this document include assisting in solid-liquid separation technology selection, evaluating separation performance, and quantifying the impact of solid-liquid separation on manure management. This presentation provides an overview of this document including methods of solid-liquid separation, influence of manure characteristics and handling methods, fundamentals of solid-liquid separation, performance of various solid-liquid separation technologies, unique separation technologies and applications and design considerations.
What Did We Do?
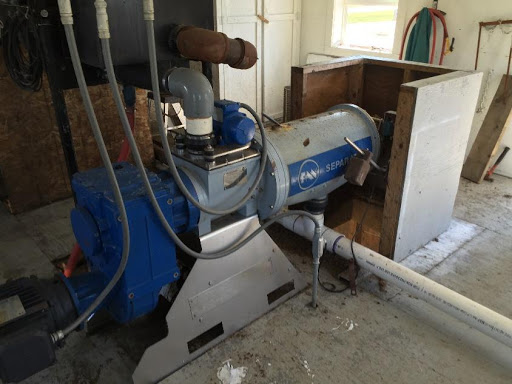
Use of coagulant and flocculant to enhance solid-liquid separation (Source: USDA-NRCS)
Extensive effort through literature searches and testing went into compiling performance and design information on various types of solid-liquid separation technologies. Separation theory was incorporated into the document to provide an understanding of separation principles and background information to assist in technology selection for improved system performance. To improve usability of the document, it was divided into the following chapters: Methods of Solid-Liquid Separation, Manure Characteristics and Handling Methods, Fundamentals of Solid-Liquid Separation, Measures of Solid-Liquid Separation Performance, High-Rate Solid-Liquid Separation, Unique Applications of Solid-Liquid Separation Technology, and Design Considerations. Several examples were provided throughout to assist in the design process of the various technologies. The document also includes information on the uses and benefits of coagulants and flocculants and separation methods associated with sand laden manure. Numerous system diagrams assist in illustrating the vast array of solid-liquid separation technologies that can be implemented in an animal manure treatment system.
What Have We Learned?
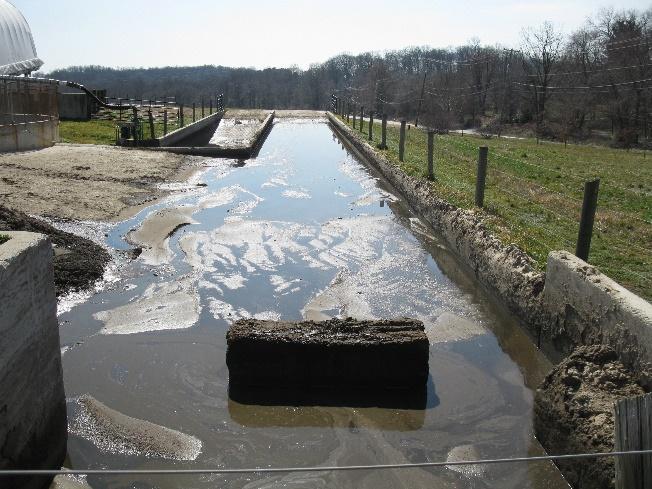
Sand settling land (Source: USDA-NRCS)
This work brings together fundamental information about solid-liquid separation, benefits and limitations of many separation technologies, performance measurement techniques along with design considerations into one document. Even though there are significant differences in performance and costs between the various separation technologies, the approach selected is largely dependent on critical elements such as landowner objectives, facility size, performance goals, operation and maintenance and other factors. This document will help designers and operators choose the separation technology or technologies that will best meet the goals established for the operation.
Future Plans
This document will be published as chapter 4 of the USDA-NRCS National Engineering Handbook, Part 637 Environmental Engineering.
A special thank you goes out to the Piedmont-South Atlantic Coast Cooperative Ecosystems Studies Unit (CESU). This Cooperative and Joint Venture Agreement allowed for this work to be completed.
Additional support was provided by the Confined Animal Manure Managers Program, Clemson Extension, Clemson University, Clemson, SC.
The authors are solely responsible for the content of these proceedings. The technical information does not necessarily reflect the official position of the sponsoring agencies or institutions represented by planning committee members, and inclusion and distribution herein does not constitute an endorsement of views expressed by the same. Printed materials included herein are not refereed publications. Citations should appear as follows. EXAMPLE: Authors. 2019. Title of presentation. Waste to Worth. Minneapolis, MN. April 22-26, 2019. URL of this page. Accessed on: today’s date.
Looking at the manure-management technologies that currently exist and the new and emerging technologies, Newtrient provides a reliable, third-party technology evaluation tool for the dairy industry. Three years of time and effort has been put into evaluating almost 300 technologies that are included in the catalog, over half of which are related to biogas production or digestate management. Newtrient launched an open-source, technology catalog in 2017 that provides a comprehensive listing of relevant and readily available dairy manure management technologies in the U. S.
What we do?
The U.S. dairy industry is voluntarily playing a critical role in working “towards sustainability” (Scott & Gooch, 2017). As a result of industry consolidation, manure treatment technologies are being developed and marketed that target larger operations. The goal is to help farms work on continuous improvement on sustainability issues while operating at larger scale. Unfortunately, the efficacy and economics of the treatment technologies are not always well established. As a result, the relative costs and impacts are often difficult to compare, although its importance is realized.
Newtrient, on behalf of the U.S. dairy industry, formed a Technology Assessment Team (TAT) in 2016, comprised of a cross section of academic and industry professionals with in-depth expertise in dairy manure management. One of the first tasks assigned to the TAT was to conduct systematic verification and catalog available dairy manure treatment technologies in the United States. The ongoing effort by Newtrient is to identify and evaluate available dairy manure treatment technologies which has resulted in the Newtrient online Technology Catalog (Catalog)with over 240 entries (Newtrient, 2019).
Lessons Learned?
Many lessons have been learned during the development of the Newtrient Technology Catalog. One of the most important is that it is necessary to develop a standard, easy to use way of presenting the information on many differing technologies and companies, the Newtrient TAT does this in a variety of ways including:
Company description – We work with each vendor to provide a brief description of the company, its mission and its history.
Technology description – A succinct and informative overview of the technology and how it works is the goal and this, combined with an image or flow chart, is often enough for the average visitor.
Business information – A vendor-completed Newtrient Business Information Request (BIR) form can be viewed or downloaded when additional information is desired.
Technology information – A vendor-completed Newtrient Technology Information Request (TIR) is also available on line providing additional technical details including what it takes to install and make the technology work.
Expert reviews – Expert opinion and evaluation of technologies from the Newtrient TAT provide insight and perspective that is not available anywhere else.
Newtrient 9-Point Score – A quick and intuitive visual reference that provides answers to 9 specific questions in three categories, chosen to help set a standard for technologies and a basis for comparison. The nine points include the following:
COMMERCIAL VIABILITY
OPERATIONAL HISTORY – Is this technology currently operational on at least three North American dairy farms?
OPERATIONAL RELIABILITY – Does this technology have record of reliable performance of more than 12 months at each of at least three farms?
MARKET PENETRATION – Has this technology been installed on at least 10 North American dairy farms?
ECONOMICS & INDUSTRY VALUE
CAPITAL COST – Has information on the installed capital costs been clearly defined and communicated to the Newtrient TAT?
OPERATIONS AND MAINTENANCE COST – Are the actual operations and maintenance costs clearly defined and communicated to the Newtrient TAT?
VALUE PROPOSITION – Does this technology or the products it makes, deliver to the farm identifiable economic, environmental, or community value (e.g. reduced cost, increased income, reduced odor, improved nutrient use, etc.)?
TRANSPARENCY & INTERACTION
VENDOR INFORMATION SHARING – Has the company provided complete and verified Newtrient BIR and TIR documents to Newtrient?
CASE STUDY – Has a case study demonstrating the performance claimed by the vendor been completed by the Newtrient TAT?
CUSTOMER REVIEWS – When asked how likely is it they would recommend this technology to a colleague; have at least three customers scored the technology at least a 7 out of 10?
Highlighting Technologies – Newtrient reviews technologies and provides recognition for those that have proven themselves, show potential or have not engaged with Newtrient but are actively marketing to dairymen. The three categories are:
Newtrient Recognized: for technologies that are proven in the field.
Emerging Technology: for technologies that show significant promise.
Not Vendor Verified: for vendors who have not worked with Newtrient to verify and validated the information regarding their business or technology.
Newtrient Evaluation & Assessment of Technologies (NEAT) – After the catalog was first introduced it became obvious that there was additional work that was needed regarding the impact of each technology on key environmental areas. In response, the TAT developed the NEAT process for evaluating technologies and their impacts on six key areas (see accompanying paper presented at this conference on the NEAT process).
Future Plans
The Newtrient Technology Catalog is ever changing and being updated; new technologies are added regularly, BIRs and TIRs are updated, new case studies are written, and new functionality is added regularly. The catalog was recently updated to accommodate outcomes of applying the NEAT process to select technology types. Additionally, the TAT is evaluating inclusion of the following:
NRCS Conservation Practice Standards and guide to USDA grant programs
Feed and manure additives with a system for comparing their efficacy and economics
Directories of resources for help in nutrient management planning, engineering, and other professional services related to manure treatment/nutrient management
Expanding and updating the Newtrient TIR to include all of the information needed to qualify a technology for USDA grant and cost share programs
Author
Mark Stoermann, Chief Operating Officer, Newtrient LLC.
mstoerm@newtrient.com
Other authors
Curt Gooch, Environmental Systems Engineer, PRO-DAIRY Dairy Environmental System Program, Dept. of Animal Science, Cornell University.
Additional information
Additional information, including business information, technical information and case studies on technologies, is available on the catalog page of the Newtrient website: https://www.newtrient.com
Acknowledgements
Newtrient, LCC and the papers authors thank the following supporters of Newtrient: Agri-Mark, Inc.; Dairy Farmers of America, Inc.; Dairy Management Inc.; Foremost Farms USA; Land O’Lakes, Inc.; Maryland Virginia Milk Producers Cooperative Association, Inc.; Michigan Milk Producers, National Milk Producers Federation; Prairie Farms Dairy, Inc.; Prairie Farms Dairy, Inc.; Select Milk Producers, Inc.; Southeast Milk, Inc.; St. Albans Cooperative Creamery; Tillamook County Creamery Association; and United Dairymen of Arizona.
The authors are solely responsible for the content of these proceedings. The technical information does not necessarily reflect the official position of the sponsoring agencies or institutions represented by planning committee members, and inclusion and distribution herein does not constitute an endorsement of views expressed by the same. Printed materials included herein are not refereed publications. Citations should appear as follows. EXAMPLE: Authors. 2019. Title of presentation. Waste to Worth. Minneapolis, MN. April 22-26, 2019. URL of this page. Accessed on: today’s date.
The question came up at an extension meeting on manure as to how adding 18,250 lbs. of sand per cow stall per year was impacting the soil. Words like a “it will take a long time” and “not sure” didn’t serve as satisfactory answers.
Upon talking to a soil scientist, I found in 25 to 50 years the soil texture could include 20% more sand, when using a vertical tillage system. By the look on his face I could tell that was not a good thing. This has led me to ask what impact will this have on our soil if it continues?
What did we find?
First, I confirmed the recommendation of 50 lbs. of sand per cow stall per day from the Dairyland Initiative. 50 lbs./ stall/ day x 365 days = 18,250 lbs./stall/year. About 2/3 of a dump truck per year per cow stall.
In surveying dairies in the Midwest, the average dairy has between 2 and 4 acres of land for which to spread manure, for each cow. At that rate, if equally spread, the dairy farmer will be adding between 4,550 lbs. and 9,125 lbs. per acre per year.
Also, in interviewing the farmers we found a majority of them utilize vertical tillage. In vertical tillage the top 3 inches of soil material is mixed. The sand will accumulate in the top 3” unless another system of tillage is utilized. At a rate of 4,550 – 9,125 lbs./year depending if you have 2, 3, 4 acres of area to spread your manure on with vertical tillage, it will take between 25 and 50 years to change the soil 20% more sand. Example-from a 40% loam to a 60% sandy loam.
Sand added Top 3″
W.H. Gardner published (1962) work he was doing on infiltration when there was a difference in soil texture. It showed when the pore space or texture differed, water infiltration slowed down.
If the pore space is smaller on top it will hold water tightly and will not allow it to infiltrate to the larger pore space until the pore spaces are filled up. If the pore spaces are larger on top, the water more easily will move in the large spaces before moving downward once the upper pore spaces are filled.
We did an experiment adding 20% more sand to the top 3” of a glass cylinder (1). A second glass cylinder was filled with the same parent soil as the first (2).
Every soil will be unique, but in this trial, it took 5 minutes for the water to infiltrate to the bottom on the original parent soil (2). In the cylinder with sand added (1), it took 1 hour and 10 minutes to reach the bottom.
In several follow up trials with various soils the pattern was repeated. The sand added cylinder was significantly slower to let water in. Unlike the example with the cylinders we do not have a containment system on fields to hold the water in place until it can soak in. If our fields have no containment system around them the water will become runoff as in this picture.
As we add sand to the top 3“of soil, organic matter is diluted. Organic matter plays a part in several areas.
Sand has a cation exchange of 10 or less. Organic matter significantly increases the cation exchange of the soil. More sand and less organic matter decrease the ability of the soil to retain nutrients, such as phosphorus. If we cannot hold onto the nutrients, nutrification of our waters will occur and have negative consequences for the environment.
A second benefit of organic matter is at a 3” depth, for each 1% of organic matter we lose, we also lose 13,500 gallons of water holding capacity. This is important for filling out ears of corn and maturation of crops in a timely manner.
Summary of what we have learned.
The addition of sand at these levels decreases the rate of infiltration of rainfall causing runoff. This runoff takes with it soil, nutrients and the water we could use for our crops.
The cation exchange decreases as sand dilutes the top 3” of vertically tilled fields. With a lower cation exchange, there is a decrease in the soils ability to hold nutrients. Nutrients the crops could use. Nutrients that cost money to provide. Nutrients in too abundant supply, do harm in our water system.
A decrease in organic matter also decreases the ability of soils to hold water. For each 1% loss of organic matter we lose 13,500 gallons of water holding capacity.
The quality per volume of manure is also diminished. As sand is added to the manure the % of N, P, K, and sulfur is diminished.
A definition of a contaminant is “either biological, chemical, physical or radiological substance that becomes harmful for humans or living organisms”. If sand bedding is not a contaminant, it acts like one.
Future plans.
The challenge is to make this information aware to dairy farmers and people who assist them in understanding the options available and making decisions. Specifically, the challenge is to be able to bring the future to the present so the ramifications of the current practice of adding 18,250 lbs. of sand per cow stall per year to our soils is recognized as unsustainable and another system can be implemented to benefit the soils.
I would like to thank Professors Bill Bland and Francisco Arriaga-University of Wisconsin Department of Soil Science for their assistance. One of several videos showing the dynamics of water movement through the soil can be accessed by the following link. https://www.youtube.com/watch?v=ego2FkuQwxc
The authors are solely responsible for the content of these proceedings. The technical information does not necessarily reflect the official position of the sponsoring agencies or institutions represented by planning committee members, and inclusion and distribution herein does not constitute an endorsement of views expressed by the same. Printed materials included herein are not refereed publications. Citations should appear as follows. EXAMPLE: Authors. 2019. Title of presentation. Waste to Worth. Minneapolis, MN. April 22-26, 2019. URL of this page. Accessed on: today’s date.
Recently there have been significant effort put into promoting soil health, emphasizing management practices such as low or no tillage, cover crop, and increasing soil organic matter content. A state-wide effort in Missouri has been taken to encourage adoption of cover crops, to improve water quality and soil health. The program presents a unique opportunity for systematic evaluation of soil health indicators, crop rotation and yield, and manure application. Participants are required to submit soil samples to University of Missouri Soil Health Assessment Center (https://cafnr.missouri.edu/soil-health/), on an annual basis, along with critical crop, soil, and manure nutrient management information. The objective of this effort is to assemble and analyze soil health indicators and manure application data.
What did we do?
A team of agricultural engineers and soil scientists in Missouri correlated data of soil health variables and manure land application details, for state-wide and research plot data. For the first dataset (2016-17) collected, the team examined the overall effects of manure land application on soil characteristics, especially those that have more implication in soil health. In addition to the typical soil nutrient (nitrogen and phosphorus) variables, many key soil health indicators that were included in the program are total organic carbon, active carbon, exchangeable cations, bulk density, and water stable aggregates. Some of the important management information collected from the program included field location, crop rotation, tillage use, and if there was previous cover crop use, etc. Manure land application information included manure type, application rate, and method applied.
In order to better examine the effects of manure land application on soil characteristics, another set of data from research plots was examined. The controlled, experimental field plots had consistent tillage and repeated crop and fertilizer treatments. Some of the plot management considered included full fertilizer, no fertilizer, manure application (6 tons manure/acre), and green manure (red clover). A wide range of cropping systems were conducted, ranging from continuous corn, continuous soybean, continuous wheat, continuous Timothy, to three-year rotation of corn-wheat-red clover, and four-year rotation of corn-soybean-wheat-red clover.
What we have learned?
A significant difference was found only for phosphorus for the state-wide samples. The lack of correlation is mostly likely because of relatively few samples were associated with manure application, and the samples were highly variable in tillage, soil type, crop, and manure type, application rate and methods. However, when the effects of manure land application was compared within the counties, the manure applications increased the active carbon contents (p<0.01) for two of the top three counties where manure application data was collected. The manure application also significantly increased (p <0.05) organic carbon, phosphorus, potentially mineralizable nitrogen, and water stable aggregate values for Stoddard county.
For the central Missouri research plot data, the manure land application clearly affected several key variables. The manure application has resulted in higher soil organic carbon, active carbon, phosphorus, and water stable aggregates, and lower bulk density, Figures 1 and 2.
Include impacts/implications of the project or research.
These findings confirm that the benefits of manure application in increasing soil organic materials and improving soil aggregate ability can be seen at least from fields that were consistently treated. While considering measurable economic and environmental impacts of nutrient and manure management, especially for increasing the carbon content in the crop fields, manure land application can be one of the recommended practices.
What should people remember as take-home messages from your presentation?
Manure application can be considered an effective management to increase soil organic carbon, active carbon, and water stable aggregates, and decrease soil bulk density, although the results have also shown to increase soil phosphorus content. The findings regarding manure use and important soil health indicators are important to management of the soil and can be contributing to many factors need to be considered for increasing food production on a limited land base.
Future plans
Continue analyzing the growing management and soil analysis dataset, and cross examining the correlation between the different variables. The team will promote the findings and encourage management that can result in better soil health and resource preservation.
Authors
Lim, Teng (Associate Professor and Extension Agricultural Engineer, Agricultural Systems Management, University of Missouri, limt@missouri.edu)
Wang, Allen Haipeng (Heilongjiang Bayi Agricultural University); Brandt, Donna, (University of Missouri); Norkaew, Saranya, (University of Missouri); Miles, Randy (University of Missouri); and Rick Koelsch, (University of Nebraska, Lincoln).
Additional information
Please visit https://soilhealthnexus.org/can-manure-improve-soil-health/to find more information and download the data brief and final report.
Acknowledgements
Funding for this data analysis and report were provided by the North Central Region Water Network – a 12-state collaboration between Extension water resource professionals and university, federal, state, NGO and industry partners; and Soil Health Institute (http://soilhealthinstitute.org/).
Figure 1. Comparisons of organic carbon contents for the state-wide and research field plot soil samples, the plots depict median (solid line), mean (x), quartile box, and minimum/maximum values. The state-wide samples (Top figure) were state-wide average (overall), fields treated with manure (Soil+manure), and fields did not have manure application (Soil-manure). The field plot treatments (Bottom figure) were full fertility (FF), manure (M), and no fertility (NF).Figure 2. Water stable aggregates of state-wide and researcy field soil samples, the plots depict median (solid line), mean (x), quartile box, and minimum/maximum values. The state-wide samples (Top figure) were state-wide average (overall), fields treated with manure (Soil+manure), and fields did not have manure application (Soil-manure). The field plot treatments (Bottom figure) were full fertility (FF), manure (M), and no fertility (NF).
The authors are solely responsible for the content of these proceedings. The technical information does not necessarily reflect the official position of the sponsoring agencies or institutions represented by planning committee members, and inclusion and distribution herein does not constitute an endorsement of views expressed by the same. Printed materials included herein are not refereed publications. Citations should appear as follows. EXAMPLE: Authors. 2019. Title of presentation. Waste to Worth. Minneapolis, MN. April 22-26, 2019. URL of this page. Accessed on: today’s date.
NRCS has started a pilot project to test existing animal waste storage facilities for seepage using the DeltaProbeTM Seepage meter. The DeltaProbeTMseepage meter is the result of an NRCS Conservation Innovation Grant (CIG) to develop a device to quickly and directly measure seepage rates from waste storage ponds or lagoons. The pilot project will assess the use of the equipment under a variety of regional, environmental and climatic conditions.
What did we do?
The DeltaProbeTM Seepage meter was developed in Michigan through an NRCS Conservation Innovation grant (CIG) with Nth Consultants, Ltd. and Abletech Industries, LLC.
NRCS purchased two seepage meters and trained six individuals to operate the device. The device is used in conjunction with a weather station on site to collect data.
Standard Testing procedure has been developed.
Initial testing under the CIG was performed in Michigan. A pilot test was performed in Washington state on an HDPE lined waste storage facility during 2018. Further testing was planned for the winter months of 2018, but the extremely high rainfall has precluded testing.
What we have learned?
The equipment has the potential to provide “whole pond” testing of a waste storage facility overnight under suitable conditions. The device can measure the change in the depth of water surface with a 95% confidence interval to the nearest 0.035 mm over a 25.4 mm range in 8 hours overnight.
Testing results in a snapshot of seepage rate under the conditions during the timeframe which the test is performed.
The equipment requires training for proper setup, use and to review the results of testing.
Future plans
Further testing will take place on waste storage facilities in North Carolina and Kansas in 2019.
Agricultural Research Service (USDA, ARS) will be providing a test of the equipment.
Authors
Sandra L. Means, Environmental Engineer, USDA-NRCS, National Animal Manure Nutrient Management Team, Greensboro, North Carolina. Sandy.Means@gnb.usda.gov
Bill Reck, National Environmental Engineer, USDA, NRCS.
The authors are solely responsible for the content of these proceedings. The technical information does not necessarily reflect the official position of the sponsoring agencies or institutions represented by planning committee members, and inclusion and distribution herein does not constitute an endorsement of views expressed by the same. Printed materials included herein are not refereed publications. Citations should appear as follows. EXAMPLE: Authors. 2019. Title of presentation. Waste to Worth. Minneapolis, MN. April 22-26, 2019. URL of this page. Accessed on: today’s date.
Provide leaders with information to develop a well-planned crowd-sourced data application that improves communication and speed response times in disasters. Recognize the potential benefits of crowd-sourced and employee-sourced real-time geospatial data during emergency response. Present steps taken by United States Department of Agriculture – Natural Resources Conservation Service (NRCS) Texas State Office for the deployment of the “dead cow tool” and share lessons learned. Provide a framework of questions and items that need to be addressed for the successful deployment of a real-time data collection tool.
What Did We Do?
In response to Hurricane Harvey in the fall of 2017, the Texas NRCS GIS staff developed on-line reporting tools to collect real-time data related to damages and animal mortalities that could be used by employees and the public. ESRI’s ArcGIS Collector Application was selected for its ease of use, ability to be used when off-line, and staff familiarity with the tool’s programming language. In this case, NRCS already had the necessary licensing for ArcGIS Online accounts.
The “dead cow tool” is a near real-time reporting tool for the public to identify locations, types and magnitude of agricultural losses. This provides NRCS and other agencies with data to request funding for emergency response and recovery funds to assist the local agricultural producers. However, significant concerns were raised relative to releasing the application for public use, so the data collection applications were then limited to a handful of NRCS employees within the disaster areas.
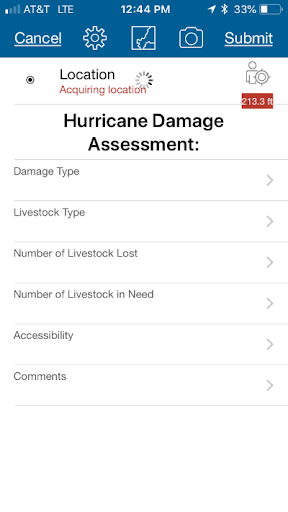
The Dead Cow Tool (displayed as Hurricane Harvey Data Collector Map) was designed to collect the following parameters: Damage Type; Livestock Type; Number of Livestock Lost; Number of Livestock in Need; Accessibility; and Comments. There was also an option to add or take images and add the location from a map previously downloaded onto a user’s mobile device (if network connectivity was lacking). Here are a few screenshots to serve as an example from an iPhone (Figures 1 – 6):
Figure 1. Data collection maps developed in response to Hurricane Harvey
Figure 2. Main data collection screen for the “Dead Cow Tool” aka Hurricane Harvey Collector Map
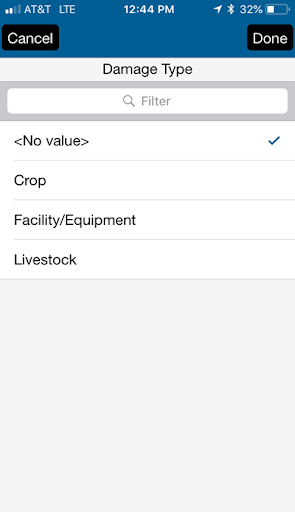
Figure 3. Options for damage types in the “dead cow tool”
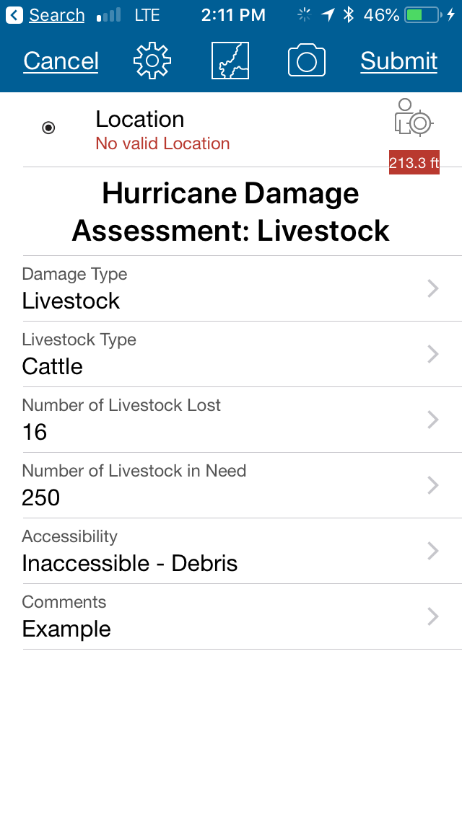
Figure 4. Completed Livestock Damage Assessment ready to be submitted. There is includes the option to add a photo.
Texas NRCS developed and deployed another tool for employees to complete Damage Survey Reports while in the field. “In Hurricanes Ike and Rita, staff went out in the field, took handwritten notes about the damage, wrote down the location, took pictures and then had to return to the office, to download and enter the information on their computer. They had to look up the latitude and longitude points from their notes to document the exact location and then save all that information in several different locations. It was a long process for our staff,” says NRCS State Soil Scientist Alan Stahnke. “I knew there had to be a way to make it more efficient for them.” Stahnke had been working with Steven Diehl, GIS technician, and others on his staff for several months on an ArcGIS application, ArcCollector, based on ESRI map data. They had the basics down and when Hurricane Harvey showed up on the radar, they knew they had to work fast to get the application ready for staff in the wake of Harvey’s wrath. The resulting smart phone device field tool – the Hurricane Harvey Damage Reporter – is a method to record the damage and collect information on all the points into a central database. (Littlefield, 2017)
The Damage Survey Report tool reduced the time needed by field engineers by approximately 50% from the previous method. The data was available to others with access as it was entered – thereby providing timely data to managers and leadership. Additionally, it allowed the final reports to be developed by state office personnel further reducing the time required by the field – allowing them to take care of other pressing matters.
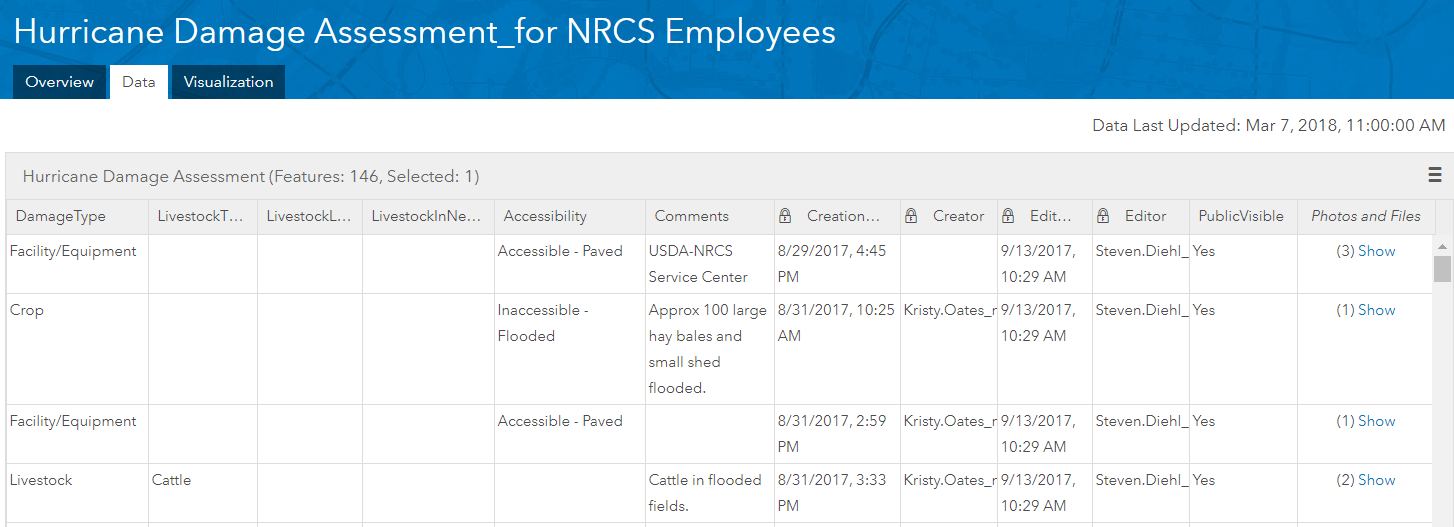
Figure 5. Screenshot of Data Collected and viewed through ESRI’s ArcGISOnline Portal
Figure 6. Screenshot of visual map of data collected through ESRI’s ArcGIS Online Portal
What Have We Learned?
Several lessons were learned: First, approve policies on data collection prior to the disaster – these need buy-in and flexibility. Second, decide how data will be released and identify typical reports. Third, develop Data Collection Applications in advance – allowing testing, training, familiarity, and formatting needed for user-friendliness. Fourth, select the correct Data Collection Tool. Fifth, identify data collection alternatives if the application cannot be realistically utilized – power outages, lack of network connection, closed roads, flooded areas, etc.
It is important to prepare, plan, and train prior to a disaster to allow time to adjust and/or develop policies and reduce knee-jerk reactions.
Data collection can have negative impacts if not properly administered and protected. Several identified concerns during Hurricane Harvey were protecting the data collected, preventing submittal of inappropriate language and/or photos, potential for someone submitting the data to believe that they had applied or requested assistance, and data distribution. Our NRCS GIS specialists (Texas and across the US) worked with ESRI developers to overcome some of the data protection and prevention of inappropriate material. However, obtaining clearance from leadership for public-use of the application was not obtainable in a timely matter.
Real-time data collection is a useful tool for both internal customers and the public when faced with a disaster and allows the timely coordination of resources for rapid response and recovery.
Disasters such as Hurricane Harvey require significant resources for response and recovery. Real-time data collection can aid in allocating resources. With animal mortalities, it is important that animals in sensitive environmental areas are properly disposed of in a timely manner. NRCS has provided technical and financial assistance for proper carcass disposal following natural disasters to reduce the associated environmental risk.
Generating Reports and Maps with Information Collected — Recognize the market impacts of sharing reported losses. NRCS must follow applicable federal rules and regulations to related to personally identifiable information. Generally, a report could be published with information grouped by county based on collected data provided there is more than one producer in the county with that type of livestock or commodity. For example, if there is only one farm in a county with emus, and the producer reported their losses of 50% of their emus, USDA Agencies could not share that data, as the producer could then be identified.
Policies are needed to address data collection with public interfaces. Consider modifications to existing policies or creating new policies to allow the use of crowd-source data.
The intent of the app and intended use of the data must be clearly conveyed to users. USDA Agencies raised concerns the public would believe that the tool indicated that they were applying for assistance, not simply reporting. (Stahnke, Jannise, & Northcut, 2018)
Prior to collecting data, appropriate policies should be written that address, how, when, where and why the information is needed and how it will be used in accordance with federal data collection requirements. The policies should be reviewed internally by a variety of users to ensure that the policy is clear and provides adequate accountability. Buy-in from all levels is needed prior to launching a data collection system to the public. Depending upon the type of organization that is collecting the data – a variety of controls may need to be established to protect the data.
How the data will be collected and shared– this area should allow flexibility. Allowing public to enter data using their own devices may be necessary to obtain the data in a timely manner. What will public users gain by sharing their information?
Will the data be shared with other agencies, non-governmental organizations (NGOs), etc.?
If employees are allowed to use their own device, is there a possibility of a litigation hold on the personal device? (USDA – Forest Service, Mobile Geospatial Advisory Group, 2015)
When does the data need to be collected? This may vary – for example, the number and type of livestock lost in a sensitive area may need to be reported as soon as the livestock are found; flooded fields and associated losses, road closures, or areas with downed power lines may have some lag-time in reporting over a period of several weeks as roads and properties become available for inspection
Where does the data that has been submitted get collected?
Who is going to oversee the data collection and create needed reports?
Will the data be adequately protected? As mentioned, some of the data collected, particularly with potential images and audio embedded with file attributes, will likely include personal or sensitive data that must be protected.
Why is the data being collected?
Will it serve a purpose and be used?
Can the data be potentially abused?
What level of data integrity is required?
Will certification or training be required for various users?
Will additional weight be placed on data from “authenticated” or “certified” users?
Who will be required to review of the proposed data collection system?
Should these vary based on the scope of the project? Setting the review levels and identifying who is authorized for deployment of the tool in advance is helpful to know what rules need to be followed. Some flexibility should be provided to allow modifications and adaptations as needed during an emergency.
Selecting the appropriate data collection tool and platform is critical to success. There is an organization “Principles for Data Collection” that has created a guidance document for mobile data collection (MDC). Additionally, they host a “Digital Principles Forum — an online meeting place for peer learning, connection building, and debate on the Principles for Digital Development. Together with you, we aim to build a community that connects ICT4D, information technology, and international aid and humanitarian development practitioners with thoughtful curated content, relevant conversation and quality opportunities to improve their work.”
“How to Choose a Mobile Data Collection Platform” is a guidance document prepared by the Principal for Data Collection group. Below are some of the considerations that they have identified:
Consider data and security needs including personal or sensitive data.
Consider the ecosystem – following a disaster, internet and wireless connections may be intermittent or non-existent.
Identify and prioritize selection criteria
Short-term and long-term costs
Number of users, surveys, and items
Devices and data requirements for enumerators
Security and privacy compliance
Integration with other technology
Offline collection
Short Message Service (SMS) integration
Unstructured Supplementary Service Data Integration
Authentication and user roles
Skip logic and data parameters
Data analysis
GIS and mapping
Language
Photos, audio and video
Ease of setup and use
Research MDC platform options
Rank options
Consider whether to customize an MDC platform
Select and test your platform.
TIP: Be sure to test several devices in your context before making a final selection.
(Principles for Digital Development, 2018)
When developing and testing applications, consider the following:
Users accessibility to AGOL, i.e., do they need a login in their company’s Enterprise ESRI platform or is the application in the public domain on AGOL.
Amount of training required for user to input
Ease of navigation and number of clicks required to complete form
Varying size of screens on user devices (small screens vs. tablets)
Test with a variety of different levels of users
Types of reports and training required for the administrator
Duration of the application and availability
Creating sample reports and identifying who can see specific data in advance will aid when a disaster does occur. In Texas, this type of data might be useful to the Texas Animal Health Commission, and other agencies involved in Emergency Support Function #11 – Agriculture and Natural Resources Annex (ESF-11).
The following items should be further investigated for disaster related activities:
FEMA’s National Incident Management System
How to share some information with users that have input data – allows them to know that their data is being utilized for a worthy cause
Identifying other agencies that are working on recovery efforts with the same groups
Setting up mechanisms to share data automatically rather than relying on an individual to send out reports
Methodologies for ground-truthing and screening data quickly
Explore the possibilities of utilizing ESRI’s WorkForce application to track locations of employees for safety and workflow coordination.
It is important to consider that even with the best tools developed and ready for deployment – they might not be able to be used in the field if there is no power to charge the mobile data collection device or ability to transmit the data back to the database. Considerations of solar chargers for the mobile devices for employees might be helpful. Establishing alternate methods of communication such as, but not limited to, land lines, postal mail, drop off locations, leaving surveys at the gates, and 800 phone numbers should be implemented.
Future Plans
There are infinite possibilities for the collection and use of real-time data in a disaster. It is the opinion of the authors that the potential benefits greatly outweigh the risks of not obtaining and utilizing the data. We will continue to share the lessons learned to help others implement solid data collection tools.
Authors
Cherie LaFleur, P.E., Environmental Engineer, USDA – Natural Resources Conservation Service, Central National Technical Service Center, Fort Worth, Texas. Cherie.lafleur@usda.gov
Collins, C. (2017, October 27). Retrieved from Texas Observer: https://www.texasobserver.org/agriculture-losses-estimated-200-million-harvey/
Fannin, B. (2017, October 27). Texas agricultural losses from Hurricane Harvey estimated at more than $200 million. Retrieved from AgriLife Today — Texas Agrilife Extension: https://today.agrilife.org/2017/10/27/texas-agricultural-losses-hurricane-harvey-estimated-200-million/
Littlefield, D. A. (2017, September). NRCS Develops New Web App to Expedite Agency Response to Harvey. Retrieved from USDA-NRCS: https://www.nrcs.usda.gov/wps/portal/nrcs/detail/tx/newsroom/stories/?cid=nrcseprd1351676
Principles for Digital Development. (2018, May 8). How to Choose a Mobile Data Collection Platform. Retrieved from Digital Principles: https://digitalprinciples.org/wp-content/uploads/PDD_HowTo_ChooseMDC-v3.pdf
Stahnke, A., Jannise, P., & Northcut, M. (2018, 05 15). USDA NRCS Texas Personnel. (C. Stanley, Interviewer)
The Weather Company. (2017, September 2). Historic Hurricane Harvey’s Recap. Retrieved from The Weather Company: https://weather.com/storms/hurricane/news/tropical-storm-harvey-forecast-texas-louisiana-arkansas
USDA – Forest Service, Mobile Geospatial Advisory Group. (2015, August). Internal Document: Collector for ArcGIS Field Data Collection Pilot for Enterprise GIS Using ArcGIS Online.
Acknowledgements
Alan Stahnke, State Soil Scientist, NRCS, Temple, TX.
Pam Jannise, State GIS Specialist, NRCS, Temple, TX.
Steven Diehl, Cartographic Technician, NRCS, Temple, TX.
Mark Northcut, Landscape and Planning Staff Leader, NRCS, Temple, TX.
The authors are solely responsible for the content of these proceedings. The technical information does not necessarily reflect the official position of the sponsoring agencies or institutions represented by planning committee members, and inclusion and distribution herein does not constitute an endorsement of views expressed by the same. Printed materials included herein are not refereed publications. Citations should appear as follows. EXAMPLE: Authors. 2019. Title of presentation. Waste to Worth. Minneapolis, MN. April 22-26, 2019. URL of this page. Accessed on: today’s date.
Soluble nutrients are believed to be contributing to the recent high-profile impacts in the Great Lakes including excessive cyanobacteria growth (Ohio 2010; Baker et al. 2014). Retaining nutrients, and especially phosphorus in the Great Lakes region, on crop land is also important to the producer as it is non-renewable, scarce, expensive, exhibits high price variability, and can cause adverse environmental impacts when discharged into fresh water systems.
This research program was designed to quantitatively investigate preferential flow pathways caused by macropores by conducting field analyses using the mobile macropore characterization unit. Such pathways enable soluble nutrients, such as phosphorous, to rapidly migrate through soil, into tile drains, and then to surface water (Geohring et al. 2001; Heathwaite and Dils 2000). Results, along with site characteristics such as farm-management practices, topography, soil texture, depth to water table, depth and spacing of subsurface drains, if applicable, topography, and proximity to surface water, enable the qualitative selection of the best management practice to retain nutrients. This approach recognizes that all farm fields are unique and best practices to maximize nutrient uptake and minimize its transport off site are not equally applicable
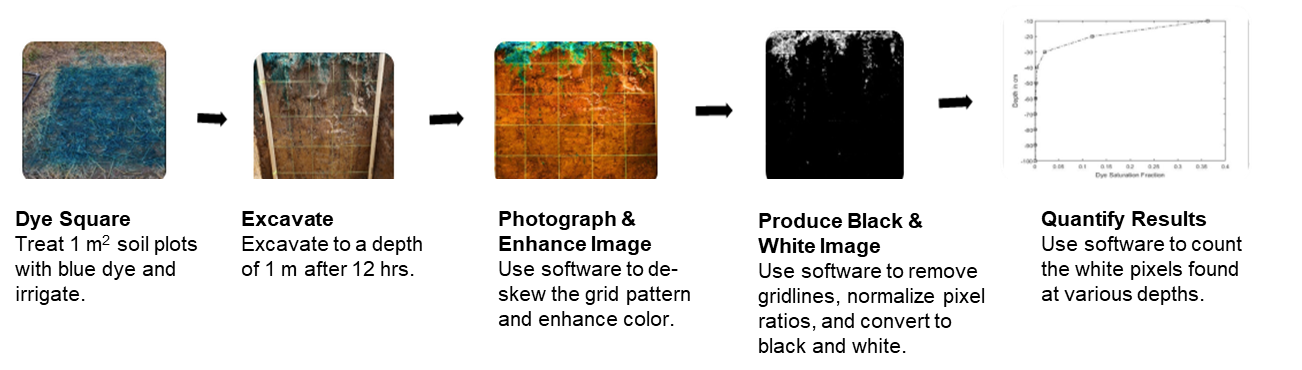
What did we do?
Forrer et al., 2000, developed a visual technique to assess liquid flow through microporous soil. The technique entails adding dye to small plots of saturated soil and excavating trenches in each area. This method was expanded by photographing the soil profiles, processing the image to convert pixels with dye to white and soil without dye to black, and quantifying each with depth using MATLAB (Figure 1). The result is an estimate of the amount and extent of the macropores.
Figure 1. Assessment of Soil Macropores
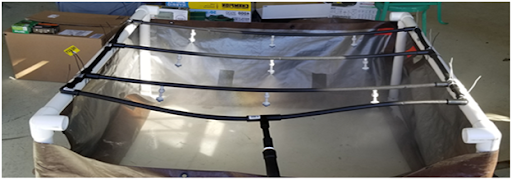
This technique was packaged into the mobile macropore characterization unit to allow for efficient measurements (Figures 2 and 3).
Figure 2. Mobile Macropore Characterization Unit
Figure 3. Dye and Water Distribution Unit using Sprinklers
What we have learned?
Five sites across Michigan with varied management practices and soil structure were tested using the newly developed protocol as shown in Figure 4.
Figure 4. Representative Images from Five Sites using Dye Tracer Study
What are the next steps?
The mobile micropore characterization unit will be used extensively at an ongoing edge-of-field monitoring research site in Michigan to develop correlations between soluble pollutants in the tile drain water and quantitative macropore characterization. Thereafter, the unit will be used by extension educators for field-specific measurements to help producers decide on the most appropriate best management practices.
Authors
Steven I. Safferman1, Jason S. Smith2, Thiramet Sothiyapai3, Ehsan Ghane4
1 Associate Professor; Michigan State University, Biosystems and Agricultural Engineering; Corresponding Author: SteveS@msu.edu
2 Teaching Specialist, Michigan State University, Engineering CoRe
3 Undergraduate Research Assistant, Michigan State University, Biosystems and Agricultural Engineering
4 Assistant Professor and Extension Specialist, Michigan State University, Biosystems and Agricultural Engineering
Additional Information
Baker, D. B., R. Confesor, D. E. Ewing, L. T. Johnson, J. W. Kramer, and B. J. Merryfield. 2014. “Phosphorus Loading to Lake Erie from the Maumee, Sandusky and Cuyahoga Rivers: The Importance of Bioavailability.” Journal of Great Lakes Research 40 (3): 502–17. https://doi.org/10.1016/j.jglr.2014.05.001.
Forrer, I., A. Papritz, R. Kasteel, H. Flühler, and D. Luca. 2000. “Quantifying Dye Tracers in Soil Profiles by Image Processing.” European Journal of Soil Science 51 (2): 313–22. https://doi.org/10.1046/j.1365-2389.2000.00315.x.
Geohring, Larry D, Oloro V Mchugh, M Todd Walter, Tammo S Steenhuis, M Saleem Akhtar, and Michael F Walter. 2001. “Phosphorus Transport Into Subsurface Drains By Macropores After Manure Applications :” Soil Science 166 (12): 896–909.
Heathwaite, A. L., and R. M. Dils. 2000. “Characterising Phosphorus Loss in Surface and Subsurface Hydrological Pathways.” Science of the Total Environment 251–252: 523–38. https://doi.org/10.1016/S0048-9697(00)00393-4.
Ohio, E P A. 2010. “Ohio Lake Erie Phosphorus Task Force Final Report.” Ohio EPA OH Task Force.
Acknowledgements
This project was funded by the Michigan Soybean Promotion Committee, Corn Marketing Program of Michigan, and Michigan Wheat Program. The author wish to acknowledge contributions from Brendon Kelly, Lyndon Kelly, Steve Miller, and the MSU Soil and Plant Nutrient Laboratory.
The authors are solely responsible for the content of these proceedings. The technical information does not necessarily reflect the official position of the sponsoring agencies or institutions represented by planning committee members, and inclusion and distribution herein does not constitute an endorsement of views expressed by the same. Printed materials included herein are not refereed publications. Citations should appear as follows. EXAMPLE: Authors. 2019. Title of presentation. Waste to Worth. Minneapolis, MN. April 22-26, 2019. URL of this page. Accessed on: today’s date.
Food retailers and consumers worldwide are pressuring producers to reduce the use of fossil fuels and the carbon footprint of swine production systems. The primary objective of this study was to evaluate a solar-powered system designed to cool sows that might reduce the use of fossil fuels in farrowing rooms and improve performance of lactating sows.
What did we do?
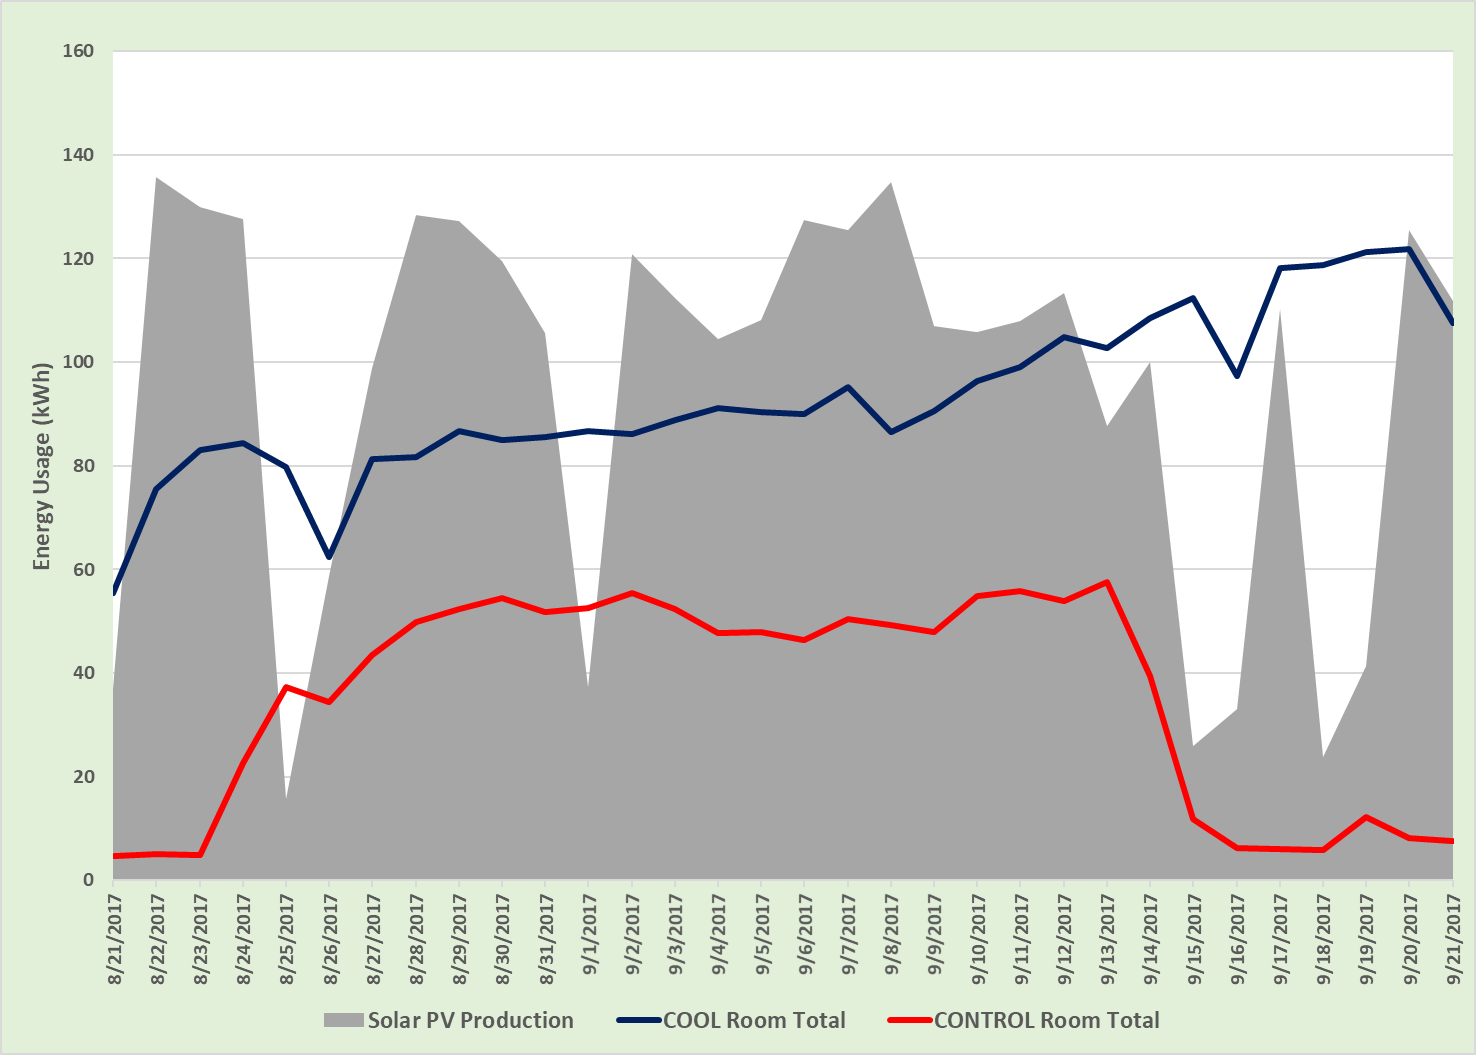
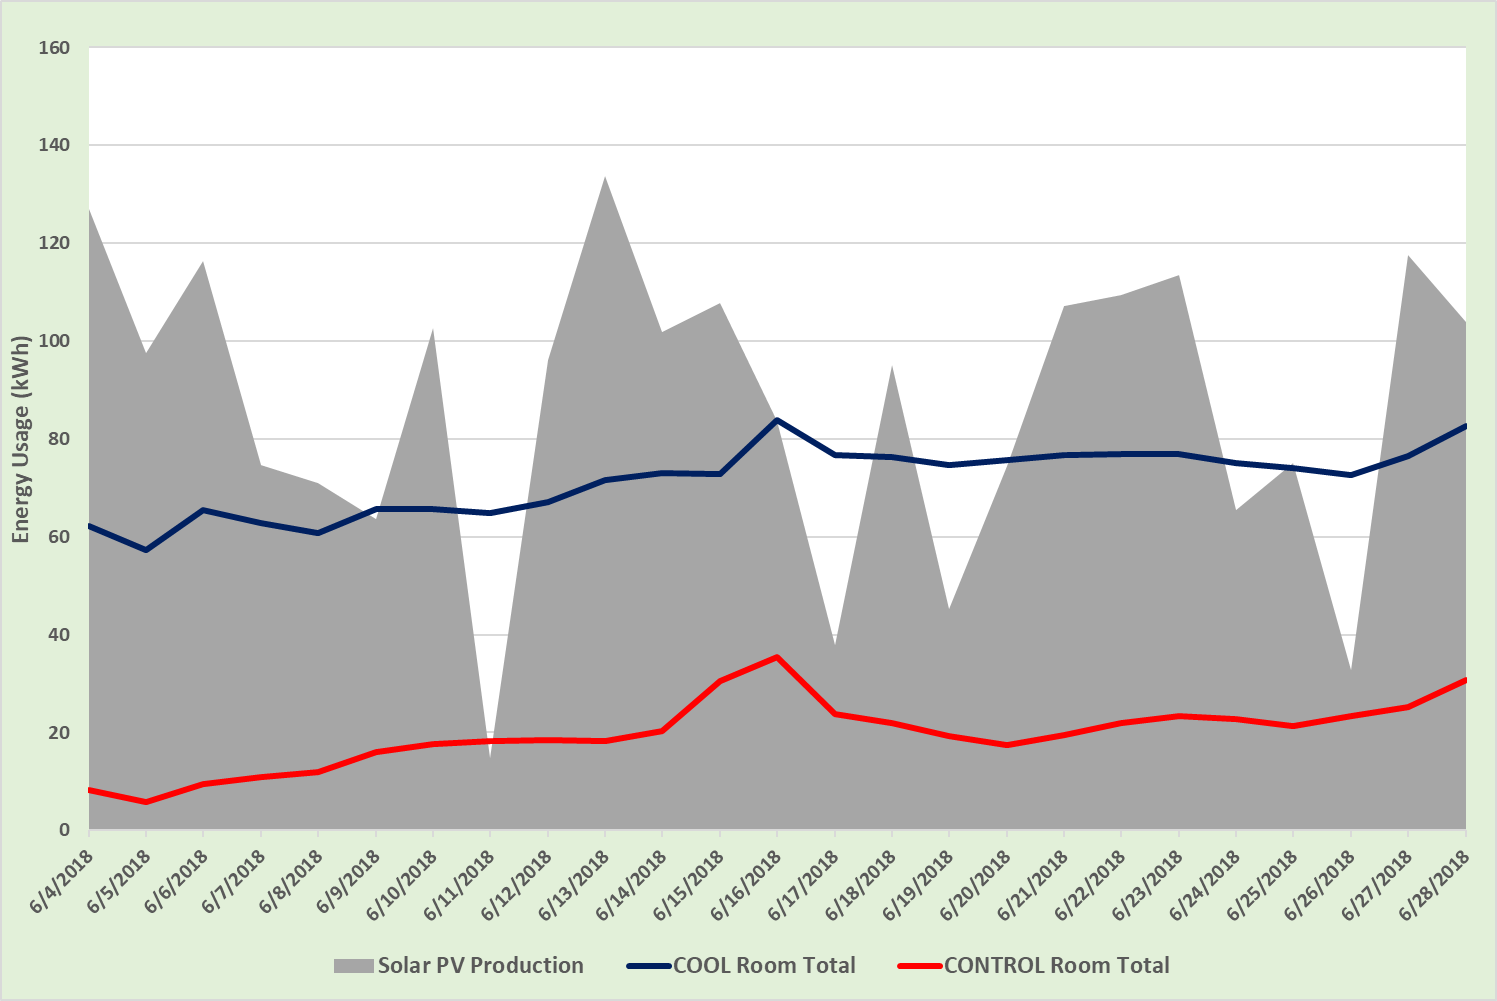
Two mirror-image, farrowing rooms equipped with 16 farrowing stalls each were used for this study. Each farrowing stall in the COOL room was equipped with a cooled flooring insert (Cool Sow, Nooyen Manufacturing) under the sow and a single nipple drinker delivering chilled drinking water. Circulating water cooled by a water-source heat pump powered by a 20 kW photovoltaic solar array cooled the floor inserts (60 to 65 °F) and chilled the drinking water (55 to 60 °F). Warm water (110 to 119 °F) was circulated through pads in the piglet creep area. The CONTROL room was nearly identical to the COOL room except there was no cooling of floor inserts or drinking water and supplemental heat for piglets was provided by one heat lamp (125 W) per farrowing stall (Group 1) or an electric heating pad (Hog Hearth, Innovative Heating Technologies; Group 2). Groups (n = 28 CONTROL sows and 28 COOL sows) were studied during summer months and room heaters were operated to keep rooms above 75 °F to ensure sows were heat stressed. Electric consumption for all systems (ventilation, piglet heating, lights, and cooling system) was measured and performance of sows and piglets were recorded over lactation.
What have we learned?
The COOL room consistently used more electricity than the CONTROL room (Figures 1 and 2). For Group 1, the COOL room used 93.0 kWh/day while the CONTROL room used 35.3 kWh/day. Similarly in Group 2, the COOL and CONTROL rooms required 71.5 and 19.7 kWh/day, respectively. Production of electricity from the solar panels totaled 95.3 and 86.7 kWh/day, respectively. Sows housed in the COOL room were more comfortable as indicated by a lower respiration rate (64.4 vs 96.8 breaths/min; P < 0.01), higher feed intake (11.39 vs 9.25 lb/d; P < 0.01) and reduced lactation body weight loss (35.1 vs. 54.2 lbs; P < 0.06) compared with sows housed in the CONTROL room. Litter size at birth and weaning as well as piglet weaning weights were not different across rooms.
The cooling systems (cooled floor and cooled drinking water) and piglet heating systems studied effectively mitigated heat stress of lactating sows but did not enhance pig performance. Furthermore, these systems required over 2.5 times more total electrical energy than a traditional lactation housing system without sow cooling.
Future Plans:
Effects of cooled floors and cooled drinking water were confounded in this study. Cooled floors are expensive and difficult to install in existing facilities. The effects of cooled drinking water will be assessed independent of cooled floors in future studies. Cooled drinking water will be easier to install in existing barns. Future analyses will consider the economic feasibility of various components of the sow cooling and piglet heating systems.
Corresponding authors, titles, and affiliations:
B. M. Lozinski1, M. Reese1, E. Buchanan1, A. M. Hilbrands1, K. A. Janni2, E. Cortus2, B. Hetchler2, J. Tallaksen1, Y. Li1, and L. J. Johnston1
1West Central Research and Outreach Center, University of Minnesota, Morris, and
2Department of Biosystems and Biological Engineering, University of Minnesota, St. Paul
Acknowledgements:
The authors would like to express gratitude to the Minnesota Environment and Natural Resources Trust Fund for their financial support of this project.
Figure 1. Total energy use by room (kWh) and total solar energy produced (kWh) per day for Group 1.
Figure 2. Total energy use by room (kWh) and total solar energy produced (kWh) per day for Group 2.
The authors are solely responsible for the content of these proceedings. The technical information does not necessarily reflect the official position of the sponsoring agencies or institutions represented by planning committee members, and inclusion and distribution herein does not constitute an endorsement of views expressed by the same. Printed materials included herein are not refereed publications. Citations should appear as follows. EXAMPLE: Authors. 2019. Title of presentation. Waste to Worth. Minneapolis, MN. April 22-26, 2019. URL of this page. Accessed on: today’s date.
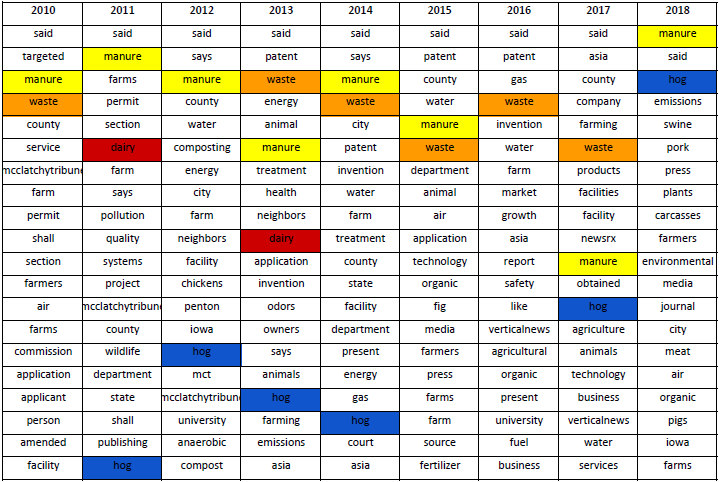
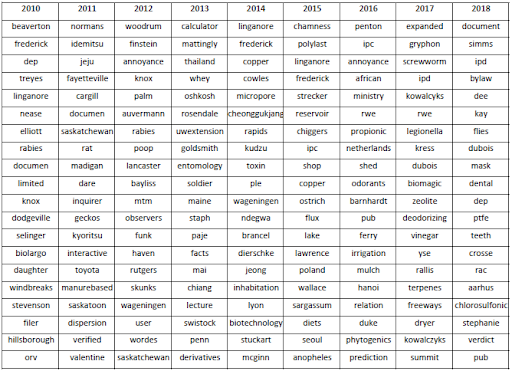
Livestock farming practices and technologies, like many aspects of agriculture and industry, continue to evolve. As technology and attitudes change regarding livestock farming, public response changes as well; this is reflected in the way that people talk and write about the subject. This change and growth is a common topic of both public and technical debate and scrutiny. Databases on the internet collect public articles and documents related to livestock farming dating back to the early 1980’s. The information in these articles can be evaluated using a number of computer science based approaches. These data can help to highlight how significant past events and their impacts were perceived, and possibly predict how future trends within the industry will be described in popular press/media.
What Did We Do?
We gathered popular press articles from an online database, Factiva, with the search terms “livestock and odor,” from the year 2000 to the present. A computer program developed using machine learning processes: (1) cleans and structures the individual articles into text files; and (2) quantifies the importance and frequency of words in individual and groups of articles, by year. The program assigns two measures of importance to each word. Words that frequently occur in many articles per year provide broad overarching ideas and subjects. Words that are deemed important to each individual article provide more nuanced data including companies, people, and equipment discussed in livestock farming. To demonstrate the results, this data is visualized in tables and graphs to show patterns in subjects as they develop and change over time.
What Have We Learned?
This analysis method gives us a quantitative basis for reviewing the change in importance of words over time. All analysis after choosing the subject and search terms is done by a computer program, protecting the outcomes from reader bias. Changes in word importance or frequency can be supported with numerical data and easily visualized from year to year. The different approaches also allow for inferences between long-term subjects and ideas (Table 1), and shorter term players in the industry (Table 2).
This analysis method does not pull out the context that any of the words are used. Manure and waste are two means of describing the same material, with different connotations. Manure and waste appeared at similar frequencies in many, but not all years. Dairy was more prominent in 2011 and 2013, but hogs (or synonyms) appeared in most years. Refinements to the article search protocol could limit the articles to those of opinion (i.e. editorials) or regional perspectives. There are opportunities for this method to inform historical reviews of livestock and the environment, and inform future communication efforts.
Future Plans
There are a number of opportunities to extend this project in the future. One would be to experiment with different search terms and databases to see how outcomes depend on the data source. Another opportunity would be to apply the quantitative method to other applications. The computer program could be applied to any database and so the method has utility to topics other than livestock farming.
Authors
Ryan Felton, Undergraduate Research Assistant, University of Minnesota
Erin Cortus, Assistant Professor and Extension Engineer, University of Minnesota
ecortus@umn.edu
Additional Information
Project support provided by the University of Minnesota UROP program.
Table 1. The top twenty words by year that most frequently appeared in a popular press article database search based on the keywords “livestock and odor”, by year. The relative frequency of some livestock types (cattle, hog, dairy) and manure-related words (manure, waste) are highlighted.
Table 2. The top twenty words by year that were the important focus of articles in a popular press article database search based on the keywords “livestock and odor”.
The authors are solely responsible for the content of these proceedings. The technical information does not necessarily reflect the official position of the sponsoring agencies or institutions represented by planning committee members, and inclusion and distribution herein does not constitute an endorsement of views expressed by the same. Printed materials included herein are not refereed publications. Citations should appear as follows. EXAMPLE: Authors. 2019. Title of presentation. Waste to Worth. Minneapolis, MN. April 22-26, 2019. URL of this page. Accessed on: today’s date.
In the Twin Cities, sewage sludge is incinerated and in the process 5 MW of power is generated per day. Incineration produces significant amounts of ash (38 tons/day) which contains nearly 30% total phosphate (P2O5). Currently, sewage sludge incinerator ash (SSA) is landfilled at a cost to taxpayers, but previous studies have shown that the ash has the potential to be a source of phosphorus (P) for crop production. Additionally, P is a limited and difficult-to-renew resource.
What did we do?
To determine the viability of SSA as a P fertilizer, we are in the middle of conducting a 3-year corn and soybean field study comparing this ash to other P sources including conventional P fertilizer (triple super phosphate), dried pelletized biosolids, and struvite. Each P source was applied in the spring at 40, 80, 120, and 160 lb P2O5/ha, with a zero-P control included. Soil and plant samples were taken throughout the season and after harvest and then were analyzed for available P and EPA 503 metals (elements monitored by the EPA in biosolids land application). In-situ probes that act as a proxy for ions in soil solution were also analyzed.
What we have learned?
After two years of field studies, there is evidence to show that SSA can be a viable phosphorus fertilizer as well as a source of copper (Cu) and zinc (Zn), although additional years of study on a more P-responsive soil are required to draw definitive conclusions. While soils amended with biosolids or SSA have higher levels of DTPA-Cu and DTPA-Zn compared with TSP- or struvite-amended soils, only grain concentrations of zinc reflected this difference in source.
While Cu and Zn are both elevated in biosolids and SSA soils, in-situ probes show that these elements are significantly more available in the biosolids-amended soils. This may be due to the difference in matrices and requires more study. However, our results demonstrate that land-application of ash and biosolids for crop production are two potential options for resolving sewage solids disposal and beneficial reuse of nutrients that go through our food systems. While land-applying biosolids is a good source of carbon and nitrogen where SSA is not, SSA has the benefit of having minimal organic contaminants (pathogens, pharmaceuticals) due to the incineration process. Additionally, biosolids are applied to meet a crop’s nitrogen requirements whereas SSA is applied to meet a crop’s phosphorus requirements. Because of this, the total amount of SSA-amendment added is significantly less than biosolids and thus results in lower or equal amounts of EPA 503 metals.
Future plans:
We will continue our study through a third field season (2019) and will continue to monitor P and 503 metals concentrations in soils and uptake by plants. We are also analyzing soil samples for changes in microbial populations due to SSA application. However, an early proof-of-concept incubation showed no significant effects of SSA when applied at agronomic P-rates.
1Department of Soil, Water, and Climate, University of Minnesota, Twin Cities
Additional information:
Bierman P, Rosen C. 1994a. Phosphate and trace-metal availability from SSA. JEQ. 23(4):822-830. Bierman P, Rosen C. 1994b. SSA effects on soil chem-prop and growth of lettuce and corn. Comm in SS and Plant Analysis. 25(13-14):2409-2437. Crants, J., C. Rosen, C. Blake, and M. McNearney. “Is SSAa Safe and Effective Phosphate Fertilizer?” U of Minn, 2015. Abs. Syn in Sci: Partn .for Sol. ASA, CSSA, SSSA, 16 Nov. 2015. Jasinski, S. “Phosphate Rock Statistics and Information.”Phosphate Rock Stat. and Info., USGS, 2017. Walker, J., et al. A Plain English Guide to the EPA Part 503 Biosolids Rule , USEPA, Off. of Ww. Mgmt, 1994.
Acknowledgements:
Metropolitan Council, Rosen Lab field crew, Rosemount Research and Outreach Center field crew, Department of Soil, Water, and Climate field crew
The authors are solely responsible for the content of these proceedings. The technical information does not necessarily reflect the official position of the sponsoring agencies or institutions represented by planning committee members, and inclusion and distribution herein does not constitute an endorsement of views expressed by the same. Printed materials included herein are not refereed publications. Citations should appear as follows. EXAMPLE: Authors. 2019. Title of presentation. Waste to Worth. Minneapolis, MN. April 22-26, 2019. URL of this page. Accessed on: today’s date.
Manage Cookie Consent
To provide the best experiences, we use technologies like cookies to store and/or access device information. Consenting to these technologies will allow us to process data such as browsing behavior or unique IDs on this site. Not consenting or withdrawing consent, may adversely affect certain features and functions.
Functional
Always active
The technical storage or access is strictly necessary for the legitimate purpose of enabling the use of a specific service explicitly requested by the subscriber or user, or for the sole purpose of carrying out the transmission of a communication over an electronic communications network.
Preferences
The technical storage or access is necessary for the legitimate purpose of storing preferences that are not requested by the subscriber or user.
Statistics
The technical storage or access that is used exclusively for statistical purposes.The technical storage or access that is used exclusively for anonymous statistical purposes. Without a subpoena, voluntary compliance on the part of your Internet Service Provider, or additional records from a third party, information stored or retrieved for this purpose alone cannot usually be used to identify you.
Marketing
The technical storage or access is required to create user profiles to send advertising, or to track the user on a website or across several websites for similar marketing purposes.