Even though we may not realize it, use of per- and polyfluoroalkyl substances (PFAS) are a part of our everyday lives. This webinar is centered around the potential impacts PFAS can have on agricultural production. This presentation was originally broadcast on February 19, 2021 in partnership with NRCS Conservation Webinar series. Continue reading “PFAS in Agricultural Operations”
PFAS – What is in Your Water?
This webinar provides a basic understanding of PFAS. Some of the questions that are answered include: What is PFAS? Where did it come from? Where is it found? What are the potential issues related to PFAS? This is the first of a two-part series on PFAS and will focus mainly on water related factors and concerns. This presentation was originally broadcast on October 30, 2020. Continue reading “PFAS – What is in Your Water?”
Livestock Waste Management For Protecting Water Quality
Does Siting Matter Relative to Cattle Feeding and Water Quality?
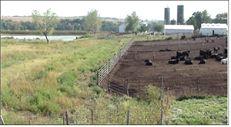
The site selection and management of cattle feeding facilities has a substantial impact on water quality in Kansas. Site location within the prevailing topography and management of cattle feeding pens is imperative to maintaining quality in the waters of the state. There are several factors which should receive consideration when selecting a site that cattle feeding pens will be constructed, as well as factors that demand attention when managing an existing facility.
What did we do?
Cattlemen planning to build a new cattle feeding facility, or perhaps expand an existing facility consider several aspects in relation to water quality. The number of the cattle that will be in the facility, and the size of those cattle are the first considerations. Feeding facilities that feed 300 animal units or more are required to register with KS Department of Health and Environment.. The amount of time cattle are in the pen is a major consideration. Many facilities will have cattle in the pens year-round, but some will only feed cattle for six months or less.
Other considerations when determining a cattle feeding facility include the slope of pen area, which is preferably 1 to 3 percent. The slope of the pen to soils designated as “flooded” is best if relatively flat, no more than 2 percent preferred. The greater the distance to the “flooded” soil, the better. The amount of rainfall and the rainfall intensity for the specific area of the state is noted, and all extraneous drainage should be diverted upslope of the pen area.
 A buffer down-slope of the pen area is essential to managing water quality. The buffer area should be on permeable soils and covered with dense grass. The buffer size should be more than equal to the footprint of the pen, and it is preferred that it be twice the area of the pen. Size of the buffer is influenced by the soils, The more permeable the soil, the greater the infiltration rate, reducing the need for increased size of the buffer area.
Groundwater is carefully protected in Kansas, and livestock feeding facilities must be located in areas that are not deemed “ground water sensitive.” Depth to groundwater of all facilities is recorded as well as distance to any existing wells.
Management
The management of the feeding pen system is imperative to maintaining quality water. Pens need to be cleaned regularly to reduce solids leaving the pen and to ensure buffer vegetation is vigorous and free of weeds. The buffer should be hayed to remove nutrients from the system. The pens should be designed and maintained so that runoff leaving pens should flow evenly into and across the buffer to avoid channeling.
The management of livestock waste in cattle feeding facilities deserves the same attention to detail as ration formulation and health protocols.
What have we learned?
The Kansas Center for Agricultural Resources and the Environment, a department of Kansas State Research and Extension, employees a team of five Watershed Specialists who assist cattle producers who routinely keep cattle confined. These specialists work closely with the producer, K-State and the Kansas Department of Health and Environment to make sure cattle facilities are designed in a water quality responsible manner. In addition, these specialists provide educational outreach, design and promote “off stream” water development, encourage restricting cattle from ponds, and advise on proper grazing management of forage resources.
In the past 4 years, these specialists have consulted with 805 livestock producers, affecting over 34,000 animal units. From their efforts, Kansas waterways have seen a reduction in each year of 211,000 pounds of nitrogen, 88,000 pounds of phosphorus and 346 tons of sediment.
Future Plans
Continue educating cattle producers about the importance of properly sited and managed livestock feeding facilities, and helping them achieve water quality responsible goals.
Authors
Jeff Davidson, KSU Watershed Specialist jdavidso@ksu.edu
Ron Graber, KSU Watershed Specialist
Additional information
Jeff Davidson, jdavidso@ksu.edu
Ron Graber, rgraber@ksu.edu
Acknowledgements
EPA 319 funds are a major contributor to this program
The authors are solely responsible for the content of these proceedings. The technical information does not necessarily reflect the official position of the sponsoring agencies or institutions represented by planning committee members, and inclusion and distribution herein does not constitute an endorsement of views expressed by the same. Printed materials included herein are not refereed publications. Citations should appear as follows. EXAMPLE: Authors. 2015. Title of presentation. Waste to Worth: Spreading Science and Solutions. Seattle, WA. March 31-April 3, 2015. URL of this page. Accessed on: today’s date.
Environmental Footprints of Beef Produced At the U.S. Meat Animal Research Center
![]() Waste to Worth home | More proceedings….
Waste to Worth home | More proceedings….
Why Study the Environmental Footprint of Beef?
As a major contributor in food production, beef production provides a major service to our economy that must be maintained. Production of cattle and the associated feed crops required also impact our environment, and this impact is not well understood. Several studies have determined the carbon footprint of beef, but there are other environmental impacts that must be considered such as fossil energy use, water use, and reactive nitrogen loss to the environment. Because of the large amount of data available to support model evaluation, production systems of the U.S. Meat Animal Research Center were simulated with the Integrated Farm System Model for the purpose of evaluating the environmental impact of the beef cattle produced.
What Did We Do?
The environmental footprints of beef produced at the U.S. Meat Animal Research Center (MARC) in Clay Center, Nebraska were determined with the objective of quantifying improvements achieved over the past 40 years. Relevant information for MARC operations was used to establish parameters representing their production system with the Integrated Farm System Model. The MARC farm, cow calf and feedlot operations were each simulated over recent historical weather to evaluate performance, environmental impact and economics. The current farm operation included 2,078 acres of alfalfa and 2,865 acres of corn to produce feed predominately for the beef herd of 5,500 cows, 1200 replacement heifers and 3,724 cattle finished per year. Spring and fall cow calf herds were fed on 24,000 acres of pastureland supplemented through the winter with hay and silage produced by the farm operation. Feedlot cattle were backgrounded 3 mo on hay and silage and finished over 7 mo on a diet high in corn grain and wet distiller’s grain.
What Have We Learned?
Model simulated predictions for weather year 2011 were within 1% of actual records for feed production and use, energy use, and production costs. A 25-year simulation of their current production system gave a carbon footprint of 10.9 lb of CO2 equivalent units per lb body weight (BW) sold, and the energy required to produce that beef was 11,400 Btu/lb BW. The total water required was 2,560 gallon/lb BW sold, and the water footprint excluding that obtained through precipitation was 335 gallon/lb BW. Reactive N loss was 0.09 lb/lb BW, and the simulated total cost of producing their beef was $0.96/lb BW sold. Simulation of the production practices of 2005 indicate that the use of distiller’s grain in animal diets has had a small impact on environmental footprints except that reactive N loss has increased 10%. Compared to 1970, the carbon footprint of beef produced has decreased 6% with no change in the energy footprint, a 3% reduction in the reactive N footprint, and a 6% reduction in the real cost of production. The water footprint, excluding precipitation, has increased 42% due to greater use of irrigated corn production.
Future Plans
Now that the modeling approach has been shown to appropriately represent beef production systems, further simulation analyses are planned to evaluate beef production systems on a regional and national scale.
Authors
C. Alan Rotz, Agricultural Engineer, Pasture Systems and Watershed Management Research Unit, USDA/ARS al.rotz@ars.usda.gov
B.J. Isenberg, Research Assistant, The Pennsylvania State University
K.R. Stackhouse-Lawson, Director of Sustainability Research, National Cattlemen’s Beef Association
E.J. Pollak, Director, Roman L. Hruska U.S. Meat Animal Research Center, USDA / ARS
Additional Information
C. Alan Rotz, al.rotz@ars.usda.gov
Acknowledgements
Funded in part by The Beef Checkoff and the USDA’s Agricultural Research Service
The authors are solely responsible for the content of these proceedings. The technical information does not necessarily reflect the official position of the sponsoring agencies or institutions represented by planning committee members, and inclusion and distribution herein does not constitute an endorsement of views expressed by the same. Printed materials included herein are not refereed publications. Citations should appear as follows. EXAMPLE: Authors. 2013. Title of presentation. Waste to Worth: Spreading Science and Solutions. Denver, CO. April 1-5, 2013. URL of this page. Accessed on: today’s date.

