
Meeting crop nitrogen needs with manure while overapplying other nutrients can save the crop farmer the cost of additional fertilizer, but every decision on a farm has consequences. This webinar discusses using whole farm and field-based nitrogen (N) and phosphorus (P) balances to identify opportunities for improvements in nutrient use and monitor the impact of management changes over time, the time necessary to reduce the soil phosphorus levels, and the issues with zinc accumulation in soils. This presentation was originally broadcast on March 15, 2024. Continue reading “Implications of Managing Manure on a Nitrogen Basis”
Whole Farm Nutrient Balance (WFNB) for Pork Production – An Introduction
Contents |
What Is Whole Farm Nutrient Balance?
| Take Home Message |
| WFNB is a method for defining the overall nutrient use facility on a livestock facility including both the animal and cropping system. It encourages comparison of all nutrients entering and exiting a livestock farm with the goal of achieving a ratio of 1 lb input to 1 lb managed output. It also can be used to evaluate all nutrient management options for achieving a sustainable production facility for nutrients. |
A Whole Farm Nutrient Balance (WFNB) is a comparison of the quantity of nutrients, typically nitrogen (N) and phosphorus (P) that enter (inputs) and exit (managed outputs) the farm gate. This measure can be visualized as an “Nutrient Yardstick”. In many ways, it is similar to feed input/output efficiency for animal (lbs of feed per lb of gain). These indicators compare inputs used to achieve a useful output. Smaller ratios suggest better performance. A WFNB describes the “whole farm’s” efficiency for utilizing nutrients and is an important indicator of a farm’s environmental performance.
Common sources of nutrients entering a farm (Inputs) include purchased animals, feeds, and fertilizers. Nitrogen fixed by legumes and nitrate contained in irrigation water represent additional N inputs. The Managed Outputs (useful products) include animals and crop sold and manure shipped to off-farm uses.
If there are more Input nutrients than Managed Output nutrients, the difference is a nutrient Imbalance. This Imbalance represents nutrients that may be lost to the environment by either air and water pathways as well as those nutrients that accumulate on the farm (e.g. increased soil P levels). An Imbalance suggests a potential environmental risk.
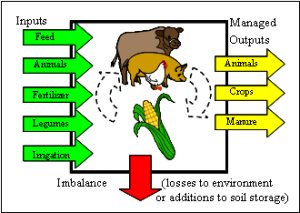
Whole Farm Nutrient Balance estimates nutrient use efficiency by comparing products entering (inputs) and exiting (managed outputs) the farm. Only products with an N or P component are included.
This balance measures only those nutrients that cross the boundary of the farm and does not directly track nutrients flows within the farm. Using the feed to gain analogy, as a pork producer you are not too concerned about the efficiency of internal organs such as the gastrointestinal tract’s ability to capture nutrients for the pig to utilize. However, you are aware that these internal processes affect the overall feed to gain ratio. Similarly, those internal processes (e.g. efficiency of utilization of manure in the cropping system) affects the quantity of nutrient inputs into the farm (e.g. purchased fertilizer inputs to the farm). Thus, a WFNB measure is reflective of multiple internal on-farm processes affecting nutrient efficiency.
WFNB also provides an indicator of the magnitude of direct nutrient losses (e.g. ammonia into the air or nitrate in the soil) and accumulations that add to a farm’s environmental risk (e.g. P buildup in the soil). Regulatory agencies are increasingly asking questions about these losses and accumulations. WFNB provides a producer with a relatively simple method for understanding these losses and accumulations and a means of tracking management changes that produce environmental benefits.
Why is A Measure of WFNB Important?
Permitted livestock operations are being asked to provide annual reports to a permitting authority (state regulatory agency or EPA) that provide indirect indicators of nutrient plan implementation. Producers are also required to keep extensive records of planning procedures, plan implementation, sampling, and inspections. Again these records provide indirect indicators of environmental performance. Finally, all producers are required to implement the same best management practices (BMP) whether they are producing pork in Nebraska, North Carolina, or Indiana. However, the effectiveness of these BMP is highly site and size specific.
WFNB provides a “potential” opportunity to set a common performance based goal for all livestock producers but allow individual producers latitude in determining how to reach that goal. It also provides a means of measuring an individual farm’s progress towards that goal. Setting environmental goals based upon a WFNB measure may give a producer greater flexibility and control in achieving an environmentally sustainable animal operation. It may also provide a simpler and more accurate means of documenting environmental performance.
It must be emphasized that WFNB only has the “potential” for achieving these goals. It has been used in policy implementation in Europe but has seen only limited application in the US. At this time WFNB is strictly a voluntary tool a producer may chose to use to track environmental performance.
What Decisions Might Result from Understanding WFNB?
- A farm’s WFNB can be used to evaluate alternative nutrient strategies. For example by knowing the magnitude of the fertilizer input, the potential improvement in WFNB that might result from an improved manure use plan can be forecasted. Other nutrient strategies contributing to an improved WFNB can also be evaluated including manure export, alternative cropping systems, alternative feeding programs.
- A farm’s WFNB provides a mechanism for comparing fertilizer vs. feed inputs, typically the two largest sources of nutrients. A recognition of which input is larger provides guidance as to which of those nutrient strategies that will be most effective for reducing an imbalance.
- A farm’s WFNB can be compared to a larger set of farms to gage a farm’s performance relative to its peers.
What Information Would a Producer Need to Assemble?
Several tools are available for estimating WFNB including a pork specific spreadsheet “Calculating My Farm’s Whole Farm Nutrient Balance”. To use this product you will need to have access to the information in table 1.
| Nutrient Flow | Information Required | Information Source | Do I Have This? |
|---|---|---|---|
| Nutrient Inputs | |||
| Purchased Feed | Quantity | Farm records | space |
| Protein and P concentration | Farm record of feed analysis | space | |
| Purchased animals | Number of animals | Farm records | space |
| Average animal weight | Farm records | space | |
| N and P concentration | Book value in spreadsheet | space | |
| Purchased Fertilizer | Product type and amount | Farm records of purchased fertilizers | space |
| N and P concentration | Book value in spreadsheet with option for adjustment | space | |
| Legume Fixed Nitrogen | Acres not manured | Farm records | space |
| Legume crop yield | Farm records | space | |
| Nitrates in Irrigation Water | Amount of water pumped | Farm records | space |
| Water sample with nitrate concentration | Farm records | space | |
| Managed Nutrient Outputs | |||
| Crops Sold | Type and Quantity | Farm records | space |
| Protein and P concentration | Book Value in spreadsheet with option for adjustment | space | |
| Animals Sold | Number of animals | Farm records | space |
| Animal weight | Farm records | space | |
| N and P concentration | Book value | space | |
| Manure Transferred to Off-Farm Users | Amount | Farm records | space |
| N and P concentration | Farm records – Manure analysis | space | |
Results of On-Farm Measurement of WFNB
Return to Introductory Page for WFNB Resources
Authors: Rick Koelsch, University of Nebraska; Joe Lally, Iowa State University; Alan Sutton, Purdue University
This project was funded by The National Pork Board
Impact of Farm Size on Whole Farm Nutrient Balance (WFNB)
| Take Home Message |
| Both the number of animals and the size of the land base were not observed to influence WFNB. These pork producers have adopted nutrient management strategies that have diminished the importance of size relative to the management of nutrients. These results call into question the value of determining which facilities need a permit based upon size. |
Click here for introduction to WFNB
Farm size as measured by animal capacity is often the basis for determining which animal production facilities will be regulated and to what extent. For swine operations, a threshold of 2400 pig capacity (finishing and reproductive herd) often triggers the requirement of a federal permit under Concentrated Animal Feeding Operations rules of the National Pollutant Discharge Elimination System program. However, for the 13 farms involved in this study of Whole Farm Nutrient Balance (WFNB), size proved to be a poor indicator of the efficiency of nutrient utilization or potential for nutrient losses from the farm.
Whole Farm Nutrient Balance (WFNB) vs. Swine Facility Size
Size of the pig operation does not explain the variability in WFNB as illustrated by the flat regression lines in Figure 1 for both nitrogen (N) and phosphorus (P) balances. Based upon an analysis of WFNB, three farms experience N or P whole farm balance ratios of 2 to 1 or greater. They included a 2000-head and a 3,400-head finisher, as well as a 6,200 sow and finish facility. These results suggest that farm size has little impact on the efficiency with which nutrients can be managed.
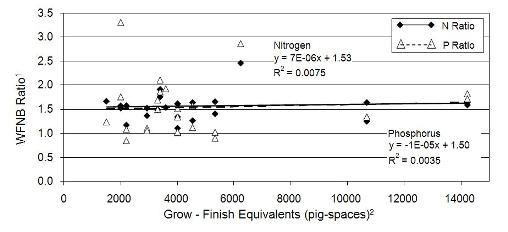
Figure 1: Whole farm N and P balance for 13 swine farms vs size of pork production unit.
1 WFNB Ratio is a ratio of all nutrients, N and P for this summary, that enter the farm (inputs) to all nutrients that exit the farm as managed products (managed outputs). See WFNB Introduction for a more complete explanation.
2 Grow finish equivalents included nursery pigs and sows. Nursery pigs and sows were converted to a grow-finish equivalent based upon a comparison of average feed intake.
WFNB vs. Cropland Base
Access to a larger land base has often been associated with better utilization of manure nutrients. However, producers have found options for managing manure in situations where the land base is insufficient. In one of the case studies a farm with no land base had a WFNB of 2.1, similar to other producers with much larger land bases. Data from the 13 case farms (Figure 2) demonstrates that access to greater land areas does not result in improved efficiency of nutrient utilization by the participating swine farms.
Manure export was used by seven of the 13 producers in one or more years as a means of accessing land base that they do not own or manage. Others employed diets low in crude protein or phosphorus to partially compensate for limited land access. These modifications to the overall farm’s management of nutrients resulted in a level of WFNB that does not change with the size of the land base owned or managed by the participating producers.
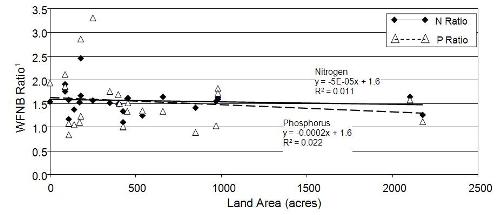
Figure 2: Whole farm N and P balance for 13 swine farms vs crop production land base.
1 WFNB Ratio is a ratio of all nutrients, N and P for this summary, that enter the farm (inputs) to all nutrients that exit the farm as managed products (managed outputs). See WFNB Introduction for a more complete explanation.
2 Grow finish equivalents included nursery pigs and sows. Nursery pigs and sows were converted to a grow-finish equivalent based upon a comparison of average feed intake.
The concentration of animals to the land base is also an important consideration and is reviewed in a separate fact sheet accessible from the Introductory Page.
Results of On-Farm Measurement of WFNB
Return to Introductory Page for WFNB Resources
Authors: Rick Koelsch, University of Nebraska; Joe Lally, Iowa State University; Alan Sutton, Purdue University
This project was funded by The National Pork Board Project
Pig Density Impacts on WFNB
| Take Home Message |
| The density of pigs per unit of crop land is of some importance for determining whole farm nutrient balance. Higher densities tend to result in greater imbalances, although the variability observed was only partially explained by pig density. No recommended or threshold value for pig density per crop acre could be identified from the study. |
Click here for introduction to WFNB
The relationship between the numbers of pigs raised on a swine farm to the numbers of acres to support this production unit is often called animal density. This measurement has been used in the past to relate the estimated amount of manure nutrient production from pigs to the amount of land that can utilize these nutrients for productive purposes i.e., crop production. However, using this measurement may give erroneous results because of the variety of nutrient management options available to pork operations. A whole farm nutrient balance (WFNB) study was conducted for two years (2006-2007) on 13 swine farms in the Midwest US. This fact sheet summarizes a comparison of animal density with WFNB or the farms overall measure of nutrient use efficiency. For more information about the farms involved in this study go to Overview of Nutrient Management Lessons Learned. Following are some observations from this study concerning the relationship of pig density to WFNB.
Pig Density
The relationship of pig density (grow-finish pig capacity per acre of available land area that can receive manure applications for crop production) to the WFNB for nitrogen (N) and phosphorus (P) as a ratio of N or P inputs to managed outputs was analyzed for the 13 swine farms during the two year study. Figure 1 shows the results of this relationship. There was a very weak conclusive effect or relationship of pig density per acre of land area on both N and P balance.
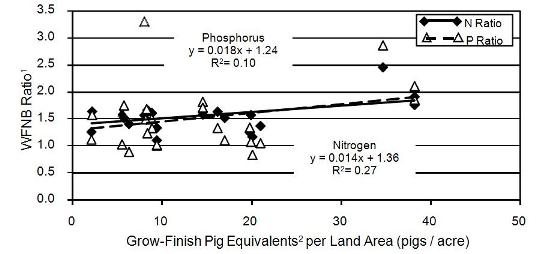
Figure 1: Whole farm nutrient balance for 13 swine farms vs. animal density.
1 WFNB Ratio is a ratio of all nutrients, N and P for this summary, that enter the farm (inputs) to all nutrients that exit the farm as managed products (managed outputs). See WFNB Introduction for a more complete explanation.
2 Grow finish equivalents included nursery pigs and sows. Nursery pigs and sows were converted to a grow-finish equivalent based upon a comparison of average feed intake.
Therefore, animal density alone is not effective in describing the nutrient use efficiency as describe by WFNB Ratio of a specific farm. Nutrient balance is also impacted by storage system type, feed program, crop nutrient management plan implementation, and export of manure (see additional fact sheets for details). As noted in Figure 1, there was considerable variation in the relationship of pig density to N and P balance with more variation in P balance than N balance. This reinforces the need to evaluate each specific farm independently for N and P balance considering the unique characteristics of the farm management, resources and other factors that can impact nutrient flow. A spreadsheet is available to determine the WFNB on any specific producer’s swine farm.
Summary
Pig density (pig capacity per acre land) is not a very effective indicator alone for N and P balance on a pork production unit. Many other aspects of the farm must be considered and evaluated to determined direct impact on N and P balance.
Results of On-Farm Measurement of WFNB
Return to Introductory Page for WFNB Resources
Authors: Alan Sutton, Purdue University; Rick Koelsch, University of Nebraska; Joe Lally, Iowa State University
This project was funded by The National Pork Board Project
Impact of Feed Management on WFNB
Contents |
Why is Feed Management Important?
| Take Home Message |
| Feed is the single largest source of nutrients brought onto swine farms, averaging 79 to 85% of nutrient inputs for the 13 farms in this study. Feed management decisions that impact dietary nutrient concentration and feed use efficiency are the most significant factors in explaining WFNB. Implementing available feeding technologies will reduce nutrient excretion and improve nutrient sustainability on many swine farms. |
Click here for introduction to WFNB
Feeding swine is the highest economic cost (65 to 70%) for the pork operation. In addition, diet formulation and utilization of the nutrients in the ration by pigs has a major influence on the excretion of nutrients and potentially the balance of the nutrients on a farm. If larger amounts of nitrogen (N) and phosphorus (P) are imported (inputs – animals, feed, and fertilizer purchases, legume fixed N, and N in irrigation water) on the farm compared to the amount of N and P exported off the farm (managed outputs – sale of pigs, crops and/or exported manure) then there is a nutrient imbalance which leads to nutrient accumulation on the farm. A whole farm nutrient balance (WFNB) study was conducted for two years (2006-2007) on 13 pork production operations ranging in size from 2,000 to 16,000-head finisher capacity. For more information about the farms involved in this study go to Overview of Nutrient Management Lessons Learned. Following are some observations from this study related to the feeding programs of the farms and feed management.
| Average Inputs, Outputs, or Balance (lbs/year) | Portion of Total Inputs or Outputs (%) | Average Inputs, Outputs, or Balance (lbs/year) | Portion of Total Inputs or Outputs (%) | |
|---|---|---|---|---|
| space | Nitrogen Balance | Phosphorus Balance | ||
| Inputs | ||||
| Animals | 7,700 | 3% | 1,700 | 4% |
| Feed | 175,700 | 79% | 31,900 | 84% |
| Fertilizer | 24,800 | 11% | 4,200 | 11% |
| Legumes | 13,300 | 6% | space | space |
| Irrigation | 1,800 | 1% | space | space |
| Total Inputs | 223,500 | 100% | 37,800 | 100% |
| space | ||||
| Managed Outputs | ||||
| Animals | 69,600 | 47% | 13,600 | 54% |
| Crops | 67,100 | 46% | 9,800 | 39% |
| Manure1 | 10,000 | 7% | 1,900 | 8% |
| Total Outputs | 146,800 | 100% | 24,800 | 100% |
| Imbalance | 76,600 | space | 12,400 | space |
| Input/Managed Output Ratio2 | 1.5 to 1 | 1.5 to 1 | ||
Input of Nutrients
Average N and P inputs on the 13 swine farms from feed purchases made up 79% of the total N inputs and 84% of the P inputs for the two year period (Table 1). The range of N inputs from feed was 20 to 95% and the range of P inputs from feed was 23 to 100% for the farms over the two year period. A majority of purchased feed inputs for the farms ranged from 77 to 95% for N and 71 to 100% for P. Farms with lower N and inputs from purchased feed utilized corn grown on the farm versus the purchase of corn for most or all of rations fed. A more common practice is to sell corn grown on the farm and purchase a complete ration including the corn from a feed mill. The average ratio of N and P inputs to managed outputs2 averaged 1.5 for each. However, the range of ratios of N and P inputs to outputs were 1.1 to 2.5 and 0.8 to 2.9, respectively.
Diet Composition
The average dietary crude protein and P levels were measured for the diets fed during the duration of this study. . Figures 1 and 2 demonstrate the relationship of the dietary crude protein and total dietary P levels to the WFNB ratio of N and P inputs to outputs on the pork operations.

Figure 1. Whole farm N balance for 13 swine farms vs. dietary crude protein level.
Average dietary protein levels ranged from 13.8 to 18.6% across all operations. There was no impact of dietary crude protein level on the ratio of N inputs to outputs which was surprising. Apparently, even though it was anticipated that the increased crude protein in the diet would increase N excretion and an imbalance in the N ratio, there are other circumstances that over-shadowed any direct impact of crude protein level on N ratio. While the reasons are unknown, there may have been significant differences on N losses during manure storage or other farm system components (e.g. direct ammonia emission from animal housing) which may have overshadowed these results.

Figure 2. Whole farm P balance for 13 swine farms vs. dietary phosphorus level.
There was an indication of an increase in the WFNB ratio of P inputs to outputs as affected by increases in total P in the diet. Average dietary total P levels ranged from 0.40 to 0.75%. The highest (0.75%) P diet content of one farm was due to being a gilt development operation which required higher dietary P levels for improved bone development and longevity in the breeding herd. Although other P inputs from purchased fertilizer can have an impact on the ratio of P inputs to outputs, it is clear that total dietary P is a major factor impacting this ratio. Therefore, any means of improving ingredient availability of P by the use of phytase or utilizing more biologically available P ingredient sources would reduce the amount of inorganic P in the diet. The widespread adoption of these feeding technologies has likely produced significant improvement in swine WFNB in recent years.
Feed Efficiency
The comparison of feed efficiency with WFNB further suggests the importance of feed management decisions (Figure 3). Lower feed required per pound of gain was associated with farms with better whole farm nutrient balances. The combination of dietary concentration (Figure 2) and feed efficiency (Figure 3) explains more than half of the variability observed in Whole Farm Nutrient Balance.

Figure 3. Impact of feed utilization efficiency on Whole Farm Nutrient Balance. Farrow to finish and gilt finishing results (5 data points) were removed from data set.
Practical Applications
Comparing the total dietary P levels in a swine farm with the ratio of P inputs to outputs reveals that a reduced total dietary P resulted in lower P ratios. For example, a finisher operation that had an average 0.62% total dietary P level across the feeding period the first year was reduced to 0.55% total dietary P the second year and resulted in a change in the ratio of P inputs to outputs from 1.9 the first year to 1.7 the second year. Another example showed that the reduction of the total dietary P for a gilt development farm was from 0.75% total dietary P the first year to 0.66% total dietary P the second year plus no purchase of P fertilizer resulted in the P ratio dropping from 3.3 to 1.8 in one year.
A spreadsheet calculator can be used to determine the potential benefits of reducing the dietary total P level in the diet. Table 2 summarizes an example exercise for one farm. For example, if a 4000 head capacity feeder pig to finish operation with 440 acres in a corn and soybean rotation (Farm A2) currently has a 0.46% total dietary P level. When comparing a lower (0.40% dietary P if phytase and/or ingredients with high P availability is used) and a higher dietary P level (0.60% dietary P), the WFNB ranges from a low of 0.9 to 1 to a high of 1.3 to 1 for P. When the average crude protein levels changed from 16.9% (current practice) to 15.5% or 14.0% (diets based upon crystalline amino acid inclusion or change in dietary ingredients with more digestible amino acids) with this farm, the N balance was reduced and the N ratio for inputs to outputs were reduced from 1.1 to 1.0 and 0.95, respectively. These changes may result in a need for additional N and P purchased fertilizer to meet the needs of the corn/soybean rotation for this 440 acre swine farm no longer met by the nutrients in excreted manure.
| Current Ration | Change 1 | Change 2 | |
|---|---|---|---|
| % Dietary Crude Protein | 16.9% | 15.5% | 14.0% |
| N Imbalance (lbs/yr) | 18,300 | 5,100 | -9,000 |
| N ratio2 | 1.11 to 1 | 1.03 to 1 | 0.95 to 1 |
| space | |||
| % Dietary Phosphorus | 0.46% | 0.40% | 0.60% |
| P Imbalance (lbs/yr) | 700 | -2,900 | 8,800 |
| P ratio2 | 1.02 to 1 | 0.90 to 1 | 1.30 to 1 |
Summary
Altering the diet formulation of swine rations can have a significant impact on the excretion of nutrients and the WFNB of a farm especially P. Choice of feed ingredients and/or the use of additives that enhance availability of dietary nutrients can help reduce nutrient excretion and reduce farm nutrient imbalances.
Results of On-Farm Measurement of WFNB
Return to Introductory Page for WFNB Resources
Authors: Alan Sutton, Purdue University; Rick Koelsch, University of Nebraska; Joe Lally, Iowa State University
This project was funded by The National Pork Board Project
Note: This page is still undergoing the peer review process.
1Manure exported from farm.
2For explanation of WFNB Ratio, Inputs and Managed Outputs, refer to Introduction to WFNB