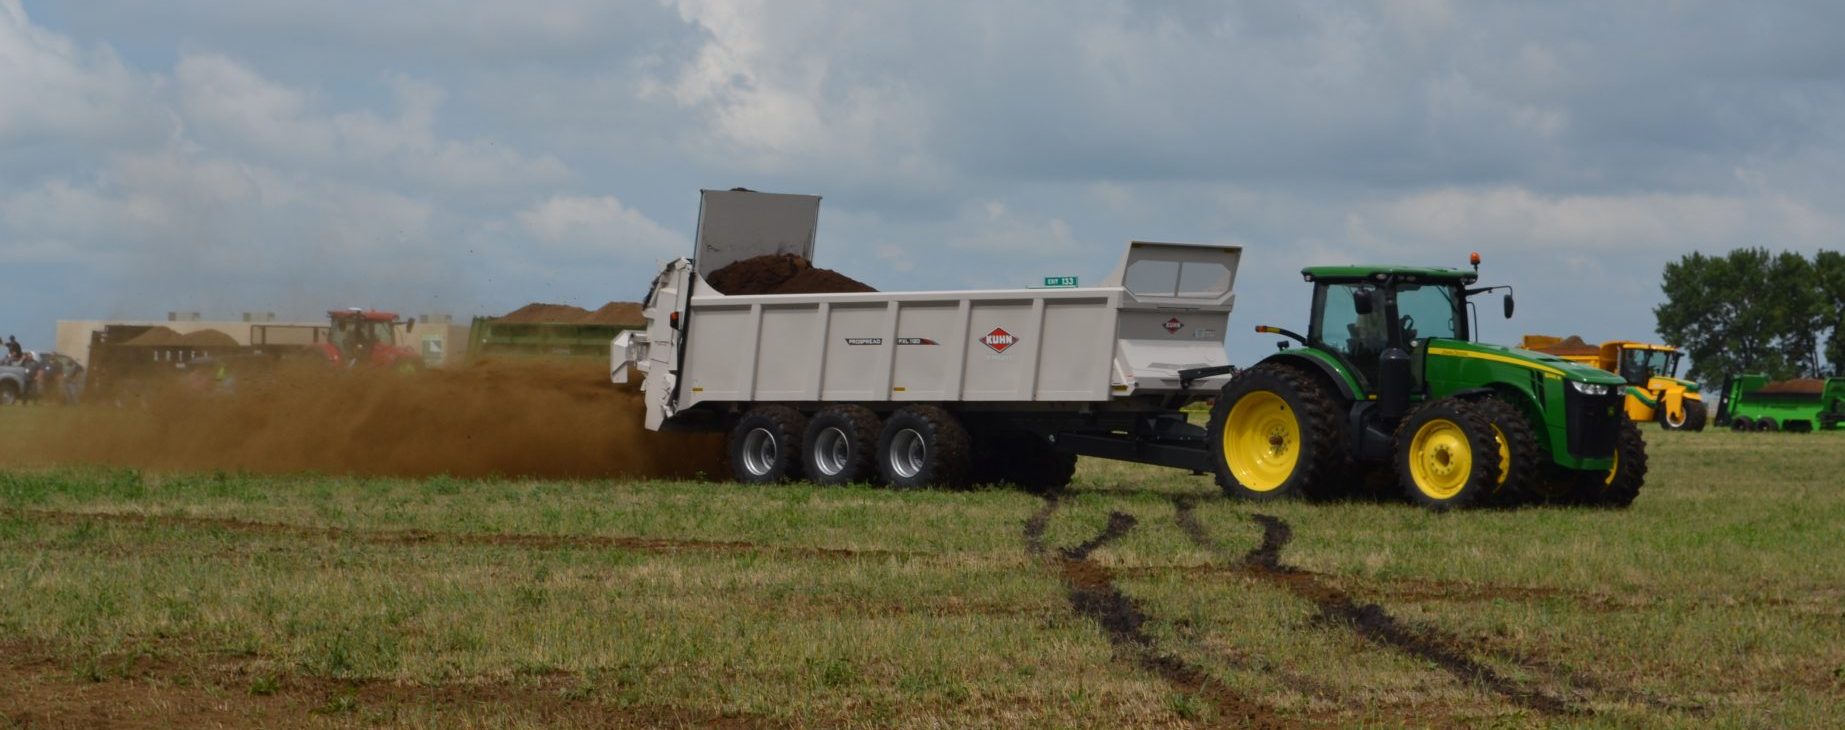

Summary of Manure Handling Certification Programs Across the United States

Purpose

Effective management of manuresheds is important to address regional mass nutrient imbalances of manure nitrogen and phosphorus (Speigal et. al., 2020). To date, a summary description of state-level certification programs of those that apply, transport, or broker manure has not been published in literature. The purpose of this research (Flynn et. al., 2025) was to: 1) enumerate and characterize manure handling certification programs across the US; 2) investigate correlation of state programs and manure surpluses/regional manureshed source areas; and 3) explore a Wisconsin case study focused on voluntary, market-based, statewide certification and correlation with reduced manure spills and safe land application.

What Did We Do?

Thorough internet examinations of state agency and university websites were used to compile descriptive data for state manure hauling, brokering, and application certification requirements. Data from a Qualtrics survey used to gather further details of certification programs received input from university or agency professionals from all 50 states. Data from the internet search and survey was compiled, quantified, and placed in a data repository (Erb, Inaoka, and Meinen, 2024). A case study summarized information from historical surveys, reports, and conference proceedings and reported impacts of certification and associated educational programming in the state of Wisconsin (e.g. Erb, 2022; Erb, 2024; Erb et. al., 2011; Erb et. al., 2021; Erb, Kostelny, et. al., 2024; Erb, et. al., 2009; Erb et. al., 2015; Erb and Stieglitz, 2007).

What Have We Learned?

Legal definitions of certification are diverse among states but can largely be defined as legal permissions to handle manure. Certification programs are present in 26 of 50 states. Certifications were placed into three categories: farmers, professional manure transporter/applicators, and manure brokers. Many states certify individuals in more than one category, that may be mandatory or voluntary. Categorization of certification programs revealed the following:

    • Producer certification existed in 21 states (15 mandatory, 6 voluntary).
    • Transporter/Applicator certification existed in 20 states (13 mandatory, 7 voluntary).
    • Broker certification existed in 10 states (7 mandatory, 3 voluntary).

When certification characterization was transferred to maps there were no clear standardization or spatial patterns between states. However, when compared to maps of animal concentrations and manureshed surplus areas, it was apparent that certification programs do cover much of the country’s intensive animal production regions. The largest lack of certification programs was in some Appalachian and western states.

Researchers concluded that state, watershed, and manureshed management goals can be assisted through certification of producers, transporters/applicators, and brokers that handle manure. Implementation of multi-state cooperation, standardization, and reciprocation of manure certification programs would assist in goals of parties across state, watershed, and manureshed boundaries.

Authors

Presenting author

Robert J. Meinen. Director Pennsylvania Nutrient Management Education Program, Department of Plant Science, The Pennsylvania State University, University Park, PA, rjm134@psu.edu

Additional author(s) (name, title, and affiliation for each)

    • Colton Flynn. USDA-ARS Grassland Soil and Water Research Laboratory, Temple, TX.
    • Kevin Erb. University of Wisconsin-Madison, Division of Extension, Green Bay, WI.
    • Jenifer L. Yost. USDA-ARS Grassland Soil and Water Research Laboratory, Temple, TX.
    • Mirai Inaoka. Department of Crop Sciences, University of Illinois at Urbana-Champaign, Urbana, IL.
    • Sheri Spiegal. USDA-ARS, Jornada Experimental Range, Las Cruces, NM.

Additional Information

Flynn, K.C., Erb, K., Meinen, R.J., Yost, J.L., Inaoka, M., and Spiegal, S. Manure Handling Certification Programs in Manuresheds Across the United States. Cleaner Waste Systems. February 27, 2025. https://doi.org/10.1016/j.clwas.2025.100241

The authors are solely responsible for the content of these proceedings. The technical information does not necessarily reflect the official position of the sponsoring agencies or institutions represented by planning committee members, and inclusion and distribution herein does not constitute an endorsement of views expressed by the same. Printed materials included herein are not refereed publications. Citations should appear as follows. EXAMPLE: Authors. 2025. Title of presentation. Waste to Worth. Boise, ID. April 7–11, 2025. URL of this page. Accessed on: today’s date.

Soil Property Effect on Nitrogen Mineralization of Dairy Manure in the Pacific Northwest

Purpose

Growers often use total nitrogen (N) concentration of dairy manure to estimate plant available N for crop production. This estimate often does not take into account the role soil properties may have on N mineralization (Nmin) rates. This study aims to determine how soil properties impact Nmin rates of dairy manure and composted dairy manure by aerobic incubation. The soil properties investigated, including soil texture, percent organic matter, pH, EC, buffer pH, NO3-N, NH4-N, Olsen P, K, Ca, Mg, Na, CEC, S, Zn, Fe, Mn, Cu, B, and CaCO3 equivalent, which are all accessible to producers sending soil samples to a commercial soil laboratory. The goal of this project is to incorporate soil properties into N availability prediction models for dairy manure to improve N use efficiency of field-applied manure.

What Did We Do?

A total of 16 different soil series were sampled throughout Oregon, Washington, and Idaho in major dairy producing counties at a 12-inch depth. These soils represent over 1.6 million acres in the Pacific Northwest (PNW). One solid dairy manure was sampled in Idaho and one composted dairy manure was sampled in Oregon to be applied to the soils during incubation. All the soils were analyzed for a full suite of soil physiochemical properties at a local soil testing laboratory. The manures similarly received a full analysis at the same laboratory.

We conducted a 12-week incubation of manure-amended soils at 77°F (25°C), sampling periodically for nitrate and ammonium to determine the difference in Nmin rates with changes in soil physiochemical properties. Approximately 1.1 lbs (500 g) of soil was added to 1-gallon Ziplock bags and brought to 80% field capacity. The soils were treated with dairy manure, composted manure, or no manure at a rate of approximately 400 lb N/acre (200 mg N/kg soil) with four replicates for each soil and treatment. Each of the 192 samples were randomly assigned a sample number corresponding to their location inside the incubator. The closed and loosely rolled bags were stored in 12 by 9 by 7-inch cardboard boxes, then placed inside an incubator at 77°F for 12 weeks. Soils were sampled at weeks 0, 2, 4, 8, and 12, where part of the sample was used to monitor soil moisture, and the other was frozen for future analysis. Analysis of the frozen samples for nitrate and ammonium content was conducted using a microplate spectrophotometer using vanadium (III) chloride and sodium salicylate methods, respectively.

What Have We Learned?

The analysis of frozen samples has just begun at the time of submission. Initial results will be available on the poster presented.

Future Plans

The next steps of this project are to conclude the nitrate and ammonium analysis of the soil samples and create Nmin curves with this data for each soil and treatment. These curves will be analyzed to determine if the differences in Nmin rates correlate with any of the tested soil physiochemical properties and which properties are most influential. Finally, we will create a model based on correlation data to express the changes in nitrogen mineralization depending on soil physiochemical properties that can be used by producers to adjust their dairy manure application rates depending on their soil test results.

Authors

Presenting author

Ryan A. Auld, Soil Science Graduate Student, Oregon State University

Corresponding author

Amber Moore, Extension Soil Fertility Specialist, Oregon State University, Amber.moore@oregonstate.edu

Additional authors

Jennifer Moore, Research Soil Scientist, Forage Seed and Cereal Research Unit, U.S. Department of Agriculture Agricultural Research Service; Yakun Zhang, Associate Professor, Oregon State University; Christopher Rogers, Research Soil Scientist, Northwest Irrigation and Soils Research, U.S. Department of Agriculture Agricultural Research Service

Additional Information

Build DAIRY

Acknowledgements

I’d like to acknowledge the BUILD Dairy program and the Oregon Dairy Farmers Association for their support of this project, as well as the many producers who have allowed me to sample soils from their farms.

The authors are solely responsible for the content of these proceedings. The technical information does not necessarily reflect the official position of the sponsoring agencies or institutions represented by planning committee members, and inclusion and distribution herein does not constitute an endorsement of views expressed by the same. Printed materials included herein are not refereed publications. Citations should appear as follows. EXAMPLE: Authors. 2025. Title of presentation. Waste to Worth. Boise, ID. April 7–11, 2025. URL of this page. Accessed on: today’s date.
Marketability of biodegradable pots by coupling transaction data and survey-based consumer willingness to pay (WTP) estimates

Purpose

Plastic pollution remains a pervasive environmental challenge and identifying economically viable alternatives is imperative. While regulatory efforts primarily target plastic bags, recent research highlights consumer acceptance of biodegradable alternatives across various product categories, including plant pots. However, much of the existing literature relies on estimates for “willingness-to-pay” (WTP) of certain products—according to their attributes—by using survey-based data of potential spending, which may not reflect actual market purchase behavior. This study connects hypothetical WTP survey data with observed market transactions from consumer panel data with the goal of better assessing the market of biodegradable pots.

What Did We Do?

Our analysis focuses on plastic pot store purchases recorded in the NielsenIQ consumer (transaction) panel data from 2006 to 2009. To ensure compatibility with results from a recent study of survey-derived WTP estimates, we restricted the sample to households purchasing a single plastic pot per month. Price purchase data is inflation-adjusted to 2024 values using U.S. Bureau of Labor Statistics (BLS) consumer price index data, updating the purchasing power to that of corresponding survey-based data. Given the limited number of scanner-based purchases (113 observations), we employed bootstrapping—a statistical technique that generates additional observations by repeatedly sampling from the original dataset—to augment the dataset to 471 transactions in order to meet the number of survey data observations.

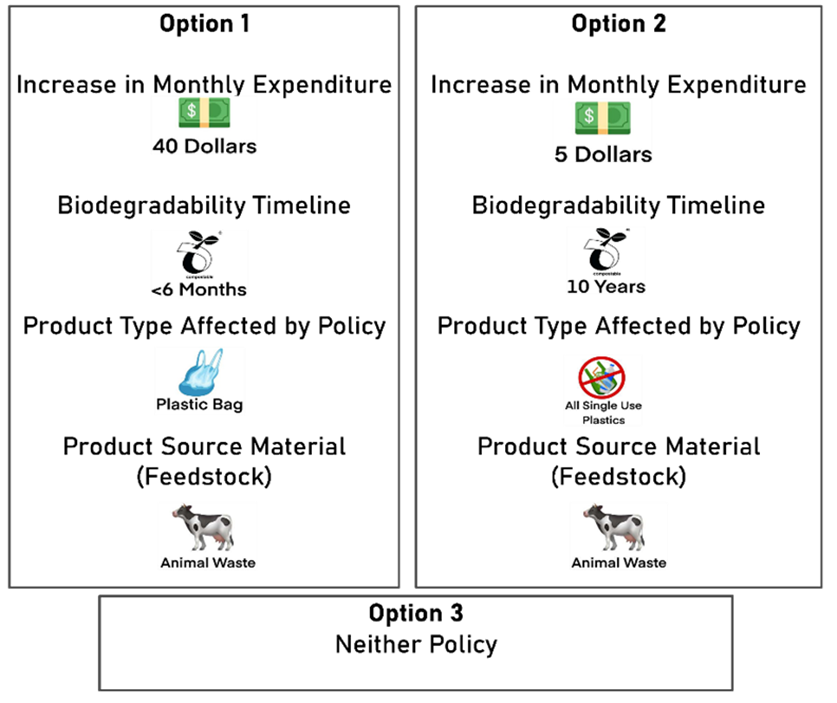
A new price variable (composite price variable) was constructed by taking random market prices and adding random WTP survey data observations. These new prices and their dynamics represent increases in monthly expenditure. We incorporated key product attributes in our model; see details in Table 1 to analyze their effect. Attributes include different periods of biodegradability duration, the type of plastic product targeted by policy or regulation (single use food containers, packaging products, grocery bags, or all single-use products), and the type of bioproduct used (animal waste, agricultural waste, or wood waste feedstock). We estimated a conditional logit model using Stata, which allowed us to compare how consumers valued different options having several product attributes or features—including timespan for biodegradability and type of biodegradable material—when making purchasing decisions.

Table 1: Attribute tableSource: Field, 2024
Table 1: Attribute table
Source: Field, 2024

For the survey implementation, respondents are presented with three options each containing a randomly generated combination of four attributes and can select one option from three given options. A sample shown in Figure 1.

Figure 1: Sample choice blockSource: Field, 2024
Figure 1: Sample choice block
Source: Field, 2024

What Have We Learned?

VARIABLES Parameter Estimates
Previous Price, Increase in Expenditure (X0) -0.014***
(0.0012)
New Price, Increase in Expenditure (X1) -0.013***
(0.0012)
Time to Fully Biodegrade in years (X2) -0.003***
(0.0007)
-0.004***
(0.0007)
Policy targeting:
(i) Single Use Packaging Products (X3) 0.067
(0.0824)
0.112
(0.0833)
(ii) Single Use Food Containers (X4) 0.027
(0.0782)
0.132*
(0.0782)
(iii) All Single Use Products (X5) 0.199**
(0.0888)
0.292***
(0.0842)
Product source:
(i) Animal Waste Feedstock (X6) -0.010
(0.0681)
-0.034
(0.0714)
(ii) Wood Waste Feedstock (X7) 0.015
(0.0661)
0.025
(0.0667)
Neither Option 1 or Option 2 Policy choice (X8) -1.302***
(0.1110)
-1.604***
(0.1100)
Observations 8,478 (471) 8,478 (471)

Column 2 shows estimate of attribute effects from combining transaction and survey WTP data, while Column 3 shows prior survey-based estimates of attribute effects. X₁ represents the New Price Variable in our analysis, while X0 corresponds to the increase in monthly expenditure in survey data analysis. Robust standard errors in parentheses. Asterisks indicate: *** p<0.01, ** p<0.05, * p<0.1

Table 3: Willingness-to-Pay Results ($)
VARIABLES WTP (n = 471) WTP (n = 471)
Time to Fully Biodegrade (years) -0.23 -0.26
Policy targeting:
(i) Single Use Packaging Products 5.15 7.97
(ii) Single Use Food Containers 2.08 9.46
(iii) All Single Use Products 15.31 20.86
Product Source:
(i) Animal Waste Feedstock -0.77 -2.44
(ii) Wood Waste Feedstock 1.15 1.76

Column 2 shows WTP estimates from combining transaction and survey WTP data, while Column 3 shows prior survey-based WTP estimates. All WTP estimates are in USD ($). n represents the total number of observations. Figures in bold represent significance at 5%.

Future Plans

We will incorporate demographic variables into the econometric model to examine how WTP varies across different consumer groups. Producers of biodegradable pots should consider WTP estimates across attributes in their feasibility assessment. Notably, each additional year of biodegradability decreases WTP by $0.23 per month, suggesting a preference for faster decomposition. Meanwhile, consumers exhibit no significant difference in WTP based on whether the bioproduct source is agricultural feedstock, animal waste, or wood waste, indicating flexibility in material choice.

Authors

Presenting & Corresponding author

Sanket Parajuli, Applied Economics Graduate Research Assistant, Department of Agricultural Economics and Rural Sociology, University of Idaho, Para5126@vandals.uidaho.edu

Additional author

Hernan Tejeda, PhD., Associate Professor and Extension Specialist, Department of Agricultural Economics and Rural Sociology, University of Idaho

Additional Information

Field, C. T. (2024). Greenbacks and grazing gambles: Exploring plastic preferences and pasture predicaments in two acts (Master’s thesis, University of Idaho).

U.S. Bureau of Labor Statistics. (2025). Consumer price index data. U.S. Department of Labor. Retrieved February 1, 2025, from https://www.bls.gov/cpi/data.htm

Acknowledgements

We thank USDA NIFA Sustainable Agricultural Systems project IDA02004-CG (Award No. 2020-69012-31871) for supporting this research. We also acknowledge the Kilts Center for Marketing Data Center at the University of Chicago Booth School of Business for providing access to NielsenIQ datasets. The conclusions drawn from the NielsenIQ data are those of the researcher(s) and do not reflect the views of NielsenIQ. NielsenIQ is not responsible for, had no role in, and was not involved in analyzing and preparing the results reported herein.

The authors are solely responsible for the content of these proceedings. The technical information does not necessarily reflect the official position of the sponsoring agencies or institutions represented by planning committee members, and inclusion and distribution herein does not constitute an endorsement of views expressed by the same. Printed materials included herein are not refereed publications. Citations should appear as follows. EXAMPLE: Authors. 2025. Title of presentation. Waste to Worth. Boise, ID. April 7–11, 2025. URL of this page. Accessed on: today’s date.
Use of Orchard Debris for Vermifiltration: Advancing Regenerative Agriculture and Wastewater Treatment

Purpose

This study assesses the economic and air quality benefits of using chipped apple orchard wood as a carbon source in a vermifiltration wastewater system. Instead of burning orchard debris, which releases harmful pollutants, the Perca system repurposes it as a substrate for earthworm-microbial wastewater treatment. The study also compares apple wood chips to traditional conifer chips, evaluating their effectiveness and the broader environmental and economic advantages of diverting orchard waste.

What Did We Do?

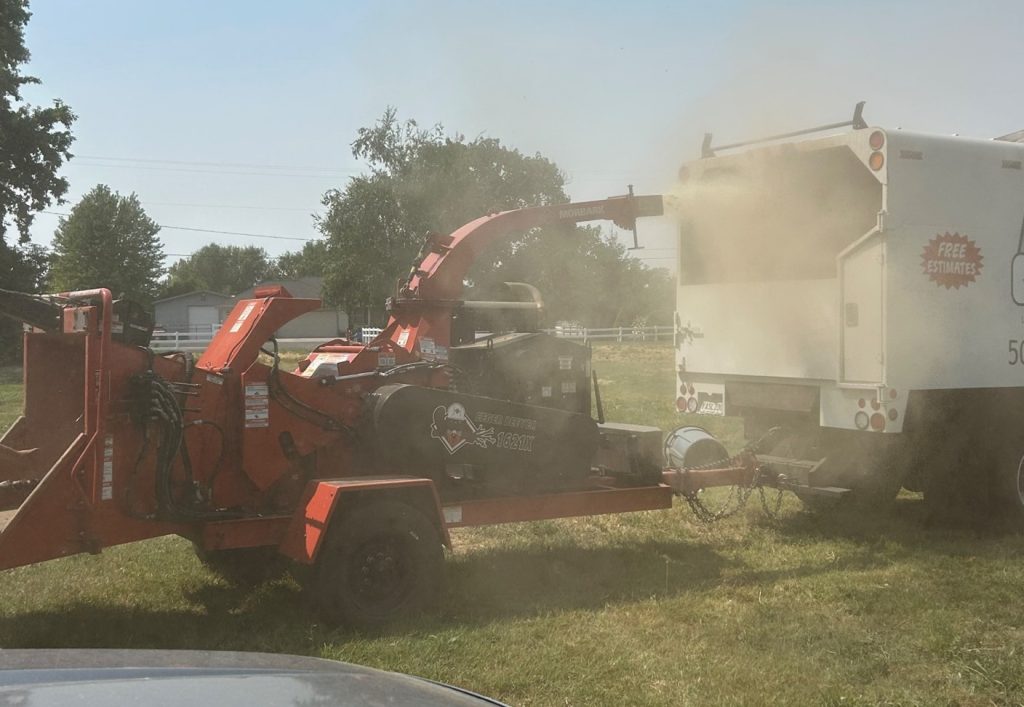
Image 1. Chipping process of apple orchard tear-out debris using Morbark, Eeger Beever, 1621” x 18”x 20.5” feeder throat with 140 horsepower motor.

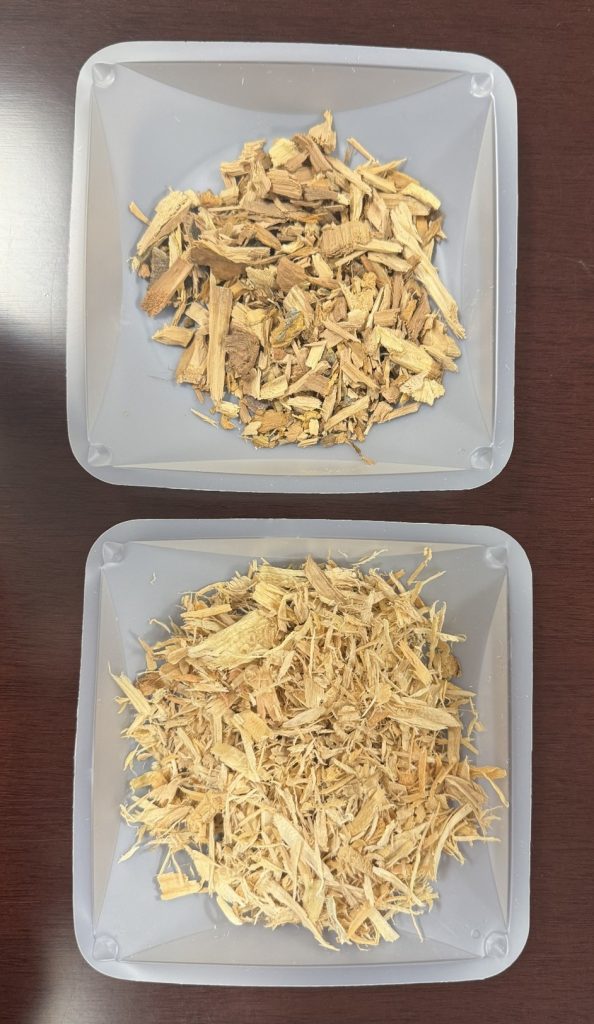
Apple orchard tear-out debris from a local orchard was collected, chipped, and transported for installation as a substrate for the Perca vermifiltration system. Debris was screened to remove foreign materials, chipped to less than ½ inch size, and weighed to calculate tons of usable wood per ton of orchard debris. Data from processing, including chipping costs and labor requirements, were used to assess economic feasibility and air quality impact. In addition, a bench-scale test was conducted to evaluate the efficacy of wastewater treatment by apple orchard chips when compared to the standard conifer chips used in the Perca vermifiltration system. Removal efficiencies of total suspended solids (TSS), biological oxygen demand (BOD), and polychlorinated biphenyls (PCBs) were measured for both substrates.

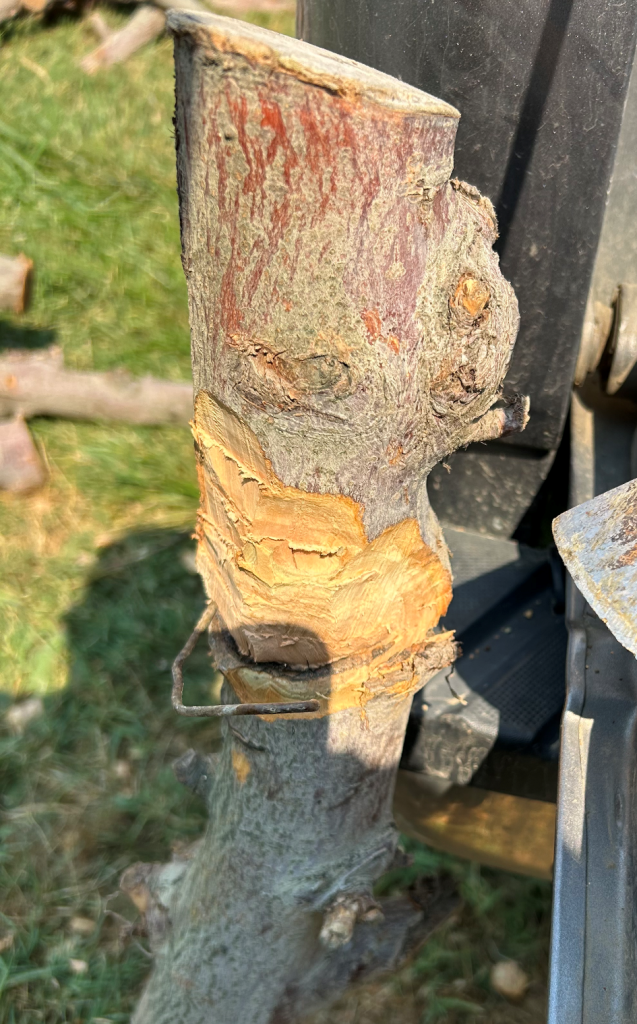
Image 2. Example of foreign objects (wire) embedded in apple wood pieces.

Market projections for Perca’s vermifiltration system show a compound annual growth rate (CAGR) of 113.45%, reaching 9.57% of the market over the next five years. Calculated market projection estimates over 16,000 tons of orchard debris could be converted into a value-added substrate product rather than burning. This shift could eliminate more than 500 tons of emissions between 2025 and 2029. Economic analysis shows that while chipping costs and wood size restrictions pose challenges for trellised orchards, non-trellised orchards offer better yields and lower costs, with market trends and technology advancements pointing toward broader economic feasibility. Bench-scale tests showed that both apple wood and conifer substrates effectively reduced TSS, BOD, and PCBs by more than 80% in all categories with no significant difference in performance, confirming apple debris works as well as conifer media. These findings demonstrate that apple orchard debris provides an environmentally sustainable alternative to burning, thus contributing to improved air quality, while also an efficient, cost-effective vermifiltration substrate for wastewater treatment.

Image 3. Pine media and apple orchard tear-out fines.
Image 4. Rapid Assay Vermifiltration System (RAVS) used to test wastewater contaminant removal capability in traditional (pine) media and apple orchard tear-out fines.

Future Plans

Ongoing efforts focus on refining the use of apple orchard debris to create a cost-effective, reliable wood chip that matches or exceeds current substrates in reducing conventional and nonconventional wastewater pollutants, while offering an economic alternative to burning. Additionally, strategies are being developed to integrate vermifiltration into regenerative agriculture and circular bioeconomy practices by repurposing spent substrate as a nutrient-rich soil amendment or for soil remediation. This approach transforms agricultural waste into multiple value-added resources, supporting both environmental sustainability and economic viability through continued innovation, collaboration, and stakeholder engagement.

Authors

Presenting & Corresponding author

Sierra J. Smith, Director of Research and Development, Perca, Inc., sierrasmith@perca.net

Additional authors

Joseph S. Neibergs, Professor Extension Economist and Director Western Center for Risk Management Education, Washington State University

George A. Damoff, Chief Science Officer, Perca, Inc.

David A. Elmenhurst, Chief Financial Officer, Perca, Inc.

Additional Information

perca.net

https://ecology.wa.gov/about-us/accountability-transparency/partnerships-committees/boards-councils/agricultural-burning-research-task-force

Acknowledgements

Washington State Department of Ecology for funding and support

Washington State Agricultural Burning Practices & Research Task Force, under direction of the Department of Ecology, for funding and support

The authors are solely responsible for the content of these proceedings. The technical information does not necessarily reflect the official position of the sponsoring agencies or institutions represented by planning committee members, and inclusion and distribution herein does not constitute an endorsement of views expressed by the same. Printed materials included herein are not refereed publications. Citations should appear as follows. EXAMPLE: Authors. 2025. Title of presentation. Waste to Worth. Boise, ID. April 7–11, 2025. URL of this page. Accessed on: today’s date. 
Reducing Ammonia Emissions from Poultry Litter with Lignite and Lignosulfonate

Due to a technical glitch, we did not get this presentation recorded. Please accept our apologies.

Purpose

The purpose of this study was to determine the effectiveness of lignite, a low-quality coal, and lignosulfonate, a byproduct of paper milling, in reducing ammonia emissions from poultry litter.

What Did We Do?

We utilized a laboratory

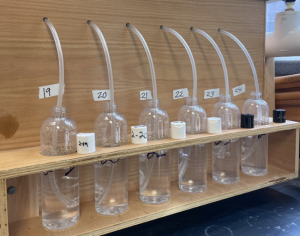
 acid-trap chamber system to assess the effectiveness of varying rates of lignite and lignosulfonate on ammonia reduction when compared to an industry standard, sodium bisulfate (PLT), and an untreated control. In the volatilization experiment, 12 treatments were tested, including five application rates of lignite and lignosulfonate (0.75, 1.5, 3, 4.5, and 6 kg m-2), PLT, and an untreated control. Acid traps of 0.02 M phosphoric acid were changed 11 times over the 14-day experiment. Acid trap solutions were then analyzed for ammonia to quantify cumulative ammonia emissions.  

What Have We Learned?

Both lignite and lignosulfonate were effective in reducing ammonia volatilization in this laboratory setting. While both lignite and lignosulfonate required higher application rates to achieve the same ammonia reduction as PLT, these could be effective alternatives and should be further studied on a larger scale.

Future Plans

While we have no active plans to continue this work, future efforts should include small scale testing in a commercial setting, cost analysis, and sourcing options.

Authors

Presenting & Corresponding author

Stephanie Kulesza, Assistant Professor, North Carolina State University, sbkulesz@nscu.edu

Additional Information

This research is not yet published. Reach out to Stephanie Kulesza at sbkulesz@ncsu.edu if you would like to know more about this work.

The authors are solely responsible for the content of these proceedings. The technical information does not necessarily reflect the official position of the sponsoring agencies or institutions represented by planning committee members, and inclusion and distribution herein does not constitute an endorsement of views expressed by the same. Printed materials included herein are not refereed publications. Citations should appear as follows. EXAMPLE: Authors. 2025. Title of presentation. Waste to Worth. Boise, ID. April 7–11, 2025. URL of this page. Accessed on: today’s date.

Consumer Demand for products using biochar

Purpose

This research aims to analyze consumer sentiment and demand for biochar-enriched products, with a focus on their willingness to pay. By assessing how consumers perceive and value biochar’s environmental and agricultural benefits—such as reduced greenhouse gas emissions, carbon sequestration, improved soil health, enhanced water efficiency, and increased yields—the study explores how these factors influence purchasing decisions.

Understanding these preferences is essential for determining the market viability of biochar-enriched products and identifying potential price premiums. Additionally, the study provides insights into policy recommendations on eco-labeling, sustainability certifications, and incentives for biochar adoption. As the biochar market is still emerging, these findings will help producers and suppliers assess whether investment in biochar-based systems is financially viable based on consumer demand.

What Did We Do?

For our analysis, we employed the contingent valuation method (CVM), a widely used approach in consumer studies. In this method, consumers are asked whether they are willing to pay a premium for products after being informed about their environmental and health benefits compared to conventional options. Our analysis is based on the premise that consumers care about the products they purchase, particularly in terms of the environmental and health benefits they offer.

To capture a broad range of consumer sentiments, the survey was designed to gather data from approximately 1,006 U.S. respondents aged 18 and older who consume meat, selected randomly through Qualtrics. The sample was evenly balanced, with 50.4% female and the remaining respondent’s male. The survey aimed to understand meat consumers’ preferences regarding sustainably produced feed, particularly focusing on corn silage produced using biochar. It collected demographic information and insights into participants’ meat purchasing habits, such as the frequency of purchases and their preferred locations. Participants ranked factors like taste, price, health benefits, environmental impact, and brand when selecting meat products. We also assessed their awareness of sustainable agriculture practices, environmental claims, and the effects of traditional farming.

Since biochar is a relatively new concept, respondents unfamiliar with biochar were shown an educational video explaining its benefits as a soil amendment. Respondents were then asked to choose between sustainable feed and conventional feed, as well as to rank the importance of sustainable feed sources in meat production. Following this, respondents listing benefits of biochar in silage production, including reduced greenhouse gas emissions, reduced water usage, decreased chemical fertilizer use, reduced carbon footprint, and improved soil health. Finally, respondents were asked about their willingness to pay a premium for meat produced with sustainably raised feed (silage produced using biochar) and whether additional product information or certifications, such as USDA , Organic, would influence their purchasing decisions.

What Have We Learned?

From our survey, we learned that demographic factors such as marital status, education level, urban residence, and full-time employment are associated with greater concern for health and a willingness to pay a premium for higher-quality meat. Nearly 94% of participants purchased meat from supermarkets, with 66% doing so weekly, with taste and price being the most important factors in their decision-making. Health benefits were considered, but they were secondary to taste and price. Environmental sustainability and brand identity had a minimal influence on purchasing choices, and most consumers did not actively seek information about food production processes. A significant portion of respondents, particularly those unfamiliar with sustainable farming practices, did not let environmental claims impact their meat purchases.

Additionally, our findings revealed that over 92% of respondents were initially unaware of biochar and its benefits. However, after being exposed to an informational clip, 49% expressed interest in learning more about biochar, and 35% felt informed enough to make a purchasing decision. Participants recognized key benefits of biochar, including reduced chemical fertilizer use, lower water consumption, and improved soil health. By the end of the survey, more than 69% of respondents indicated a willingness to pay a premium for sustainably raised meat.

Moreover, familiarity with sustainable agriculture and consideration of environmental claims played a significant role in purchasing decisions, emphasizing the impact of awareness on consumer behavior. Certification and detailed product information, both of which were statistically significant at the 1% level, further enhanced consumer trust and perceived value, increasing the likelihood of premium pricing acceptance.

Future Plans

The analyses conducted thus far are based on survey results, utilizing descriptive statistics and an ordered logit regression model. Moving forward, we plan to apply these findings to estimate market demand for biochar-based products and compare the profitability of biochar-based production with conventional practices. This expanded analysis will offer deeper insights into consumer preferences, the potential price premium for biochar products, and the economic viability of integrating biochar into agricultural production systems.

Authors

Presenting & Corresponding author

Sunita Bandane Pahari, Graduate Research Assistant, University of Idaho, paha0494@vandals.uidaho.edu

Additional author

Jason Winfree, Professor, University of Idaho

Additional Information

Idaho Sustainable Agriculture Initiative for Dairy (ISAID)

This informational clip derived from You Tube is used for survey to provide information on what is biochar and its benefits to participants: https://youtu.be/7qVcEvKEfGc?si=Isxex7E4lJCQrfGc

Acknowledgements

This research was funded by the USDA Sustainable Agricultural Systems Initiative through the Idaho Sustainable Agriculture Initiative for Dairy (ISAID) grant (Award No. 2020-69012-31871).

The authors are solely responsible for the content of these proceedings. The technical information does not necessarily reflect the official position of the sponsoring agencies or institutions represented by planning committee members, and inclusion and distribution herein does not constitute an endorsement of views expressed by the same. Printed materials included herein are not refereed publications. Citations should appear as follows. EXAMPLE: Authors. 2025. Title of presentation. Waste to Worth. Boise, ID. April 7-11, 2025. URL of this page. Accessed on: today’s date.

Impacts of Swine Manure Application on Soil Properties in Continuous Corn Plot

Purpose

Land application of swine manure (SM) offers a practical approach to supplying nutrients to crop fields while enhancing soil organic carbon and micronutrient contents. This study is a part of a multi-state project evaluating the effects of SM land application on soil properties and corn yield in comparison to inorganic fertilizer (IF).

What Did We Do?

The experiment is conducted on a five-acre plot using randomized complete block design, consisting of three treatments [IF, SM, and SM+ Starter Fertilizer (SF)], over five years. The study aims to measure various soil properties (organic carbon, nitrogen content, bulk density, porosity, water holding capacity, soil respiration, pH, electrical conductivity, and soil macro- and micronutrient contents). Soil samples are collected from each plot at various depths (0-3, 3-6, 6-12,12-18, 18-24, 24-36 inches) to evaluate treatment effects over time.

What Have We Learned?

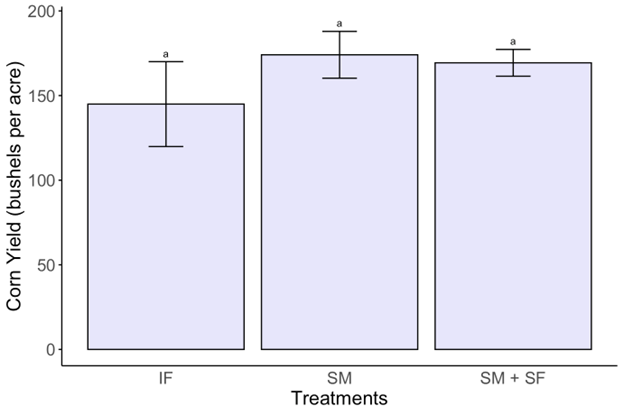
Although the study is still in its early stages, preliminary data show promising results for corn yield in the first year, with 144.96, 174.09, and 168.39 bushels per acre for the IF, SM and SM+SF treatments, respectively. While the differences were statistically non-significant (p = 0.32), the SM treatment achieved the highest yield. Soil compaction (measured using SHT-003 Soil Load Penetrometer) of the field was non-significant (p = 0.56) for the treatments. However, the highest soil compaction was observed with the inorganic fertilizer (11.86 Newton) treatment, followed by SM (11.07 Newton), and the lowest soil compaction with the SM + SF (10.99 Newton) treatment. These findings suggest that swine manure may have a positive impact on the corn yield and soil compaction.

Figure 1: Effects of SM, IF & SM+IF applications on corn yield(SM- Swine Manure, IF- Inorganic fertilizer, SM+SF: Swine manure + Starter Fertilizer)

(Data are presented as mean with standard error, bars with different letters denote significantly different at p<0.05)
Figure 1: Effects of SM, IF & SM+IF applications on corn yield
(SM- Swine Manure, IF- Inorganic fertilizer, SM+SF: Swine manure + Starter Fertilizer)
(Data are presented as mean with standard error, bars with different letters denote significantly different at p<0.05)

Furthermore, we observed significant differences (p < 0.05) in Soil Plant Analysis Development (SPAD, chlorophyll and nitrogen contents in leaves measured using Minolta Chlorophyll Meter) values among the treatments, with IF showing the highest value (52.37), followed by SM (48.15) and then the SM+SF (45.56).

Figure 2: Effects of SM, IF & SM+IF application on SPAD values(SM- Swine Manure, IF- Inorganic fertilizer, SM+SF: Swine manure + Starter Fertilizer, SPAD- Soil Plant Analysis Development)

(Data are presented as mean with standard error, bars with different letters denote significantly different at p<0.05)
Figure 2: Effects of SM, IF & SM+IF application on SPAD values
(SM- Swine Manure, IF- Inorganic fertilizer, SM+SF: Swine manure + Starter Fertilizer, SPAD- Soil Plant Analysis Development)
(Data are presented as mean with standard error, bars with different letters denote significantly different at p<0.05)

The electrical conductivity (measured using Hanna GroLine Soil EC Tester) of the soil was significantly influenced (p < 0.05) by the treatments. The highest electrical conductivity was observed with the application of SM (0.36) which is statistically similar to SM+SF (0.32) treatment, but significantly higher than the IF (0.22) treatment.

Fig. 3 Effects of SM, IF & SM+IF application on electrical conductivity (EC)(SM- Swine Manure, IF- Inorganic fertilizer, SM+SF: Swine manure + Starter Fertilizer, EC- Electrical Conductivity)

(Data are presented as mean with standard error, bars with different letters denote significantly different at p<0.05)
Fig. 3 Effects of SM, IF & SM+IF application on electrical conductivity (EC)
(SM- Swine Manure, IF- Inorganic fertilizer, SM+SF: Swine manure + Starter Fertilizer, EC- Electrical Conductivity)
(Data are presented as mean with standard error, bars with different letters denote significantly different at p<0.05)

Future Plans

We plan to take the growth parameters including plant height and chlorophyll content (SPAD) at regular intervals. Additionally, we intend to sample soil microbiome composition in the field. This year we harvested 6 rows per plot but starting next year, we will harvest 18 center rows per plot (out of 31) for yield measurement. We will also exclude 15 feet from both the northern and southern ends of each plot.

Authors

Presenting author

Ravi Raj Mishra, Graduate student, University of Missouri, Columbia

Corresponding author

Teng-Teeh Lim, Extension Professor, University of Missouri, Columbia, limt@missouri.edu

Additional author(s) (name, title, and affiliation for each)

Manobendro Sarker, Graduate student, University of Missouri, Columbia

Keywords

Swine Manure, Soil Health, Soil Properties, Starter Fertilizers

Acknowledgements

We acknowledge the National Pork Board for the funding and collaboration with South Dakota State University. Our sincere thanks also go to Manobendro Sarker, Moh Moh Thant Zin, and Rana Das from our research group, and the research farm team for their support in field operations.

The authors are solely responsible for the content of these proceedings. The technical information does not necessarily reflect the official position of the sponsoring agencies or institutions represented by planning committee members, and inclusion and distribution herein does not constitute an endorsement of views expressed by the same. Printed materials included herein are not refereed publications. Citations should appear as follows. EXAMPLE: Authors. 2025. Title of presentation. Waste to Worth. Boise, ID. April 7–11, 2025. URL of this page. Accessed on: today’s date.

Effects of manure land application on soil properties based on multiyear state-wide data in Missouri

Purpose

Soil health is crucial for sustainable crop production, which can differ from conventional soil nutrient considerations. Analyzing a multiyear, state-wide dataset can greatly improve the understanding of soil health status. In collaboration with the Missouri N340 cover crop cost-share program, this research compiled multiyear soil sample results from fields throughout Missouri and assessed the effects of manure application strategies on soil properties.

What Did We Do?

A total of 14,473 soil samples were collected from 2015 to 2022 across Missouri. The physicochemical properties of soil samples were analyzed by the University Soil Health Assessment Center (SHAC). To evaluate the impacts of manure application, results were first compared with fields that received inorganic fertilizer, followed by the interaction with soil texture. The effects of manure type and their application method were further studied in this research.

What Have We Learned?

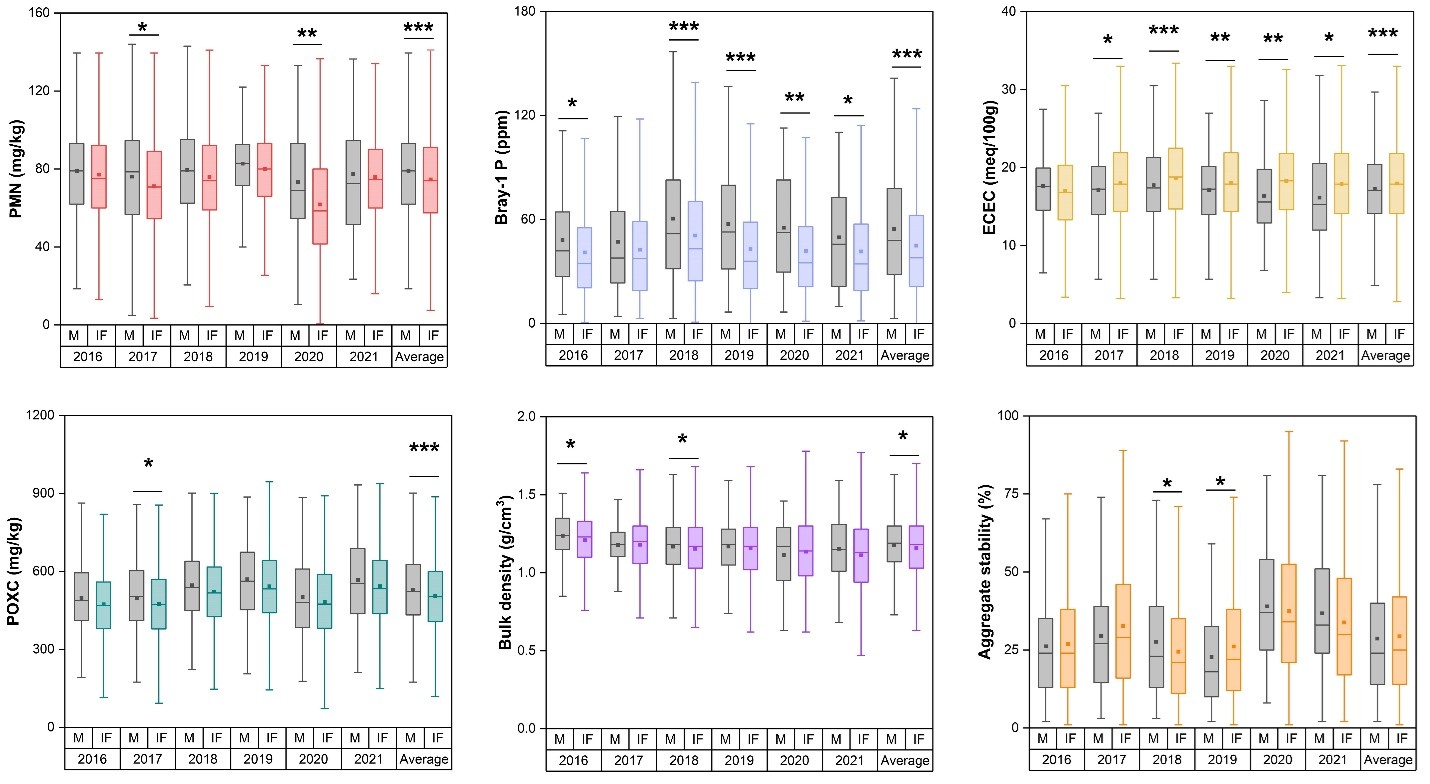
In most years, manure application increased potentially mineralizable nitrogen (PMN), Bray-1 phosphorus (P), permanganate-oxidizable carbon (POXC), and organic carbon, showing more significant differences in some years compared to inorganic fertilizer. There was no improvement in effective cation exchange capacity (ECEC), but aggregate stability was highly variable for manure application (Figure 1).

Figure 1: Effects of manure land application on soil properties for soil samples of 2015-2022 (M- Manure, IF- Inorganic fertilizer; significant codes: *** : < 0.001, ** : < 0.01, * : <0.05)

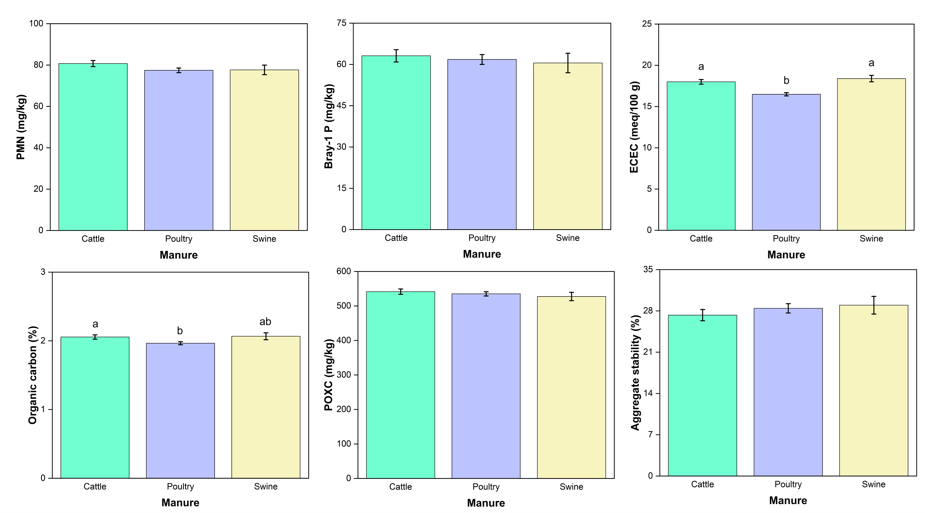
The interaction between manure and soil texture significantly (p<0.01) affected PMN, ECEC, organic carbon, and POXC, but no significant difference in aggregate stability was observed. There was also a significant effect of manure type on ECEC and organic carbon, as shown in Figure 2. The organic carbon of fields that received cattle and swine manure was significantly higher (p<0.05) than poultry manure-receiving fields, but there was no significant difference between cattle and swine manure.

Figure 2: Effects of manure types on soil physicochemical properties (Data are presented as mean with standard error, bars with different letters denote significantly different at p<0.05)

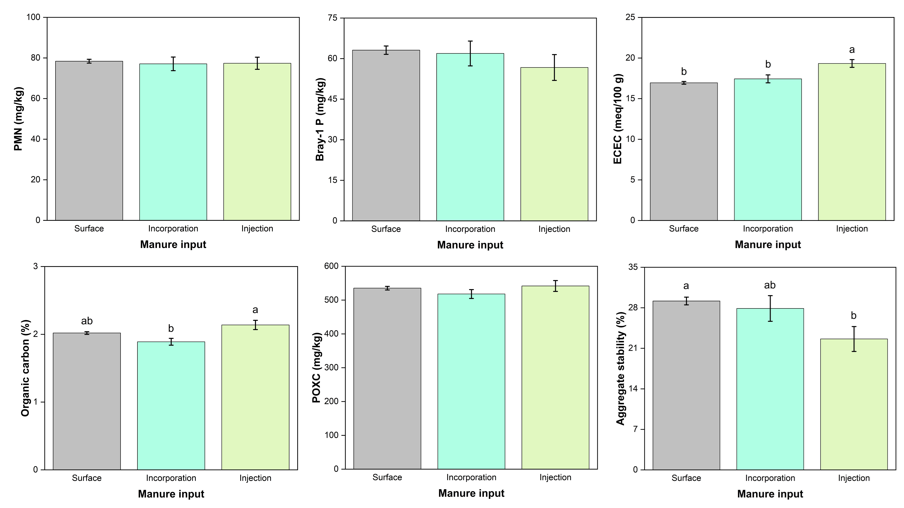
In Missouri, surface application is the most commonly used application method, followed by incorporation and injection. Figure 3 illustrates the effects of different manure application methods on soil properties. There was no significant difference in PMN and Bray-1 P across the application methods. However, the application method significantly affected ECEC and organic carbon, which were higher for manure injection. Surprisingly, the aggregate stability was the lowest for fields with manure injection.

Figure 3: Effects of manure application methods on soil properties (Data are presented as mean with standard error, bars with different letters denote significantly different at p<0.05)

Future Plans

Data from management practices reveals notable variations in manure types and application rates across the state. Additionally, many farms have adopted cover crop practices and mixed tillage methods, including no-till, reduced tillage, and conventional tillage. Given the diversity of agricultural practices in Missouri, data collection and analysis are ongoing, with a field experiment at a university farm currently underway to provide further insights and validation.

Authors

Presenting author

Manobendro Sarker, Graduate student, University of Missouri, Columbia

Corresponding author

Teng-Teeh Lim, Extension Professor, University of Missouri, Columbia, limt@missouri.edu

Additional authors

Morgan Davis, Assistant Professor, University of Missouri, Columbia

Donna Brandt, Lead Research Specialist, Soil Health Assessment Center, University of Missouri, Columbia

Timothy Reinbott, Director, Field Operations, Agricultural Experiment Station

University of Missouri, Columbia

Additional Information

Please email us at limt@missouri.edu (Teng-Teeh Lim) or ms59d@umsystem.edu (Manobendro Sarker).

Acknowledgements

We gratefully acknowledge the Missouri Department of Natural Resources, Soil and Water Conservation Program for funding the project. We also thank Moh Moh Thant Zin, Rana Das, and Ravi Mishra from our research group for their assistance with field operations.

The authors are solely responsible for the content of these proceedings. The technical information does not necessarily reflect the official position of the sponsoring agencies or institutions represented by planning committee members, and inclusion and distribution herein does not constitute an endorsement of views expressed by the same. Printed materials included herein are not refereed publications. Citations should appear as follows. EXAMPLE: Authors. 2025. Title of presentation. Waste to Worth. Boise, ID. April 7–11, 2025. URL of this page. Accessed on: today’s date.
Advanced Multi-Stage Wastewater Treatment for Sustainable Dairy Farm Management

Purpose

Dairy farms employing flushing systems often encounter significant challenges in managing substantial volumes of recycled water, which can have environmental, economic, and operational implications. This study aims to evaluate a multi-stage process designed to improve solid/nutrient extraction from flushed water already treated by a pull-plug sediment basin system.

What Did We Do?

We implemented a three-stage sequential treatment process comprising coagulation, Fenton oxidation, and membrane filtration. In the first stage, coagulation was performed using aluminum sulfate (Al₂(SO₄)₃) to remove colloidal solids from the treated barn flushing water. The optimal alum dosage (500–7,000 mg/L) was determined based on turbidity, total solids, and chemical oxygen demand (COD) removal.

The second stage involved Fenton oxidation, where hydroxyl radicals generated from hydrogen peroxide (H₂O₂) and an iron catalyst (Fe²⁺) further degraded organic pollutants. Utilizing response surface methodology (RSM), we optimized the concentrations of H₂O₂ (500–1,800 mg/L), FeCl₃ (250–950 mg/L), and reaction time (15–50 min) to achieve a balance between treatment effectiveness and cost efficiency.

In the final stage, ultrafiltration and reverse osmosis were employed to remove dissolved ions, ensuring compliance with discharge standards.

What Have We Learned?

Fig. 1. Removals of turbidity (a), total solid (b), COD (c), and impacts on pH (d) at various alum treatment concentrations.

The results indicated that turbidity removal peaked at a dosage of 5,000 mg/L of Al₂(SO₄)₃, while total solids and COD removal stabilized at 4,000 and 5,000 mg/L, respectively. Although turbidity initially increased following the coagulant addition, the formation of aluminum hydroxide flocs facilitated effective pollutant removal. To balance reagent costs and treatment efficiency, a dosage of 4,000 mg/L alum was selected. After coagulation, the coagulated supernatant underwent fenton oxidation.


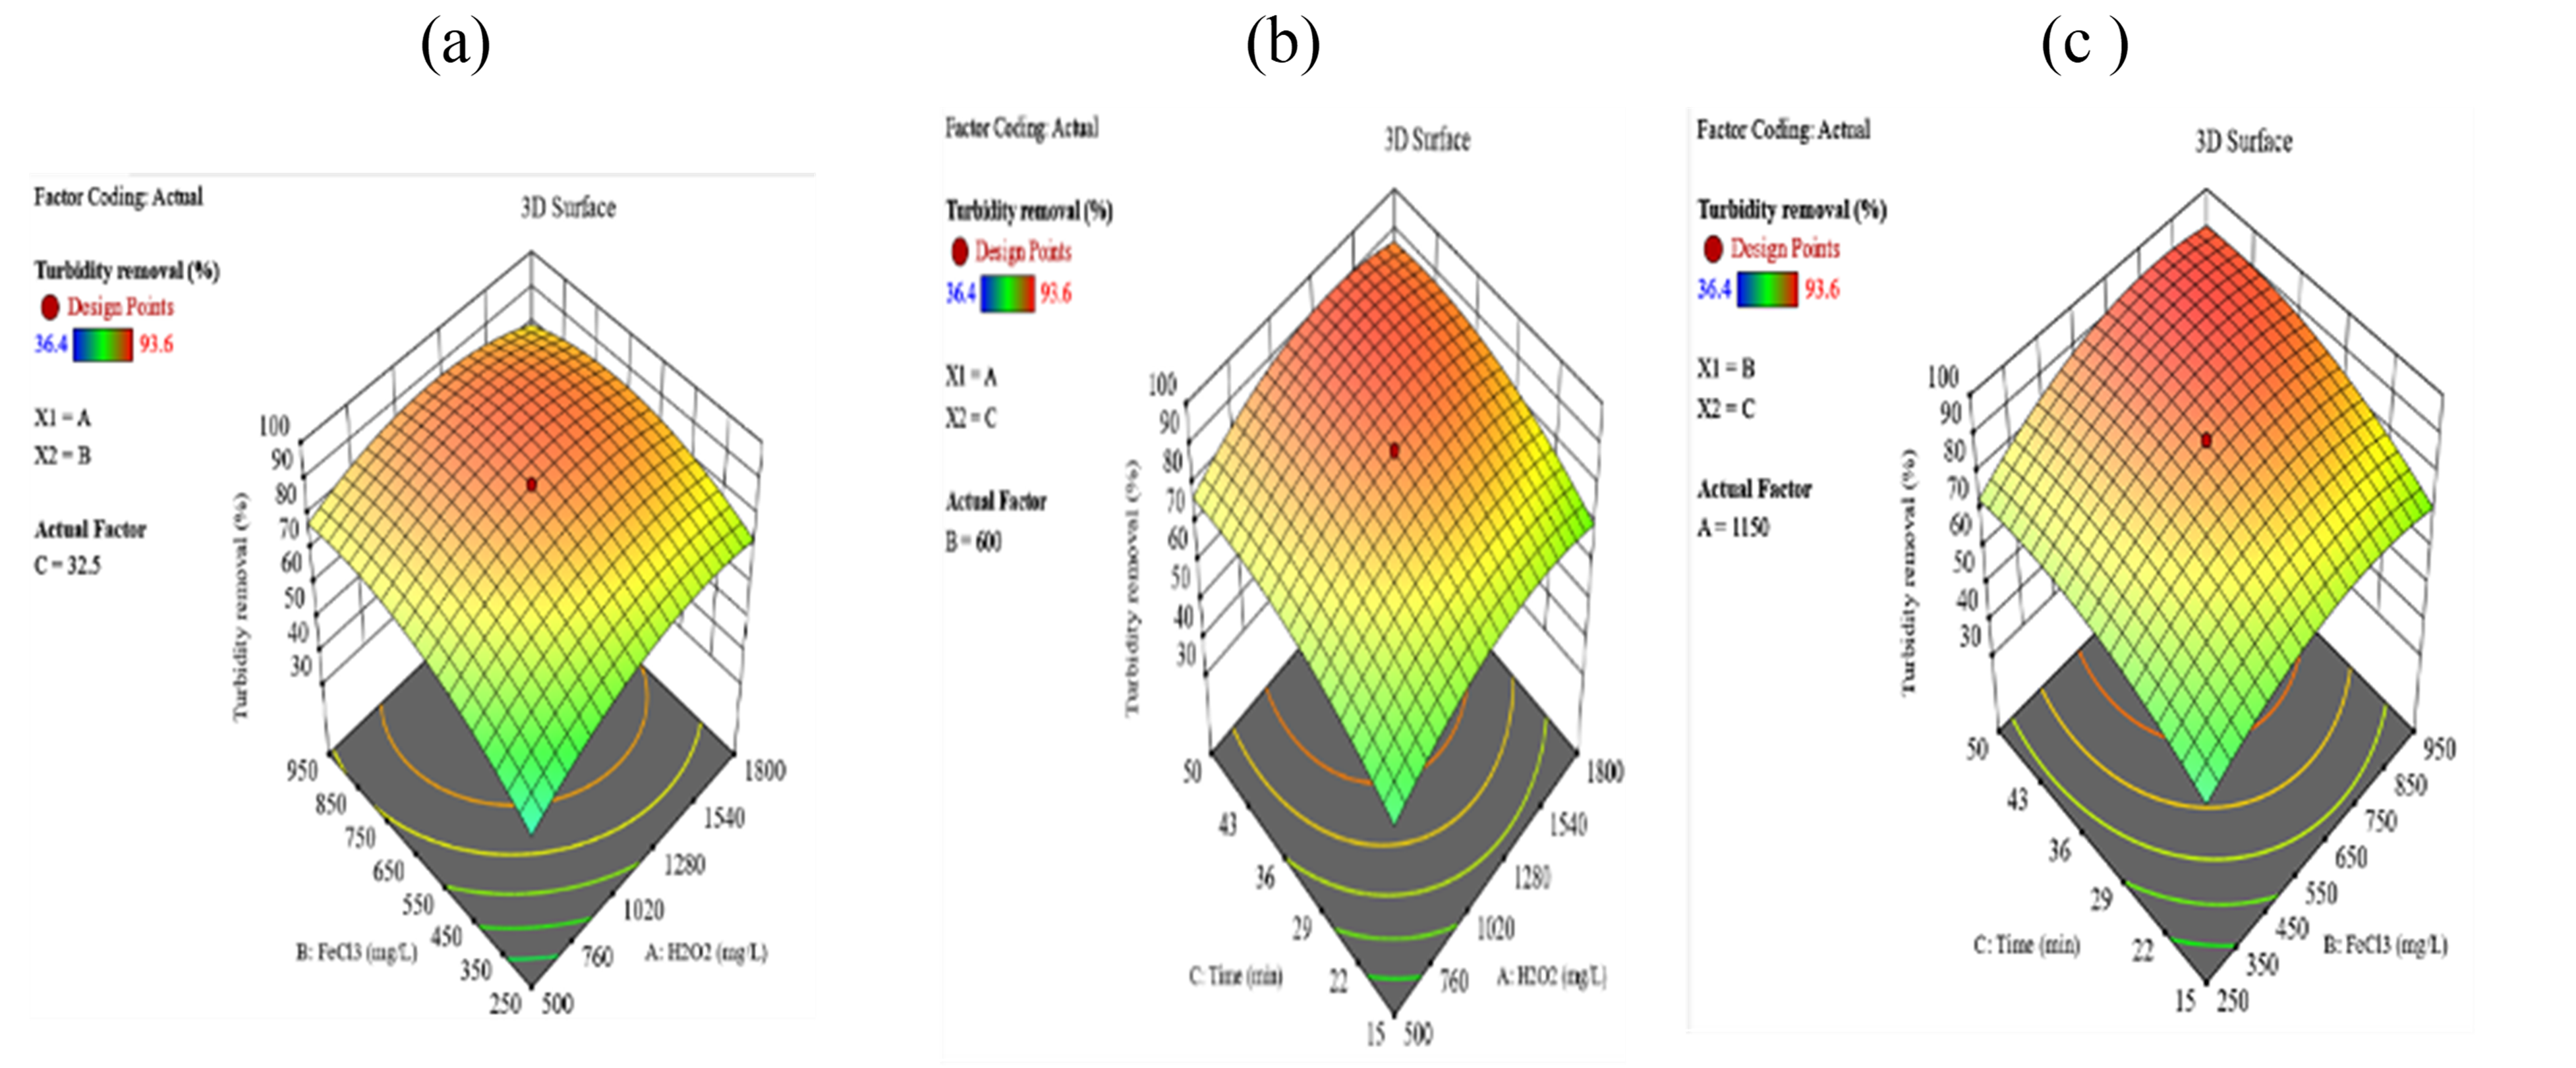
Turbidity removal (%)

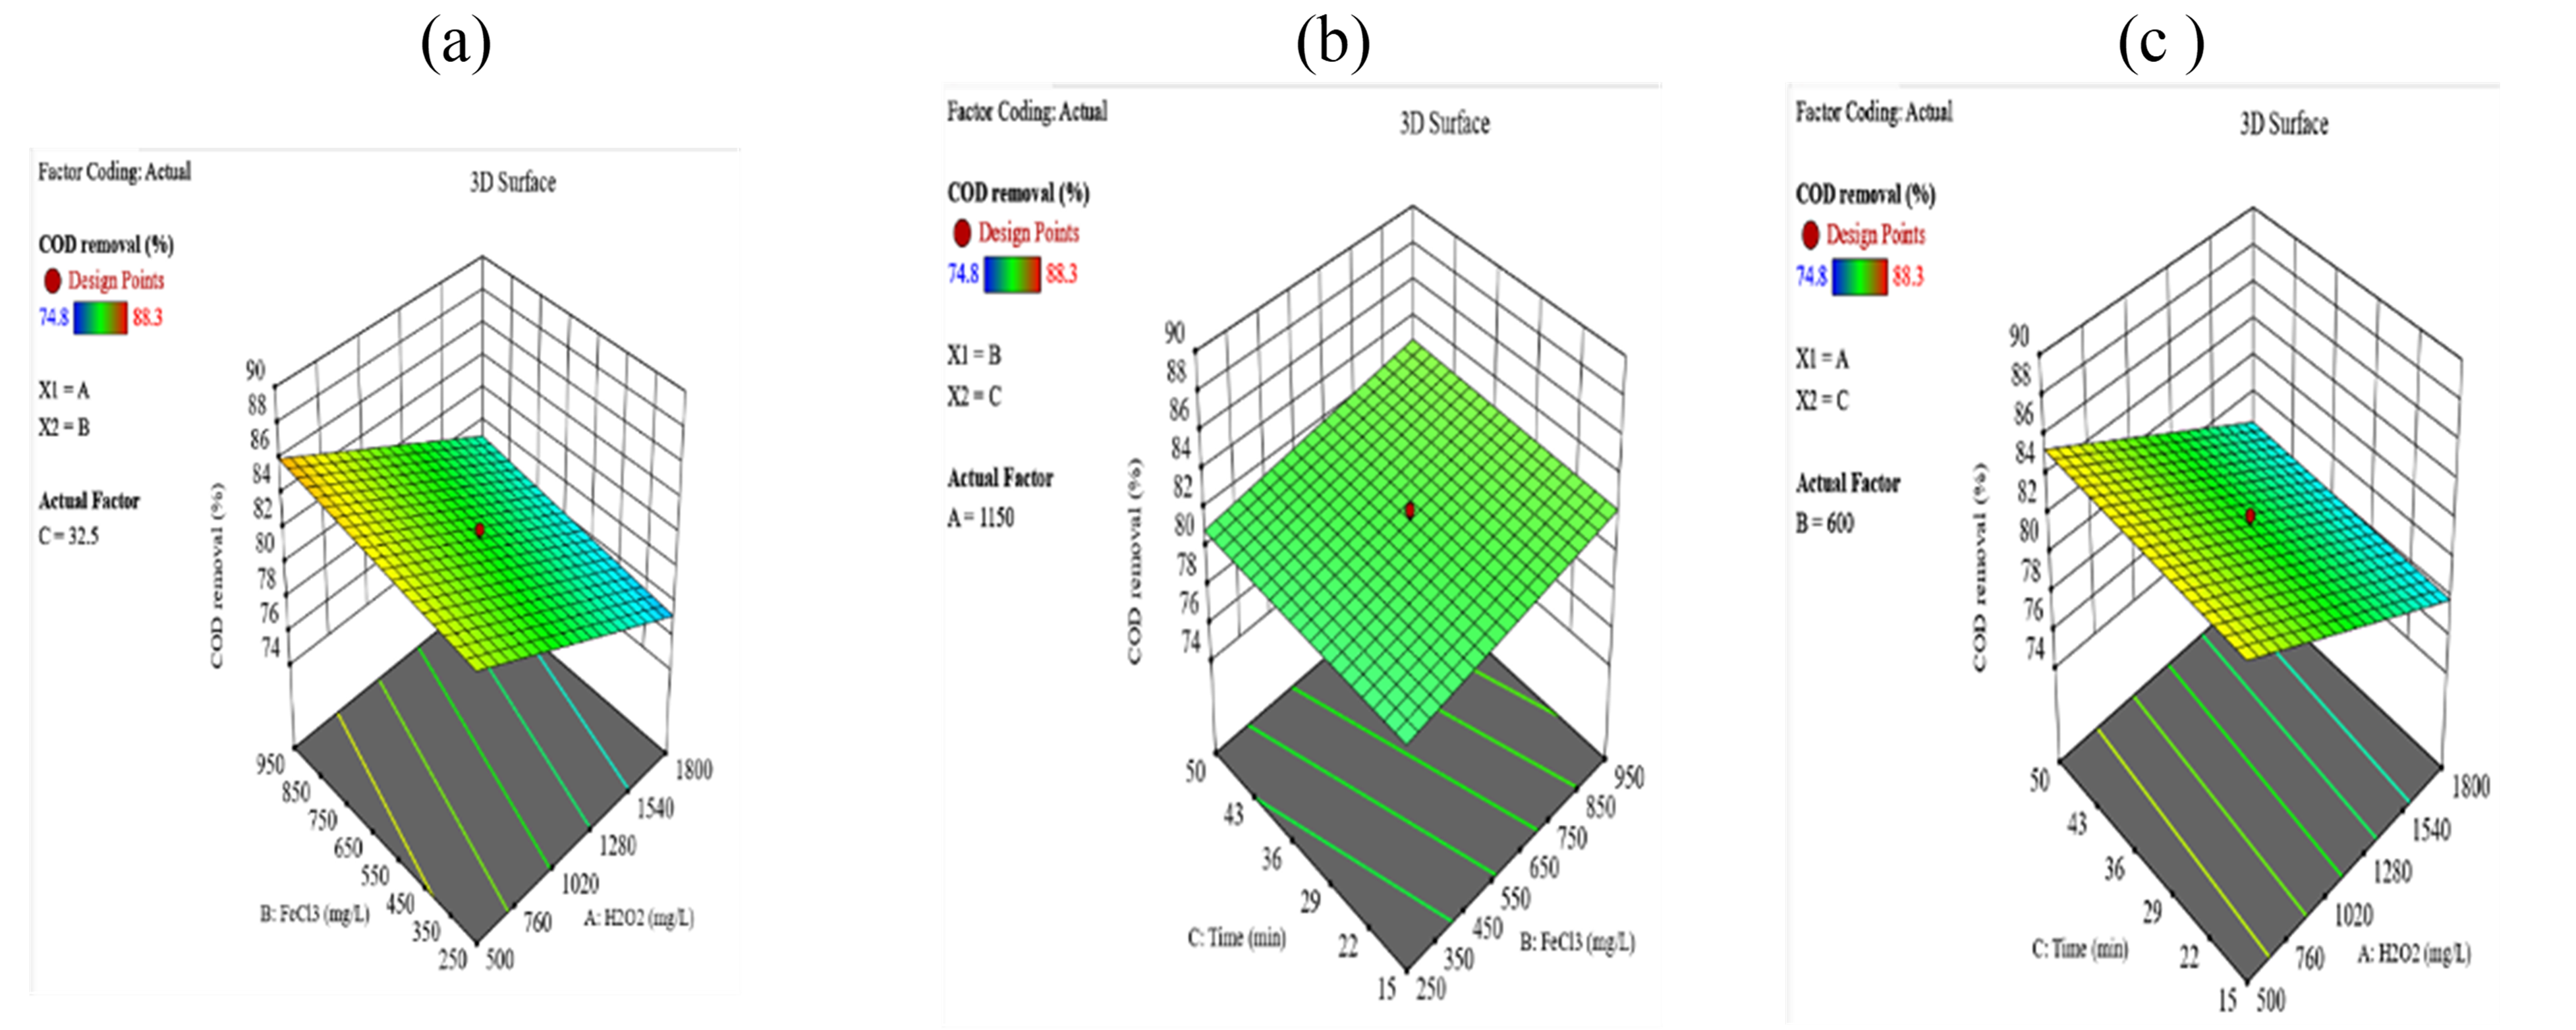
Fig. 2. The removal of turbidity (%) at the interactions between H2O2 and FeCl3 (a), between H2O2 and time (b), and between FeCl3 and time (c).

Response surface analysis confirmed that optimal turbidity removal was achieved with H₂O₂ concentrations of 1,280-1,800 mg/L and FeCl₃ concentrations of 550-950 mg/L. Furthermore, a minimum mixing of 36 minutes was necessary to attain maximum efficiency.

Total solid removal (%)

Fig. 3. The removal of total solid (%) at the interactions between H2O2 and FeCl3 (a), between H2O2 and time (b), and between FeCl3 and time (c).

For total solids removal, effective interaction was observed at H₂O₂ levels of 500–1,240 mg/L and FeCl₃ concentrations of 250–450 mg/L. Mixing times exceeding 43 minutes were found to reduce removal efficiency.

COD removal (%)

Fig. 4. The removal of COD (%) at the interactions between H2O2 and FeCl3 (a), between H2O2 and time (b), and between FeCl3 and time (c).

COD removal was most effective within the H₂O₂ range of 500–760 mg/L and FeCl₃ concentrations of 450–950 mg/L, while mixing time had minimal impact.

Cost ($)

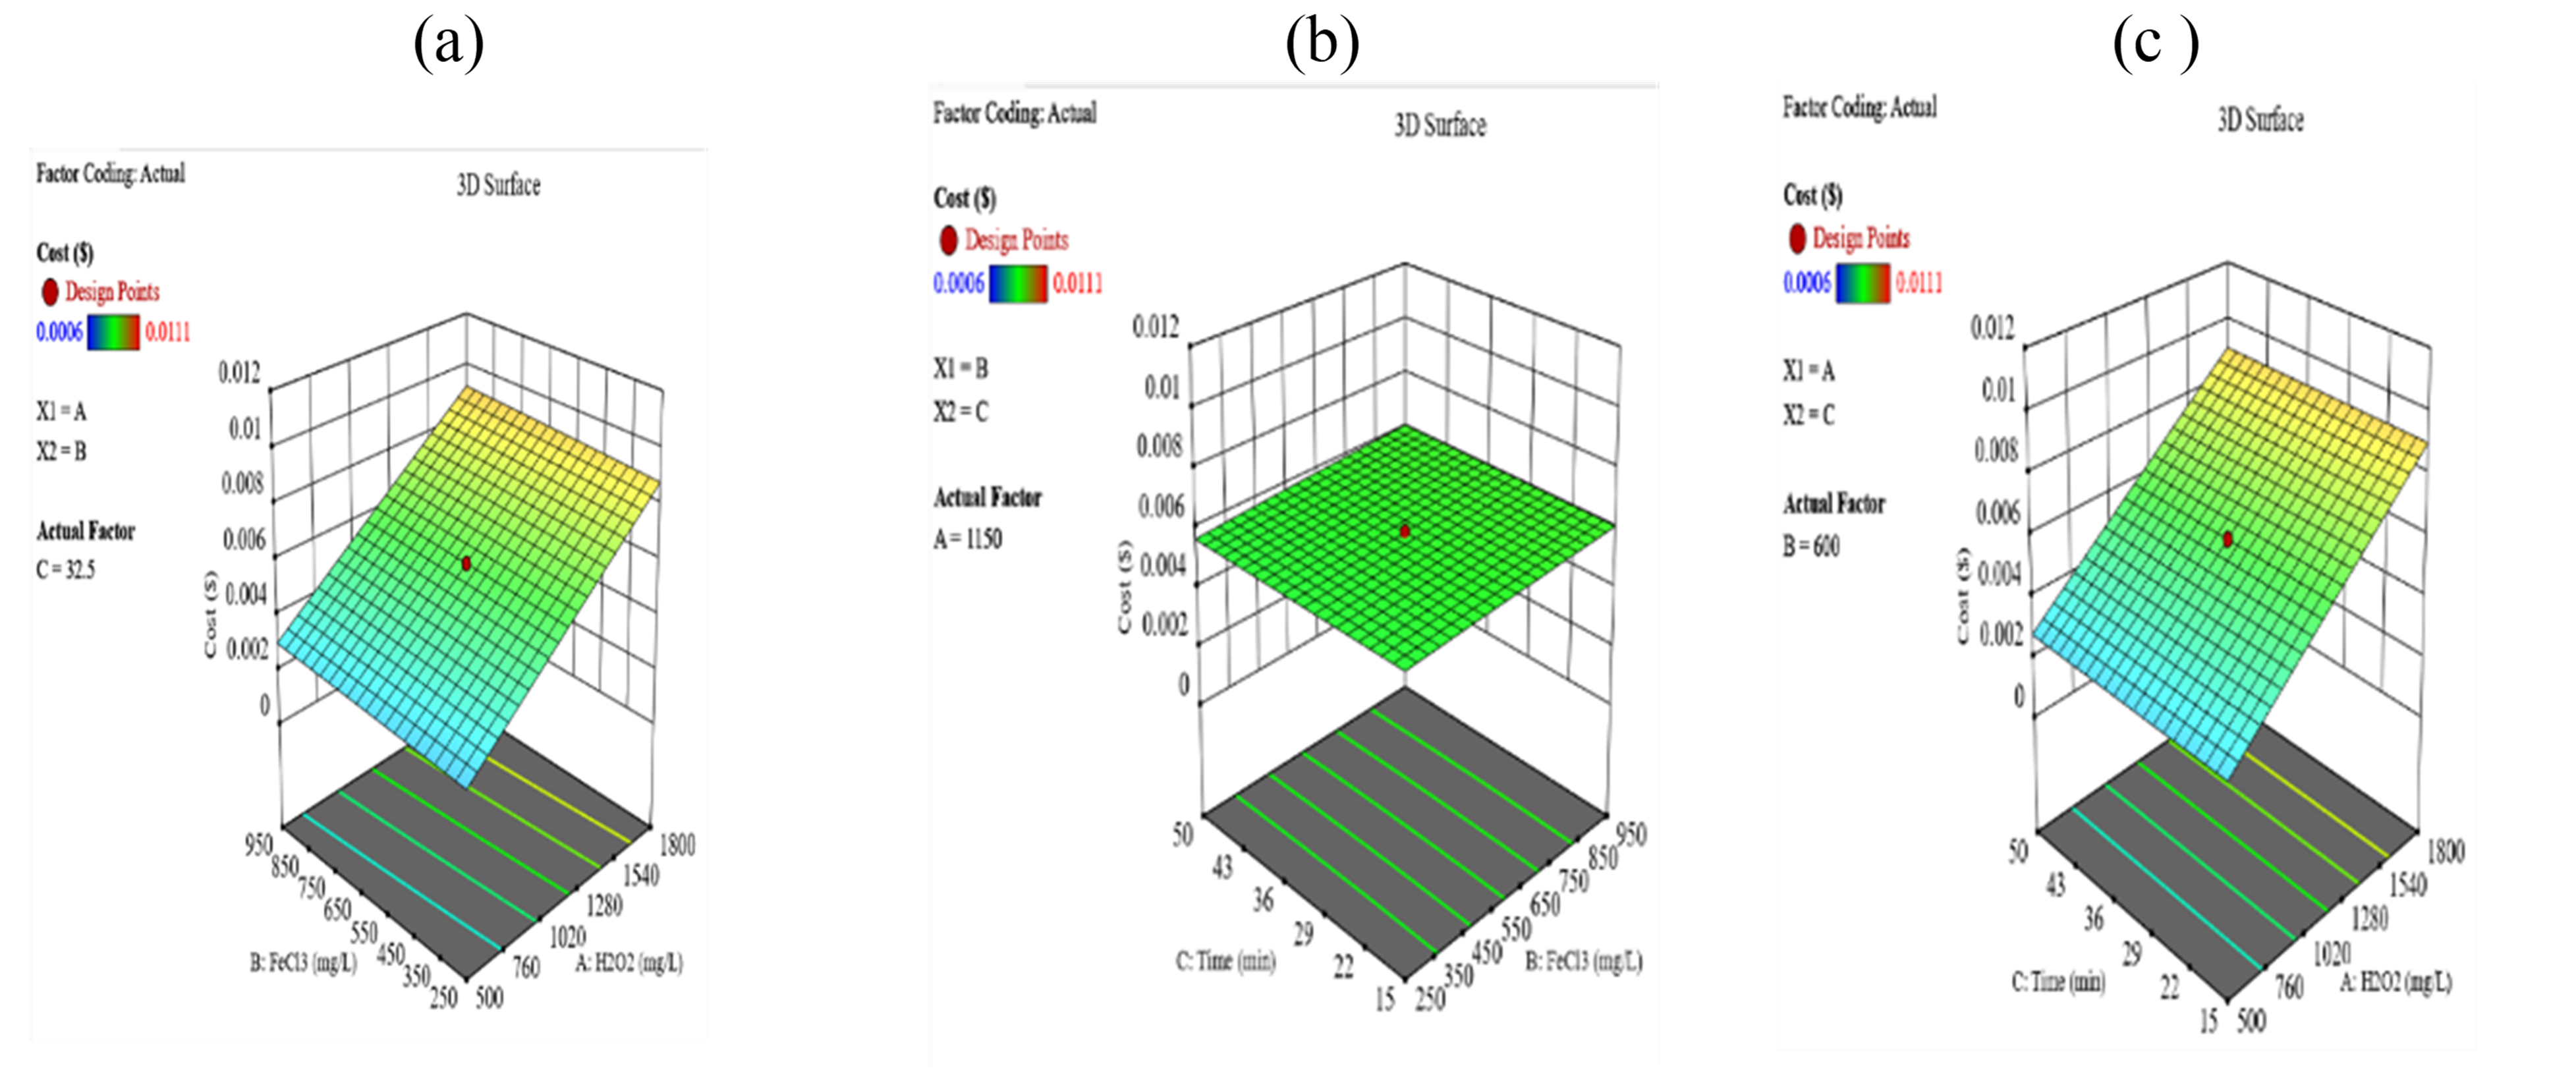
Fig. 5. The treatment cost ($) at the interactions between H2O2 and FeCl3 (a), between H2O2 and time (b), and between FeCl3 and time (c).

Regarding treatment cost, H₂O₂ was identified as the most influential cost factor due to its higher price. To balance removal efficiency and cost, the optimized conditions were determined as 563.3 mg/L H₂O₂, 568.4 mg/L FeCl₃, and a 33-minute reaction time, according to the calculations of RSM model. This setup achieved 86.4% turbidity removal, 18.7% total solids removal, and 81.5% COD removal at a treatment cost of $0.03 per liter of wastewater.

Future Plans

The next phase of the study will focus on membrane filtration experiments to further remove dissolved ions and ensure compliance with discharge standards. Additionally, a systematic economic analysis will assess cost-effectiveness, scalability, and operational feasibility for large-scale dairy farm applications.

Authors

Presenting author

Moh Moh Thant Zin, Post-doctoral researcher, University of Missouri-Columbia

Corresponding author

Teng-Teeh Lim, Extension Professor, University of Missouri-Columbia, limt@missouri.edu

Acknowledgements

Funding is provided by USDA-NIFA, grant award (2018-68011-28691) and University of Missouri Extension.

The authors are solely responsible for the content of these proceedings. The technical information does not necessarily reflect the official position of the sponsoring agencies or institutions represented by planning committee members, and inclusion and distribution herein does not constitute an endorsement of views expressed by the same. Printed materials included herein are not refereed publications. Citations should appear as follows. EXAMPLE: Authors. 2025. Title of presentation. Waste to Worth. Boise, ID. April 7-11, 2025. URL of this page. Accessed on: today’s date.
Application of Sonar Depth Finder in Lagoon Sludge Survey

Purpose

Regular monitoring of lagoon depths is crucial for effective manure management and environmental compliance. Traditional methods, using a disc on a rope or a marked stick from a boat can be time-consuming and pose safety risks, especially in larger or deeper lagoons. This study aimed to determine the feasibility of using low-cost sonar depth finders for lagoon sludge measurement.

What Did We Do?

Depth measurements were conducted by using sonar devices and compared with traditional methods at a 2.5-acre dairy lagoon that received effluent from a pull-plug sediment basin. The sonar devices, along with a cell phone (data logger) were mounted on an air-filled float and dragged across lagoon surface, enabling measurements without the need for a boat.

Fig. 1.  Lagoon depth measurement was conducted using a small kayak (left); practical and simple lagoon depth measurement by dragging air-filled float with sonar ball and cellphone (as data logger) across lagoon surface (right).
Fig. 1. Lagoon depth measurement was conducted using a small kayak (left); practical and simple lagoon depth measurement by dragging air-filled float with sonar ball and cellphone (as data logger) across lagoon surface (right).
Fig. 2. Field measurement points on the lagoon surface for the liquid depth measurement using disc on a rope and a sonar ball sensor. The white dots are measurement points to compare sonar ball method and disc on a rope method, the blue lines were measurement paths dragging a small air-filled float carrying sonar ball

What Have We Learned?

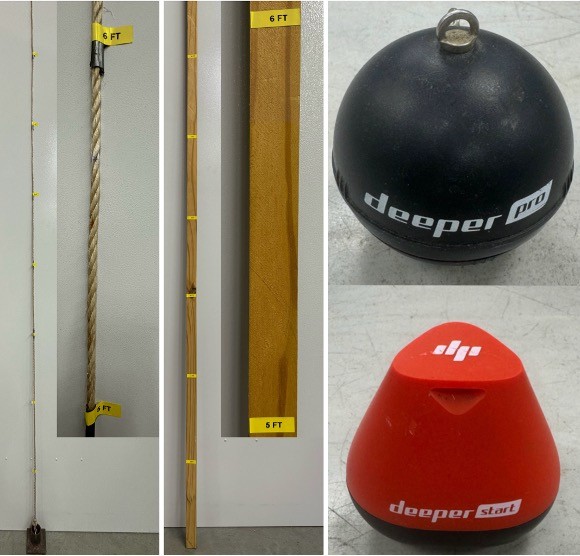
Fig. 3. Liquid depth measurement devices applied: disk on a rope (left), wood stick with depth markings (middle), and two types of commercial sonar balls (right).
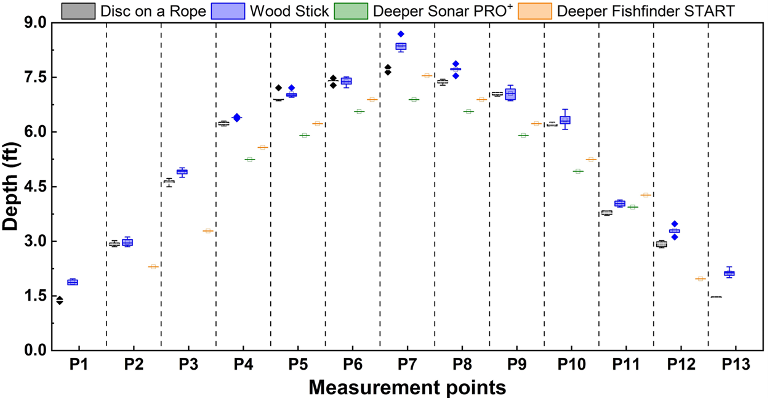
Fig. 4.  Comparison of depth measurements using different measurement methods.
Fig. 4. Comparison of depth measurements using different measurement methods.

The disc on a rope (standard) and wood stick method resulted in similar values. Meanwhile, the sonar balls tend to slightly underestimate depth, with a margin of error below 15%, while the errors were higher for very shallow areas.

Fig. 5.  Linear regression of depths, comparing the Deeper Sonar PRO+ and Deeper Fishfinder START, with disc on a rope values.
Fig. 5. Linear regression of depths, comparing the Deeper Sonar PRO+ and Deeper Fishfinder START, with disc on a rope values.

Linear regression models revealed strong correlations between sonar readings and the disc-on-a-rope method, with R² values of 0.899 for the PRO+ model, and 0.9377 for the START model. Applying a correction model to the sonar data could further enhance the measurement accuracy. This study demonstrated that integrating sonar measurements with periodic sludge sampling provides a practical, safe, and reliable approach to improving lagoon management.

Authors

Presenting author

Moh Moh Thant Zin, Post-doctoral researcher, University of Missouri-Columbia

Corresponding author

Teng-Teeh Lim, Extension Professor, University of Missouri-Columbia, limt@missouri.edu

Additional author(s)

Zonggang Li, Gilbert Mitto, Manobendro Sarker, Rana Das, Cuong Duong, University of Missouri-Columbia.

Acknowledgements

This research was supported by USDA-NIFA, grant award (# 2018-68011-28691), and University of Missouri Extension.

The authors are solely responsible for the content of these proceedings. The technical information does not necessarily reflect the official position of the sponsoring agencies or institutions represented by planning committee members, and inclusion and distribution herein does not constitute an endorsement of views expressed by the same. Printed materials included herein are not refereed publications. Citations should appear as follows. EXAMPLE: Authors. 2025. Title of presentation. Waste to Worth. Boise, ID. April 7–11, 2025. URL of this page. Accessed on: today’s date.