
Impact of Anaerobic Digestion on Solids, Nitrogen, Phosphorous, Potassium, and Sulfur Concentrations of Swine Manure

Anaerobic digestion of swine manure is a treatment process that can be used to reduce odor emissions, generate bioenergy, and reduce methane emissions. Studies and models are available that can be used to quantify methane production, and volatile solids (VS) reduction rates. Few provide information on the plant nutrient contents of digested manure. Such information is needed to develop nutrient management plans to use digester effluent to produce crops, biomass, or as a nitrogen source for making compost in an environmentally responsible manner.  The objective of this study was to observe the reductions and transformations of solids (TS, VS), nitrogen, phosphorous, potassium, and sulfur resulting from anaerobic digestion.

What did we do?

Fresh swine manure was obtained from the gestation barn at the Starkey Swine Center at Clemson University (Figure 1), and large supernatant samples were obtained from the lagoon on-site. The solid manure from the gestation floor was diluted with supernatant from the lagoon to obtain three total solids (TS) concentrations. The target total solids concentrations were 1%, 1.2%, and 2%. Dilutions in this range were selected because they were representative of common ranges of liquid swine manure removed from modern production facilities. This also provided three levels of organic load (OL) that was defined by the VS concentration of the mixtures (g VS/L). The dilutions that were actually achieved were 0.9%, 1.2%, and 1.9% total solids with volatile solids (VS) concentrations of 6.10, 9.05, and 13.75 g VS/L.

Since lagoon water was used for dilution in a manner similar to the operation of a recycled flush system no additional seed material was needed. The microorganisms needed for anaerobic digestion already existed in the manure.
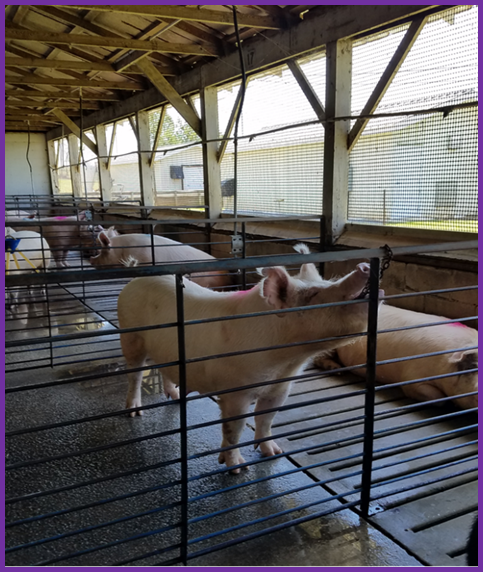
Figure 1. Naturally ventilated gestation barn at the Starkey Swine Center at Clemson University.

Batch Anaerobic Digestion

The three mixtures of swine manure and lagoon water were anaerobically digested using 1.8L batch reactors that were maintained at 35 C in a heated water tank as shown in Figure 2. Three 1.8L bottles were used for each of the three liquid swine manure mixtures to give a total of 9 reactor bottles. Complete details of the batch method used is provided by Chastain and Smith (2015).

Figure 2. Aquarium used to provide a heated water bath (35°C) that held the nine, 1.8-L batch reactors.

The reactor bottles were digested for 56 to 74 days. The pH of the bottles was measured daily and was used as the primary parameter to monitor digestion progress. Biogas production was also monitored by collecting it in 3-L Tedlar® bags, one per reactor bottle. The day on which the gas collection bags were emptied was recorded and provided a secondary parameter to determine when digestion was complete. Anaerobic digestion is a two phase process. During the first phase, called the acid forming phase, microorganisms create volatile fatty acids (VFA) and the pH falls rapidly to 6 or less. During the second phase the methanogens increase in population and consume the VFAs causing the pH to rise. Digestion was complete once the pH hovered around 7.5 for several days, and biogas was no longer produced. A graph of the variation in pH for the reactors is provided in Figure 3.

Figure 3. Variation of pH with respect to process time for three organic loading rates used. Each point is the mean of three 1.8-L batch reactor bottles.

Solids and Plant Nutrients Measured Before and After Anaerobic Digestion

Well-mixed samples of the three liquid swine manure mixtures were obtained before and after anaerobic digestion. Since nitrogen and phosphorous in swine manure exist in soluble and organic forms the reductions and transformations of soluble and organic forms of these nutrients were also observed. The samples were analyzed to determine the following using standard techniques:

  • The total solids (TS),
  • The fixed solids (FS) or ash content,
  • The volatile solids (VS = TS – FS)
  • Total Kjeldahl nitrogen (TKN = Org-N + TAN)
  • Total ammonical nitrogen (TAN = NH4+-N + NH3 – N),
  • Organic nitrogen (Org-N = TKN – TAN),
  • Nitrate nitrogen (NO3-N),
  • Mineral nitrogen (Min N = TAN + NO3-N),
  • Total nitrogen (TN = TKN + NO3-N),
  • Total phosphorus (TP),
  • Soluble phosphorous (Sol-P),
  • Total potassium (TK), and
  • Sulfur (S).

What did we learn?

The first important observation was related to the completeness of anaerobic digestion. The mean VS reduction ratio (g VS destroyed/g VS added) for all nine reactors was measured, and was 0.62 on the average. This  and was in excellent agreement with the literature value of 0.63 for swine manure (Hill, 1991), and indicated that anaerobic digestion was complete. The rate of TS destruction was 0.45 g TS destroyed / g TS added.

The second set of observations were related to the impact of anaerobic digestion on nitrogen. The mass of total N was not changed by anaerobic digestion, but the mass of organic nitrogen was decreased by 36% as it was mineralized to TAN. The TAN was increased by a factor of 1.84, and the mineral N (TAN + NO3-N) was increased by a factor of 1.8 on the average. The initial nitrate-N concentrations were small and evidence of denitrification was observed as indicated by a reduction in nitrate-N by 59%. The impact of N transformations was to increase the fraction of total-N that was in the total ammonical form from 33% before digestion to 59% after digestion which highlights the need to store and land apply anaerobically digested manure so as to reduce ammonia volatilization.

Anaerobic digestion was also observed to have mixed results on the mass of P, K, and S.  The mass of total-P was not significantly impacted by anaerobic digestion. On the average, 73% of the soluble-P was converted to organic P by microbial activity, and was believed to remain in the microbial biomass. There was no impact on TK by digestion as expected. The mass of S was reduced by 7% on the average presumably by the formation of small amounts of H2S.

Authors

  • John P. Chastain, Ph.D. Professor and Extension Agricultural Engineer, Clemson University, Department of Agricultural Sciences, Agricultural Mechanization and Business Program, McAdams Hall, Clemson, South Carolina 29634 USA. jchstn@clemson.edu 1-864-656-4089
  • Bryan Smith, BSAE, MSCE, Area Extension Agent – Agricultural Engineer, Clemson Extension Service, 219 West Laurens Street, Laurens, South Carolina 29360 USA.

References

Chastain, J.P. and W.B. Smith. (2015). Determination of the Anaerobic Volatile Solids Reduction Ratio of Animal Manure Using a Bench Scale Batch Reactor. Presented at the 2015 ASABE Annual International Meeting. Paper No. 152189216. ASABE, 2950 Niles Rd., St. Joseph, MI 49085-9659

Hill, D.T. (1991). Steady-State Mesophilic Design Equations for Methane Production from Livestock Wastes. TRANSACTIONS of the ASAE, 34(5):2157-2163.

Acknowledgements

This study was supported by the Clemson Extension Confined Animal Manure Managers Program and by a grant from the South Carolina Energy Office.


The authors are solely responsible for the content of these proceedings. The technical information does not necessarily reflect the official position of the sponsoring agencies or institutions represented by planning committee members, and inclusion and distribution herein does not constitute an endorsement of views expressed by the same. Printed materials included herein are not refereed publications. Citations should appear as follows. EXAMPLE: Authors. 2019. Title of presentation. Waste to Worth. Minneapolis, MN. April 22-26, 2019. URL of this page. Accessed on: today’s date.
Flushing Liquid Dairy Manure Solid Particle and Nutrient Distributions

A number of Idaho dairies use flushing systems that result in large amounts of liquid manure that are applied via irrigation systems to adjacent crop-land during the growing season. Solids and nutrients found in liquid dairy manure pose challenges to manure handling processes. Separating solids and nutrients from liquid dairy manure is a critical step to improve nutrient use efficiency and reduce manure handling costs. To better address issues related to solid/nutrients separation, a critical question needs to be answered: what are liquid dairy manure solid and nutrient distributions? Identifying solid particle distribution and associated nutrients in liquid dairy manure is necessary for designing settling ponds, choosing suitable separation technologies/equipment, and making better manure nutrient management practices.

What did we do?

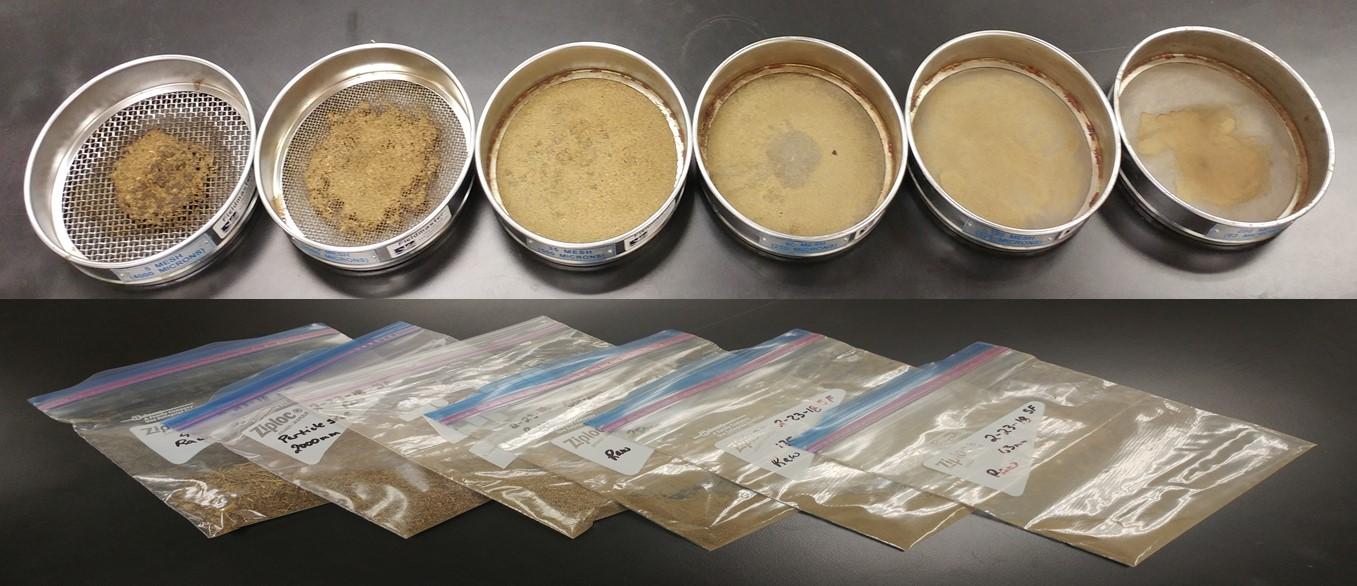
Liquid dairy manure samples were collected from a flushing receiving pit on each of three dairies (Dairy SF, Dairy DD, and Dairy SE) in Southern Idaho. Triplicate samples were analyzed for solid content, particle density, particle size distribution, total nitrogen (TN), and total phosphorus (TP). Solid content was analyzed based on Method 2540B (APHA, 2015). Particle density was analyzed based on the method ASTM D1217-15 (Weindorf and Wittie, 2003) using a pycnometer with a methanol medium for particle sizes of 4, 2, 0.5, 0.25, 0.125, 0.063, and <0.063 mm. Particle size distribution was determined using a set of 6 sieves (4, 2, 0.5, 0.25, 0.125, and 0.063 mm) combined with the hydrometer method ASTM D7928-17 (Days, 2002) for particle sizes less than 0.063mm. Nutrient parameters (TN and TP) were analyzed using a Hach spectrometer (DR 5000) based on Hach methods (Hach, 2005). The Pipette Methods ASTM D6913/D6913M-17 (Hellman and McKelvey, 1941) was used in conjunction with ASTM D7928-17 to extract liquid manure samples for analyzing the nutrient parameters. The apparatuses used for the test are shown in Figures 1, 2, and 3.

Figure 1. Sieved particles for density analysis.
Figure 2. Stacked sieve set (left) and liquid dairy manure sieve filtration apparatus (right).
Figure 3. From left: pycnometer for particle density analysis, pipette method for extracting manure samples, ASTM 152-H hydrometer, hydrometer reading of the meniscus.

What we have learned?

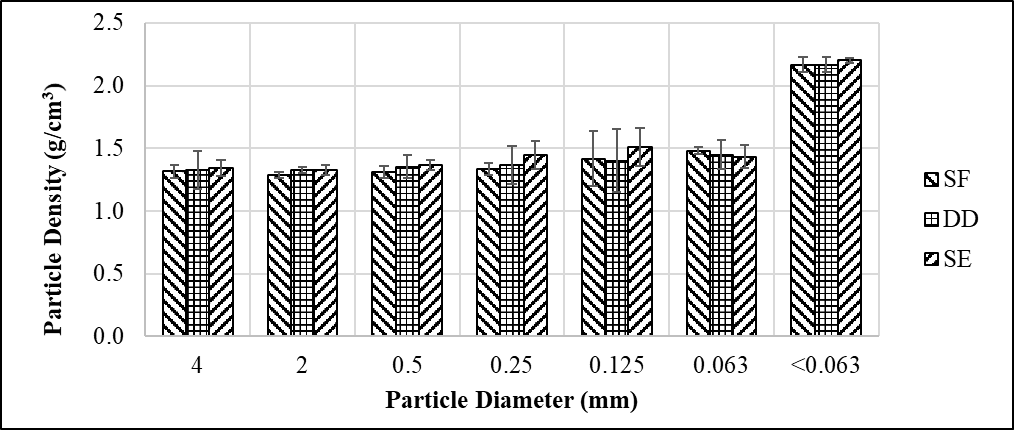
The particle densities of three dairies (Figure 4) were found to be similar ranging from 1.32 g/cm3 for particle sizes larger than 4 mm to 2.20 g/cm3 for particles less than 0.063 mm. The particle densities which are smaller than commonly used soil particle density of 2.65 g/cm3 need to be considered during design of dairy flushing water settling basins.

graph-Flushing dairy manure solid particle density of dairies SF, DD, and SE.
Figure 4. Flushing dairy manure solid particle density of dairies SF, DD, and SE.

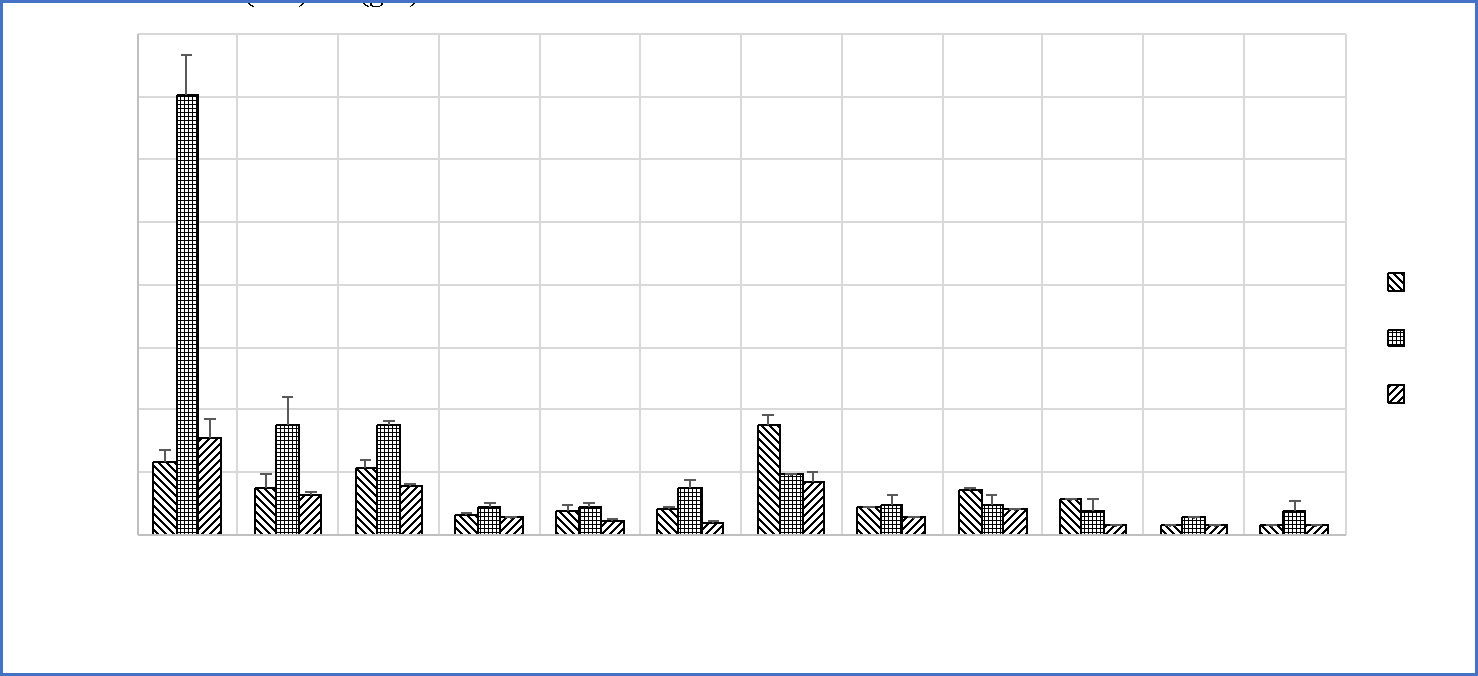
Flushing liquid dairy manure solid particle distributions of three dairies are shown in Figure 5. It was noticed that high bedding fibers were presented in the liquid manure from Dairy DD which resulted in a 32.6% of solids with particle sizes larger than 4 mm. For both Dairy SF and Dairy SE, the percentages of solids (dry weight basis) with particle sizes larger than 4 mm were 8% and 17.2%, respectively.

Figure 5. Flushing dairy manure solid particle distribution of Dairies SF, DD, and SE.

Flushing liquid dairy manure total nitrogen (TN) and total phosphorus (TP) associated with different particle groups are shown in Figures 6 and 7. There were 58.3 g (or 33.6%) and 52.1 g (or 43.9%) of TN associating with particles larger than 0.5 mm in 100 liters of flushing manure for Dairy SF and Dairy SE, respectively. There was 9.1 g (or 6.5%) of TN attaching to particles larger than 0.5 mm in 100 liters of flushing manure for Dairy DD. Most TP was attached to fine particles with sizes less than 0.5 mm for the three dairies. In order to separate more TP out of liquid stream, advanced separation methods beyond inclined screens are needed.

Figure 6. Total nitrogen (TN) associated with each particle diameter group in flushing liquid dairy manure.


Figure 7. Total phosphorus (TP) associated with each particle diameter group in flushing liquid dairy manure.

The test results showed:

  1. flushing dairy manure particle densities ranged from 1.32 g/cm3 to 2.20 g/cm3;
  2. Most TP were associated with fine particles that cannot be screened out by screens;
  3. Advanced separation technologies are needed to capture more TP from flushing liquid dairy manure.

Future plans

We will hold workshops and field days to communicate the results with producers and promote on-farm adoption of advanced separation equipment such as centrifuge.

Authors

Lide Chen, Department of Soil and Water Systems, University of Idaho; email: lchen@uidaho.edu.

Kevin Kruger, Department of Soil and Water Systems, University of Idaho.

Howard Neibling, Department of Soil and Water Systems, University of Idaho.

Additional information

APHA. (2015). Standard Methods for the Examination of Water and Wastewater. Washington D.C. : American Public Heath Assosiation., Pp. 216-217

Das, B. M. (2002). Soil Mechanics Laboratory Manual (6th ed.). New York, NY: Oxford University Press. website: site.iugaza.edu.ps/dsafi/files/2015/02/Soil-Laboratory-Manual-Das.pdf

DR5000 Spectrophotometer: Procedures manual. (2005). Germany: Hach Company

Hellman, H. H., & McKelvey, V. E. (1941). A Hydrometer Method-Pipette Method for Mechanical Analysis. Journal of Sedimentary Petrology, 11(1), P. 3-9.

Weindorf, D. C., & Wittie, R. (2003). Determining Particle Density in Dairy Manure Compost. The Texas Journal of Agriculture and Natural Resource, volume 16, Pp.60-63.

Acknowledgements

This study is supported by the USDA NIFA via WSARE project SW18-015.


The authors are solely responsible for the content of these proceedings. The technical information does not necessarily reflect the official position of the sponsoring agencies or institutions represented by planning committee members, and inclusion and distribution herein does not constitute an endorsement of views expressed by the same. Printed materials included herein are not refereed publications. Citations should appear as follows. EXAMPLE: Authors. 2019. Title of presentation. Waste to Worth. Minneapolis, MN. April 22-26, 2019. URL of this page. Accessed on: today’s date.

Fate of Antimicrobials during Dairy Manure Management and Processing

The effect of anaerobic digestion (AD) and composting manure management strategies on antimicrobial resistance (AMR) was explored at the farm and bench-scale. At the farm-scale, a collaborative project investigated the fate of antibiotics and antimicrobial resistance genes (ARGs) during manure handling, treatment, and storage at 11 dairy farms. Results showed that antimicrobials were not consistently removed during manure treatment, with most samples below detection limit, yet, others showing concentrations up to 34,000 ng/g DW in the AD effluent, for example. Antimicrobials also did not degrade significantly during field-scale composting. The farm-scale results illuminated limitations of tracking antimicrobials in complex manure treatment systems with varying manure treatment practices, retention times, and heterogeneous manure substrates. At the bench-scale, triplicate reactors with tetracycline (TC) and sulfadimethoxine (SDM) additions of 1 and 10 mg/L were digested with dairy manure and inoculum for 44-days. The AD process degraded 85% of antimicrobials at the bench-scale. There was a 99% reduction of SDM during AD. The AD reactors with TC additions showed more variability in degradation products. The ARG analysis showed that TetM gene copies decreased during AD and correlated with declines in TC, however, reductions in SDM did not correlate with decreases in Sul1 gene copies. Overall, our results showed that dairy farm antibiotics usage varies significantly from farm to farm, with occasional short-term spikes in usage in response to the treatment of illness/infection outbreaks, and therefore, tracking these spikes through complex manure handling systems proved challenging. The settling, separation, and differing retention times of solids throughout manure handling processes also made whole-farm analyses challenging, as recovery rates in the extraction process for testing antimicrobials in the laboratory varied with solid-based and liquid-based manure samples.

Authors

Stephanie Langsing, University of Maryland, slansing@umd.edu

Schueler, Jenna (University of Maryland); Crossette, Emily (University of Michigan); Naas, Kayla (University of Buffalo); Hurst, Jerod (University of Buffalo); Oliver, Jason (Cornell University); Raskin, Lutgarde (University of Michigan); Wigginton, Krista (University of Michigan); Gooch, Curt, (Cornell University); Aga Diana (University of Buffalo)

The authors are solely responsible for the content of these proceedings. The technical information does not necessarily reflect the official position of the sponsoring agencies or institutions represented by planning committee members, and inclusion and distribution herein does not constitute an endorsement of views expressed by the same. Printed materials included herein are not refereed publications. Citations should appear as follows. EXAMPLE: Authors. 2019. Title of presentation. Waste to Worth. Minneapolis, MN. April 22-26, 2019. URL of this page. Accessed on: today’s date.
Minnesota’s Runoff Risk Advisory Forecast: Forecasting the optimal time for manure application

The Runoff Risk project was started in Wisconsin in 2011, with the realization at that time, there was no real-time runoff risk guidance available for manure applicators. The project has grown, with four states (Michigan, Minnesota, Ohio and Wisconsin) now operating real-time runoff risk forecast websites.

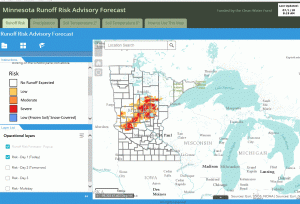
screenshot of Minnesota runoff risk advisory forecast
Figure 1. Minnesota Runoff Risk Advisory Forecast from July 1, 2018.

The Minnesota Runoff Risk Advisory Forecast (RRAF) system is a tool developed by the Minnesota Department of Agriculture (MDA) and the National Weather Service (NWS). It is designed to help farmers and commercial applicators determine the best time to apply manure to reduce the runoff risk of valuable nutrients and protect water resources. It is part of a regional risk advisory forecast project that utilizes existing NWS weather and watershed models in a water quality application. Figure 1 shows a screenshot of the website from July 1, 2018, indicating the runoff risk forecast in the central part of the state.

Runoff Risk Analysis

The NWS models continuously simulate soil moisture and temperature conditions as well as incorporating future precipitation and temperature forecasts and current and future snowpack. An algorithm that looks at chosen model state values is evaluated for a variety of risk conditions, such as runoff and soil saturation. Based on over 20 years of simulations, basin specific thresholds were created. Finally, there was post–processing of that data that is run on the output to produce risk events. This information is provided daily to the project partners through data servers. The data is processed and the website is updated twice daily. The graphic displays the different risk events predicting the likelihood of today (Day 1), tomorrow (Day 2), and Day 3 or multi-day (Day 1 through Day 3 combined) runoff events. Farmers and commercial applicators use an interactive map to locate their field and find their forecasted risk. Users can also sign up for email or text messages for their county that alert them to a severe runoff risk for that day.

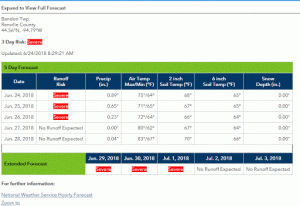
screenshot of tabular format risk advisory forecast
Figure 2. Tabular 5 day forecast from June 24, 2019 in Bandon Township, Renville County, Minnesota.

Runoff risk is grouped into four categories: No event, Low, Moderate and Severe. When the risk is Moderate or Severe, it is recommended that the applicator evaluate the situation to determine if there are other locations or later dates when the application could take place. Figure 2 shows results for a specific location in Bandon Township in Renville County, Minnesota. For the first three days, the risk of runoff at that specific location was Severe, which indicated that a producer should wait to apply.

Daily Mapping Information

screenshot of soil temperature map
Figure 3. Daily soil temperature forecast at 6 inch depth for Minnesota.

The RRAF website also provides statewide forecasted daily average two inch soil depth temperatures which can be useful at planting time, daily average six inch soil depth temperatures which are helpful when determining fall fertilizer application in appropriate areas and daily precipitation forecasts. Figure 3 shows the daily soil temperature forecast at the six inch depth for the state of Minnesota. The colored dots are real time soil temperature gauges that can be interactively clicked on to reveal current soil temperature. The color of the dot is not reflective of the temperature at the gauge. It simply notes what entity is in charge of the gauge.

Potential of RRAF

This is a relatively new application that has been implemented in Minnesota since March 2018. The potential impacts of usage on this could be quite large. Any time movement of manure to water resources can be minimized is a success for the farmer and the environment. The overall goal of the presentation is to make people aware of this tool, share information on the performance, and encourage potential users to add this tool to their “toolbox”. The main message is to check conditions, delay if necessary, and spread on the day when there is least potential impact to the environment.

Further partnerships are desired to continue to get the word out on this application. Yearly multi-state coordination meetings occur, with the next meeting coming up in Ohio in August 2019. Version 3 of the RRAF will be derived from the National Weather Service National Water Model. Development on this version will start in Spring 2019 and should take four years for it to be merged into the National Water Model system. For MDA, we continue to promote RRAF website and monitor the output, comparing it to real time data to make sure that the model is working correctly.

Heather Johnson, Hydrologist 3, Minnesota Department of Agriculture

Heather.johnson@state.mn.us

Additional information


The authors are solely responsible for the content of these proceedings. The technical information does not necessarily reflect the official position of the sponsoring agencies or institutions represented by planning committee members, and inclusion and distribution herein does not constitute an endorsement of views expressed by the same. Printed materials included herein are not refereed publications. Citations should appear as follows. EXAMPLE: Authors. 2019. Title of presentation. Waste to Worth. Minneapolis, MN. April 22-26, 2019. URL of this page. Accessed on: today’s date.
Sidedressing Corn: Swine Manure via Dragline Hose Produces Yields Comparable to Synthetic Fertilizer

Spring in the upper Midwest can be short, resulting in challenges for producers to apply manure and plant crops in a timely manner to maximize yield. This results in a significant       amount of manure applied in the fall after the crop is harvested. Fall applied manure has ample time to mineralize and leave the root zone before next season’s crop can utilize the nutrients. These nutrients can end up in rivers and other freshwater bodies decreasing water quality. Sidedressing manure in growing crops could provide producers with another window of opportunity to apply their manure, maximize nutrient uptake efficiency, and protect water quality. The summer of 2018 was the start of a two-year, on-farm study researching the effectiveness of sidedressing slurry swine manure to corn via dragline hose. The swine manure was compared to sidedressed anhydrous ammonia, 32% urea ammonium nitrate (UAN), and a  control that received no additional nitrogen at the time of sidedressing.

What we did

Corn was planted May 7th with a 12-row planter equipped to apply an in-furrow and top dressed liquid fertilizer. The total fertilizer applied at planting was 40.7 lbs of nitrogen (N), 19.8 lbs of P2O5 phosphorus (P), and 14.4 lbs of sulfur (S) per acre.

Sidedressing the nitrogen sources

We sidedressed all treatments on June 4-5 with 140 pounds of available N, except the control which had no additional N applied. All the equipment applied nutrients between 30-inch rows and fit a 12-row planter to match up on odd rows.

  • Anhydrous ammonia treatment = 12-row toolbar and tractor were supplied by the farmer.
  • Finishing hog manure dragline hose treatment = The toolbar for the dragline hose sidedress was supplied by Bazooka Farmstar. The toolbar is a coulter till 28-foot bar with 30-inch spacing.
  • UAN treatment = The tool bar for the UAN sidedress application was provided by a local farmer.
  • Control treatment = The control treatment did not receive any fertilizer at sidedress.
Swine manure slurry being applied via dragline hose and Bazooka Farmstar sidedress bar.

Soil data collection methods

Soil nitrate and ammonium samples were taken 5 times through the growing season, approximately every 4 weeks, to track nitrogen in the soil profile. Soil sample depths were 0-6, 6-12, and 12-24 inches from the soil surface. Soil

Two foot soil sampling with tractor probe.

samples were taken from the middle of the interrow, 7.5 inches from both sides of the middle of the inter row and in the middle of the row. This sample method assured soil samples would be representative of the soil profile since banded fertilizer can skew results.

Yield data collection methods

Yield was harvested October 6th by a combine with a 6-row head. The combine took the middle 12 rows of the 24-row treatment reducing the side effects from neighboring treatments. A calibrated weigh wagon measured the weight of each combine pass which was calculated to find yield in bushels per acre for every sample.

What we have learned

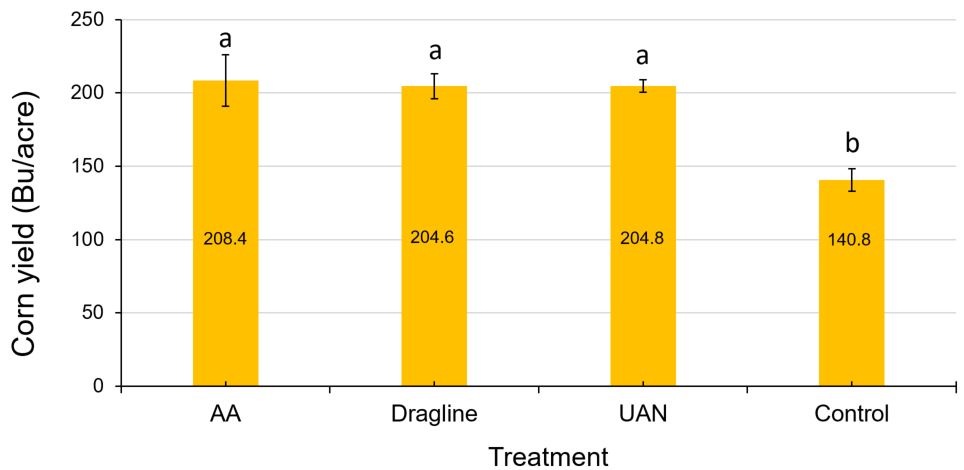
First year data revealed all sidedressed nitrogen sources significantly increased corn yields over the control but were otherwise statistically similar (Figure 1).

Figure 1. Yield data from 2018 manure sidedress trial in bushels per acre. AA=anhydrous ammonia, UAN=urea ammonium nitrate, Control=received no additional N at sidedress, and Dragline=swine manure slurry applied via dragline hose.

When we analyzed the soil inorganic nitrogen by each date differently, nitrogen concentrations between treatments were only statistically different on the soil sample date of June 15th (Figure 2) This soil sample date was ten days after the sidedress application on June 4th.  All other soil nitrogen sample dates are not statistically different between treatments and even the control.  

Figure 2. Total soil inorganic N (ammonium and nitrate) by treatment and sample date.

Statistics have not yet been run on the whole plant nitrogen content data in the graph below but numerically there doesn’t seem to be a difference in nitrogen content between the three sidedress treatments but a difference from the control (Figure 3).

Figure 3. Percent nitrogen in harvest grain, R6 cobbs, and R6 stover between treatments.

Future plans

The first year of data was collected during the 2018 growing season and a second year of data will be collected in the summer of 2019. This study aims to evaluate the effectiveness of sidedressed swine manure slurry compared to traditionally used synthetic fertilizers. Since we have seen promising results this first year an additional study that could follow this experiment would be a direct comparison of fall applied swine manure and sidedressed swine manure. This information would help us understand the efficiency of sidedressing compared to fall application. Soil samples from this study would also illustrate the difference in mineralization and nitrogen movement between fall-applied and sidedressed swine manure slurry.    

Authors

  • Chris Pfarr, M.S. student in the Land and Atmospheric Sciences Program, University of Minnesota, pfarr025@umn.edu
  • Melissa Wilson, Ph.D., Assistant Professor and Extension Specialist, Department of Soil, Water, and Climate, University of Minnesota, mlw@umn.edu

Additional information

Acknowledgements  

This project was partially funded by the Minnesota Soybean Research and Promotion Council and the Minnesota Pork Board.

The authors are solely responsible for the content of these proceedings. The technical information does not necessarily reflect the official position of the sponsoring agencies or institutions represented by planning committee members, and inclusion and distribution herein does not constitute an endorsement of views expressed by the same. Printed materials included herein are not refereed publications. Citations should appear as follows. EXAMPLE: Authors. 2019. Title of presentation. Waste to Worth. Minneapolis, MN. April 22-26, 2019. URL of this page. Accessed on: today’s date.

Methodologies for In-situ Characterization of the Impact of Equine Manure Management Practices on Water Quality

Nutrient loading of nitrogen and phosphorus in runoff and water leachate threatens Florida’s environmental and water resources. Of those nutrients, nitrate (NO3) nitrogen is highly soluble and not strongly bound to soils. Consequently, nitrate is highly mobile and subject to leaching losses when both nitrate content and water movement are high.

Due to Florida’s sandy soils and humid subtropical climate, nitrate losses from leaching and runoff are high and creates concerns for animal waste handling1. Mitigating nutrient loading to ground and surface waters through proper management of horse manure and stall waste can help protect water quality. However, information regarding the relationship between on-farm equine manure management practices and water quality remains limited.

What did we do

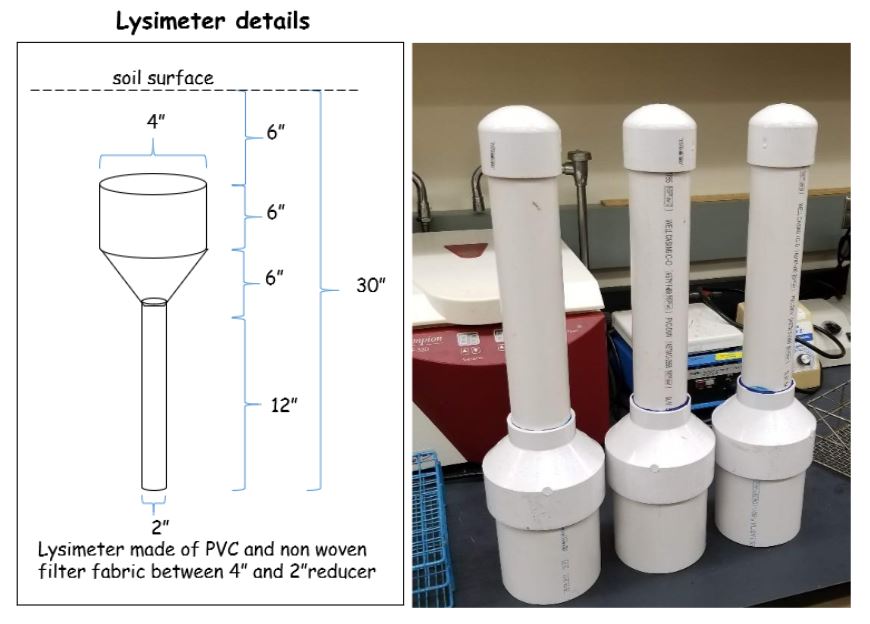
The objective of this study was to address waste management challenges on Florida equine operations by developing methodologies for in-situ characterization of nutrient profile of pore and surface water runoff from stockpiled equine waste and waste that has been effectively composted. Two small-scale horse properties with 2-8 horses managed on 4-9 acres, and 1 larger scale operation with up to 70 horses managed on 300+ acres located within the Rainbow Springs Basin Management Action Plan (BMAP) were enlisted for the project. Lysimeters (soils enclosed in suitable containers and exposed to natural surroundings to capture leachates) were constructed of PVC and non-woven filter fabric suspended between a 4” and 2” PVC reducer with a total length of 24” and deployed 6” below ground2 (Figure 1).

Figure 1. Design details and image of lysimeters used for leachate collection. Each lysimeter was equipped with silicone tubing for effluent collection.


One hole was drilled between the 4” and 2” PVC reducer to insert the sampling lines to the bottom well of the lysimeter and secured with duct tape. For each lysimeter installation, the top 6” of the soil profile was removed using a 6” diameter core ring to ensure the soil profile was undisturbed. The remaining 6”-12” depth of soil was composited and repacked into the lysimeter container, layer by layer. An auger was used to achieve a total depth of 30 inches from the surface to secure the lysimeter in the ground. Following lysimeter installation, the top 6” of intact soil was replaced above the lysimeter and all lines were buried 6” in the soil and channeled to one central location. The collection trenches were fabricated from vinyl gutter material filled with river rock (pre-rinsed for removal of iron and sediment) and installed up and downgradient at stockpile systems and at the opening of each compost bin. A 5-gallon bucket attached to the downgradient gutter served as the water collection reservoir (Figure 2).

three bin compost structure
Figure 2a) Three bin manure compost structure
Manure stockpile structure
Figure 2b) Manure stockpile structure

Figure 2. Placement of runoff collection trenches within the (a) compost and (b) stockpile manure bin structures. The trenches intercept any runoff during heavy rainfall and drain into a 5-gallon bucket. Once the bilge pump below the bucket is adequately submerged, the water is evacuated to the secondary collection bucket for sampling.

Figure 3. Arrangement of the eight peristaltic pumps on a hand truck dolly for ease of transport. The pumps with connected clear silicone tubing are attached to the lysimeter collection line for leachate collection.

For the lysimeter leachate sampling, eight peristaltic pumps were arranged in an array of 4 pumps wired together and controlled by an on/off switch connected to a sampling tube of the lysimeter (Figure 3).
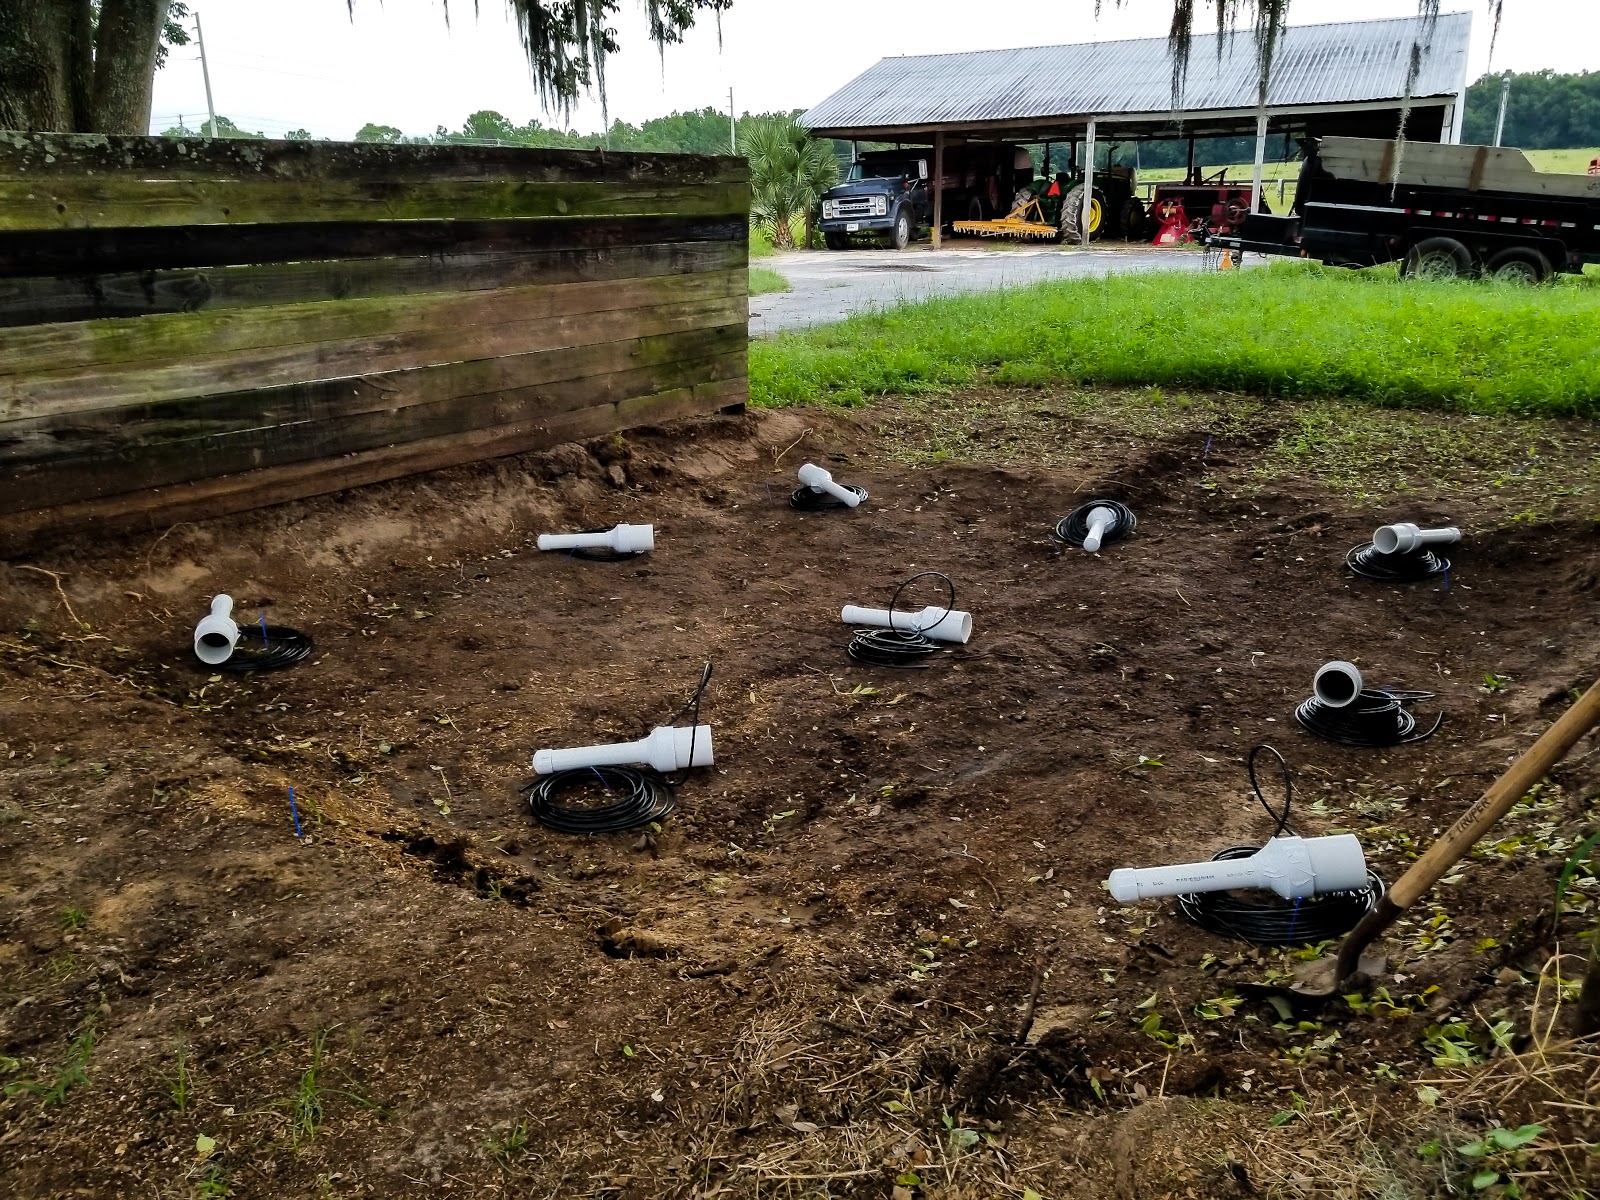
A grid of 4-5 lysimeters were placed under each compost bin for collection and compositing of samples. The lysimeters for the stockpile were arranged in a 3×3 grid across the stockpile bin with each row (3 lysimeters) representing a composited sample (Figure 4).

Figure 4. Pre-installation and arrangement (3x3) of the lysimeters within the manure stockpile structure.
Figure 4. Pre-installation and arrangement (3×3) of the lysimeters within the manure stockpile structure.

The lysimeters were purged with deionized water after two weeks or after a heavy rainfall event prior to the first sample collection.  For water runoff collection, a 12 volt (500gph) automatic bilge pump, powered by a marine battery, was used to pump water from the collection bucket to a 5-gallon sampling bucket. A 10% subsample was collected with the remaining 90% expelled to the ground surface using a 2-way restricted-flow Y connector. Runoff samples (collected immediately post rainfall event) and leachate samples (collected biweekly) were acidified and stored in scintillation vials at 4oC for nutrient analysis (NO-X, NH4+, TKN, and TP).

Outcome

 The lysimeter and water runoff collection trench construction provide a cost-effective, easily deployed system for characterizing nutrient loading in leachate and surface runoff from manure storage and composting sites. The system has been successful in collecting samples for nutrient analysis, however, a few challenges have also been identified. (1) The runoff system requires periodic maintenance, primarily cleaning (re-rinsing) the gutter and river rock to remove any material lying above the trench. (2) Also, the Y connectors require calibration every month to remove leaf litter and other debris to allow water flow through the valves to ensure a 10% subsample is collected. (3) Suspended materials (fine soil or organic matter) have been observed in lysimeter leachate samples and runoff collection trenches. (4) A subset of lysimeter samples have emitted a sulfur odor when adverse weather conditions or other events delay sampling beyond the target 2-week interval.

Future plans

To assess potential nitrate losses due to sample retention time, the lysimeter effluent will be sampled at specific intervals (day 1, day 3, day 6, day 9, day 14) during a period of no rainfall. These measurements should help determine the optimal time interval for sample collection for analysis of nitrate levels.  Additionally, runoff samples are being collected for analysis of fecal coliform and E. coli. The methodologies employed in this field level study represent an important step towards an improved understanding of the impact of manure management BMPs on water quality.

Corresponding author, title, and affiliation

Agustin Francisco, Graduate Student, University of Florida

Corresponding author email

afran@ufl.edu

Other authors

Carissa Wickens, State Extension Horse Specialist, University of Florida Mark Clark, Wetland Ecologist, University of Florida; Caitlin Bainum, Extension Agent, Florida Cooperative Extension, Marion County, Ocala, Florida; Megan Mann, Extension Agent, Florida Cooperative Extension, Lake County, Tavares, FL

Additional information

1FDEP. 2013. Small Scale Horse Operations: Best Management Practices for water resource protection in Florida.

2Bergstrom, L. 1990. Use of lysimeters to estimate leaching of pesticides in agriculture soils. J. Environmental Pollution. 67:325-347

Additional information regarding this project is available by contacting Carissa Wickens (cwickens@ufl.edu), or Agustin Francisco (afran@ufl.edu).

Acknowledgements

The authors wish to thank the Southwest Florida Water Management District (SWFWMD) for funding support, the farm site cooperators Dave and Deb Kane, Jim and Merry Lee Bain, and Eli and Jeff McGuire. We would also like to thank Carol Vasco, Ellen Rankins, Ana Margarita Arias, Anastasia Reif for their assistance with site installation and data collection.

The authors are solely responsible for the content of these proceedings. The technical information does not necessarily reflect the official position of the sponsoring agencies or institutions represented by planning committee members, and inclusion and distribution herein does not constitute an endorsement of views expressed by the same. Printed materials included herein are not refereed publications. Citations should appear as follows. EXAMPLE: Authors. 2019. Title of presentation. Waste to Worth. Minneapolis, MN. April 22-26, 2019. URL of this page. Accessed on: today’s date.

Nutrient Leaching Under Manure Staging Piles

For many livestock producers, manure storage capacity is limited.  Severe weather events can intensify the manure storage capacity limitations.  One option available to producers is to haul manure to the field and place it in manure staging areas.  This can reduce the manure storage capacity needed at the livestock facility, and reduce manure hauling time in the spring.  Hauling of manure to manure staging areas is typically done when convenient, with little thought about the effect of timing and nutrient loss.  This study examined nutrient loss from manure staging piles placed in November, January, and March over a course of five years.

What Did We Do?

This study compared manure staging areas with manure placed at three different times (November, January, and March) and two different bedding materials (straw, no straw).  

For each placement event (November, January, March) manure from the tie stall barn (straw bedding) and the butterfly sheds (sand bedding) at the Utah State University Caine Dairy was hauled to Cache Junction, UT and placed in manure staging piles.  Composite manure samples were collected from each pile (manure type) at the time of placement, and at removal each year (in the fall after crop harvest) for five years. Manure samples were analyzed for ammonium-nitrogen using Method 12-107-04-1-F on a Lachat Flow Injection Analysis (FIA) analyzer and total N using an Elementar combustion analyzer.  Leachate was collected biweekly by means of zero-tension lysimeters installed under the manure staging areas and analyzed for ammonium-nitrogen using Method 10-107-06-2-O and nitrate-nitrogen using Method 10-107-04-1-R on a Lachat FIA analyzer. Soil samples were taken to a depth of 90 cm and analyzed for nitrate-nitrogen using Method 12-107-04-1-F on a Lachat FIA analyzer.

What Have We Learned?

Figure 1. Total N (mg) in leachate/lysimeter under manure staging piles.

Significant leachate was produced under the manure staging piles placed during the winter months, with the manure with no straw (sand bedding) producing more leachate than the manure with straw (straw bedding).  Manure piles placed in November produced less leachate and lost less total N than those placed in January and March (Figure 1). Due to Utah’s dry climate, this is most likely due to drying of the manure in the late fall months, which enabled the manure to absorb more moisture during the winter months. Manure piles placed in January produced the most leachate and exhibited more total N loss (Figure 2).

Difference in manure Total N% from time of placement to removal for land application.
Figure 2.  Difference in manure Total N% from time of placement to removal for land application.

The snow and snow melt most likely contributed to the large amount of leachate and nitrogen loss observed under the January piles.

Future Plans

The results of this study indicate that straw bedding helps retain the nitrogen in the manure and reduce nitrogen loss from manure placed in manure staging piles.  In addition, in Utah’s dry climate, the timing of manure staging pile placement does affect nutrient loss with placement in late November minimizing nutrient leaching.  This information will be presented to producers, NRCS, DWQ, and other ag professionals.

Authors

Rhonda Miller, Ph.D.; Agricultural Systems Technology and Education Dept.; Utah State University, rhonda.miller@usu.edu

Jennifer Long; Agricultural Systems Technology and Education Dept.; Utah State University

Additional Information

Website:  http://agwastemanagement.usu.edu

Acknowledgements

The authors gratefully acknowledge support from Utah State University Experiment Station.


The authors are solely responsible for the content of these proceedings. The technical information does not necessarily reflect the official position of the sponsoring agencies or institutions represented by planning committee members, and inclusion and distribution herein does not constitute an endorsement of views expressed by the same. Printed materials included herein are not refereed publications. Citations should appear as follows. EXAMPLE: Authors. 2019. Title of presentation. Waste to Worth. Minneapolis, MN. April 22-26, 2019. URL of this page. Accessed on: today’s date.
What Does Manure Collection and Storage Look Like?

Home | Animal Ag Trends | Manure Management (You Are Here) | Nutrients | Water Quality | Clean Water Act | Stewardship | Conservation | Conservation Practices

Farms collect and store manure in different ways. For the most part, manure is handled and stored as either solid, slurry, or liquid. The biggest differences are between systems designed for solid manure and those designed for liquid or slurry manure.

Solid Manure

Solid manure is approximately 80% (or less) moisture and 20% (or more) solids. It can be stacked into piles and handled with equipment like front-end loaders and box scrapers. Semi-solid manure (around 15% solids) is handled and stored the same as solid manure.

Common examples where farms handle manure as a solid:

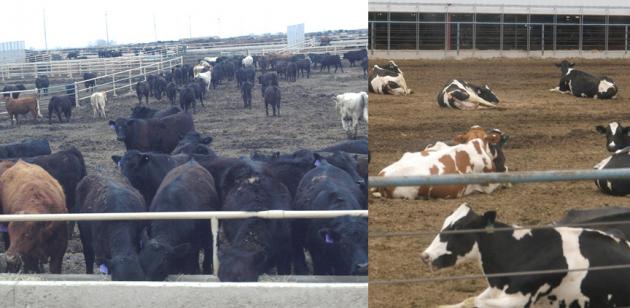
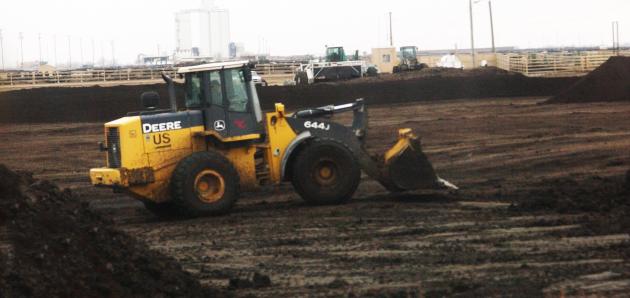
  • Beef feedlots and dairy farms scrape manure from open earthen lots (Photo 1)
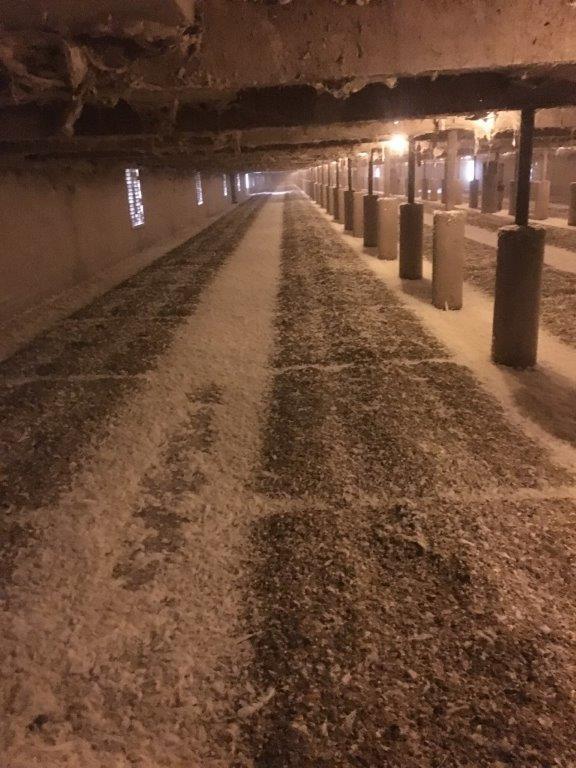
  • Broiler (meat chicken) litter is a mix of manure, feathers, and bedding (Photo 2)
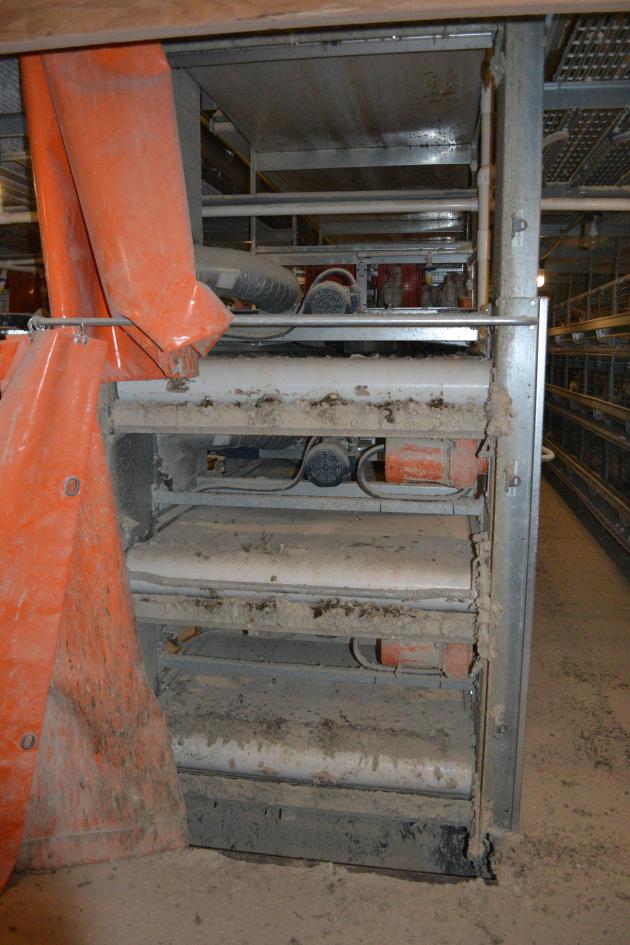
  • Layer (egg-producing chicken) manure contains feathers but no bedding (Photo 3)

Less common examples where farms handle manure as a solid:

an open beef feedlot on left and dairy lot on right

Photo 1. (Above) Two examples of open earthen lots with beef cattle on the left and dairy cattle on the right.

broiler litter being cleaned out of a barn (left) and broiler chicks (right)

Photo 2: (Above) Broiler litter being cleaned out of a house (left) and what a similar house looks like when populated with chickens (right). Photos courtesy of Josh Payne, Oklahoma State University.

manure belt system for removing manure from layer hen house

Photo 3: (Above) Most layer hen houses built recently use belt systems to remove manure. Several cages are stacked on top of each other and a belt in between each tier catches the manure. The belts convey manure to a collection point; manure is taken from the collection point to a separate storage area. Photo courtesy of Robb Meinen, Pennsylvania State University.

Solid Manure Storage

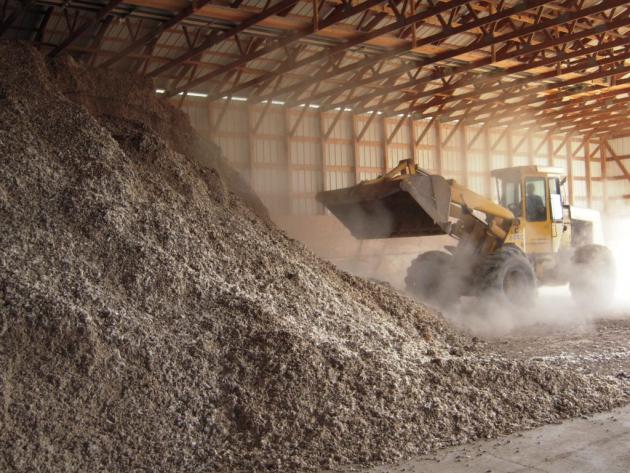
Solid manure is typically stacked or piled in storage areas that may be covered (Photos 4 and 6, below) or uncovered (Photo 5, below) depending on the amount of rainfall or snowmelt an area receives. Farms in arid areas are more likely to manage solid manure storage areas without a roof or cover.

Roofs or covers prevent rain or snowmelt from entering the storage area, but are more expensive to build. If precipitation causes runoff from uncovered solid manure storage areas, the runoff needs to be captured and contained to prevent it from reaching streams, lakes, or other surface water.

manure storage area in the lower level of a high-rise layer hen house

Photo 4. (Above) Solid layer hen manure is stored on the ground level of this high-rise layer house. The hens are housed in the upper level and manure falls through slats in the floor. High-rise houses used to be the most common system for layer hens but are gradually being replaced by manure belt systems. Image courtesy of the United Egg Producers.

a beef feedlot manure storage area showing equipment used to stack the manure

Photo 5. (Above) The solid manure storage area and handling equipment for a beef feedlot.

a covered solid manure storage facility on a poultry farm

Photo 6. (Above) A covered manure storage structure on a poultry farm. Photo courtesy of David Schmidt, University of Minnesota.

Slurry Manure

Slurry manure is approximately 10-15% solids. It is a very thick liquid that requires pumps for collection and handling. Equipment and structures for handling slurry manure need to be engineered for materials of this consistency.

Common examples where farm collect and handle manure as a slurry:

  • Pig manure in deep pit barns
  • Dairy manure in scrape (Photo 8, below) or vacuum systems in free stall barns

Less common examples where farms collect and handle manure as a slurry:

  • Layer hen farms with scrape systems
  • Slatted floor beef buildings with a manure pit

a slatted floor in a pig barn

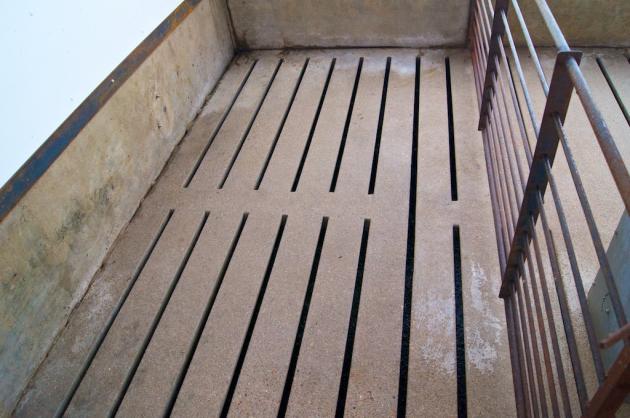
Photo 7. (Above) A slatted floor in a small-scale swine research barn. Slatted floors are part of both slurry and liquid manure collection systems, especially on pig farms. If a deep pit for long-term storage is beneath this floor, the farm handles manure as a slurry. If manure is flushed from beneath the slats to an external storage structure, the farm likely handles manure as a liquid. Photo courtesy of Rick Ulrich, University of Arkansas.

scrape system for collecting slurry manure in a dairy barn

Photo 8: (Above) An automated scraper collecting slurry manure in a freestall dairy barn. Slurry manure can also be collected from barns or feed pads using vacuum tankers. Photo courtesy of Karl Vandevender, University of Arkansas.

Liquid Manure

Liquid manure has only a small amount of solids (less than 5%). It is very dilute in terms of nutrient content and cannot be hauled long distances because of the cost of hauling large amounts of water. Liquid manure is collected and handled with gravity flow or pumps and is stored in structures called ponds or lagoons.

Common examples where farms handle manure as a liquid:

  • Runoff holding ponds for open earthen lots (beef or dairy)
  • Pull-plug or flush systems in pig barns
  • Flush systems in dairy barns

Less common examples where farms handle manure as a liquid:

  • Layer hen farms with flush systems

Slurry and Liquid Manure Storage

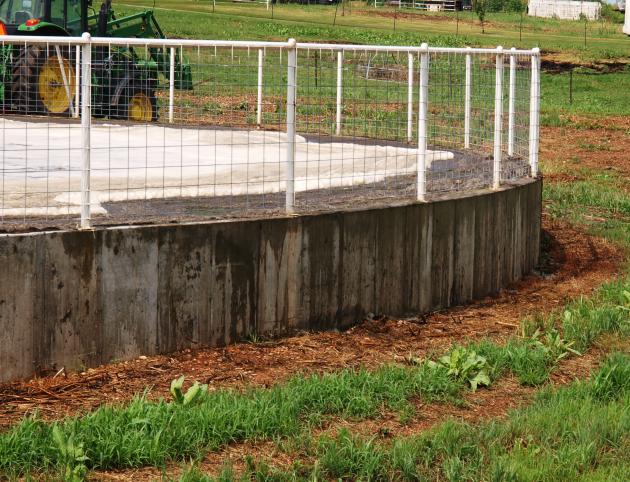
Slurry and liquid manure can be stored in earthen pits (Photo 9, below), holding ponds, or treatment lagoons. They can also be stored in above-ground tanks (Photo 10, below) or in concrete structures (Photo 11, below).

an earthen liquid manure storage structure

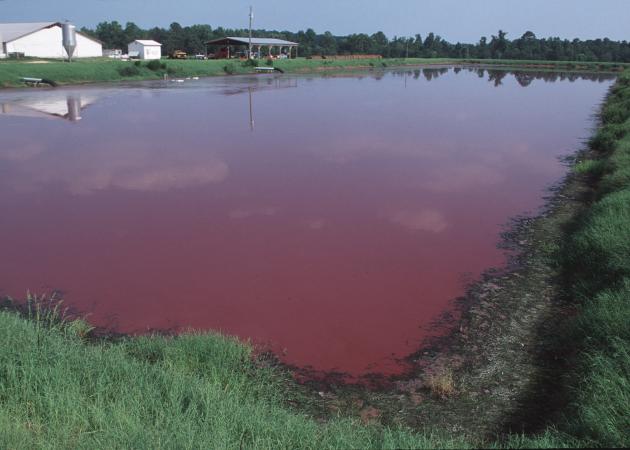
Photo 9. (Above) An earthen liquid manure storage structure on a pig farm. Photo courtesy of USDA NRCS.

an above ground slurry manure storage tank

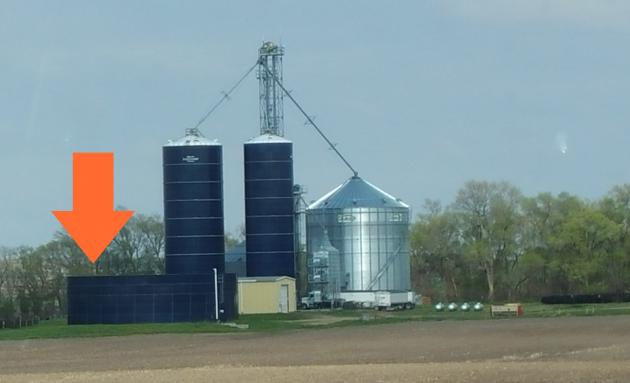
Photo 10. (Above) The orange arrow points to an above-ground steel manure storage tank.

a concrete manure storage structure on a dairy farm

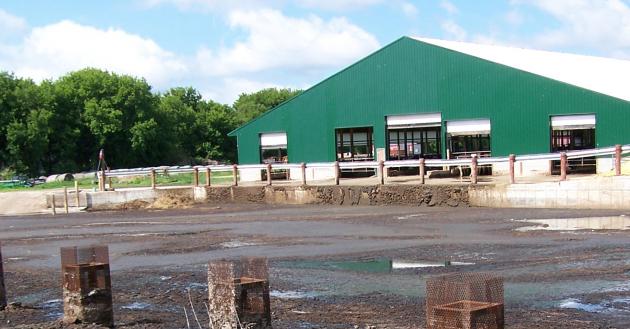
Photo 11. (Above) The manure storage structure on this dairy farm includes a concrete wall near the barn and ramp for access when removing manure. Photo courtesy of David Schmidt, University of Minnesota.

The video below, produced by the University of Wisconsin, introduces systems for handling and storing liquid and slurry manure. It also discusses safety precautions for these systems and structure. The final section covers the importance of agitation, or mixing, when preparing manure for land application.

Process Wastewater

Process wastewater is water used by farms, often for cleaning, which comes in contact with animals, manure, or feed. It may also contain chemicals for sanitizing or cleaning a product or surface. This is not considered to be manure, but must be captured and contained and can be stored in the liquid manure storage structure or a separate structure.

Common types of process wastewater generated on animal farms:

  • Egg wash water
  • Milking center wash water

Covered Manure Storage

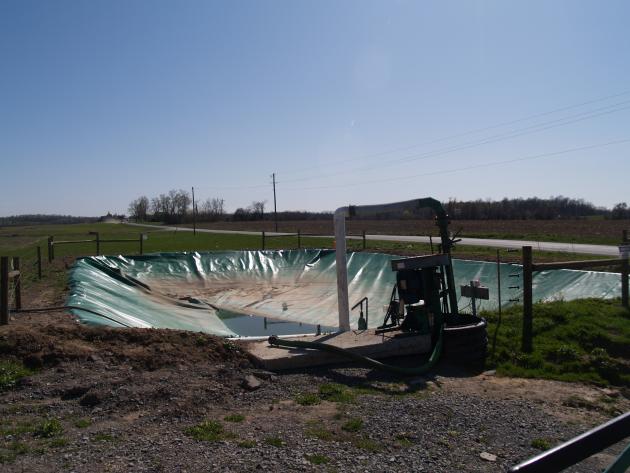
In recent years, the use of covers on manure storage structures has increased. This is especially true for pig farms. Covers are primarily used to address odor concerns, but can also be part of an anaerobic digestion system. Photo 12, below, shows a covered manure storage structure.

a small manure storage structure with a cover installed

Photo 12: (Above) A very small earthen manure storage structure with a cover installed. Most covered manure storage structures are larger than this but look very similar.

Is There Enough Manure Storage Capacity?

The main purpose of manure storage is to contain manure, process wastewater, and contaminated runoff until it can be safely and appropriately applied to crop fields or be used in an alternative manner. Good stewardship of manure storage involves two important steps:

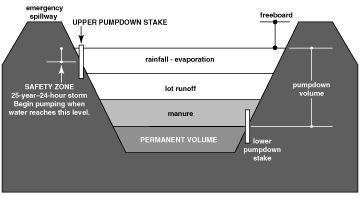
  1. Designing the facility so it has enough capacity to store manure and process wastewater generated by the farm plus precipitation plus freeboard (margin of safety) during time periods when land application is not possible or appropriate.
  2. Operating and maintaining the manure storage or treatment facility so that problems can be identified and prevented or corrected before they cause overflows or failures.

There are several considerations when calculating the amount of capacity needed in the manure storage or treatment structure and planning for its operation and maintenance.

Regulatory requirements. For some farms, the minimum amount of storage capacity and freeboard as well as frequency of inspections is prescribed by regulation. Keeping records on design and construction, inspections and findings, maintenance activities, corrections made, and amount of manure or process wastewater in the storage structure is essential to prove the requirements are met.

Cropping system. Manure is not usually applied to fields between planting and harvest for cultivated crops. The amount of time fields are unavailable during the growing season should be factored into the planning for manure storage structures. Hay or pasture fields add some flexibility because manure can be applied more often. But, as with cultivated crops, hay or pasture fields should not have more manure nutrients applied than is agronomically indicated in the nutrient management plan. Farmers who rely on off-site manure transfers to neighboring farms or for other uses should also consider the cropping system or other timing needs of manure recipients and plan their storage period appropriately.

Climate. The design capacity of manure storage will be influenced by the amount of time that manure must be stored during extended time periods that are undesirable for land application. Those include times when soils are frozen, snow-covered, or saturated. Design capacity for uncovered manure storage structures also needs to consider how much rain or snow melt may add to manure levels.

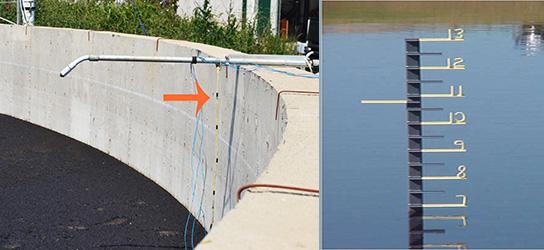
two examples of liquid manure depth markers

Photo 13. (Above) This collage shows two depth markers in manure storage structures. The concrete structure on the left includes a simple rope (see orange arrow) marked at regular intervals as a way to monitor manure levels. The marker on the right is more elaborate and includes (recommended) a “start pumping” mark (yellow bar extending to the left). The especially important levels a farm manager should know are “start pumping” when the level reaches design capacity and, for some structures, “stop pumping” when it reaches a lower limit. It is also important to know the level to which manure should be pumped/emptied before entering a season where land application is not possible. If a state bans manure application from December 15 until April 1 for example, a farm should know which mark manure levels should be below to ensure enough storage capacity going into that season. Concrete structure image courtesy of Robb Meinen, Pennsylvania State University and metal depth marker image courtesy of Leslie Johnson, University of Nebraska.

Future plans. What are the chances a farm will add more animals in the future? Expanding to 1,500 animals when the manure storage is designed for 1,000 means the structure will fill up faster than originally intended, making unlawful spills or inappropriate land application practices more likely.

diagram

Figure 1. A schematic of the different categories of waste and the related volumes that the storage design must accommodate. More than just manure, process wastewater, or open lot runoff needs to be factored into the designed capacity. Anaerobic lagoons require a minimum volume at all times so that the bacteria treating the manure remain present and active. Some minimum storage level also helps keep the bottom sealed by preventing drying and cracking. Storage or treatment structures that do not have a roof or cover also need to hold typical rainfall or snowmelt for the area. Every storage structure storage should be designed and managed to maintain a margin of safety, or freeboard, so that it is never filled to the top. Figure courtesy of University of Missouri Extension via Dr. Charles Fulhage.

Resources On Manure Storage Design and Sizing

a manure storage full and near overtopping

Photo 14. (Above) A manure storage structure about to overflow due to recent rainfall. This problem is most common when long winters or extended wet periods in the fall or spring make manure land application difficult or impossible. Managing this risk requires planning ahead as much as possible to prevent it.  In this photo, the farm is agitating the manure and getting ready to apply it to a field to lower the manure level in the storage structure. Favorable weather conditions allowed application when field soil conditions were acceptable, or no longer saturated.

Recommended Reading

Previous: Trends in Animal Ag & Manure | Next: Manure Nutrients and Land Application

Acknowledgements

These materials were developed by the Livestock and Poultry Environmental Learning Center (LPELC) with funding from the U.S. Environmental Protection Agency and with input from the Natural Resources Conservation Service, National Cattlemen’s Beef Association, National Milk Producers Federation, National Pork Board, United Egg Producers, and U.S. Poultry and Egg Association.

For questions on these materials, contact Jill Heemstra, jheemstra@unl.edu. All images in this module, unless indicated otherwise, were provided by Jill.

Reviewers: Tetra Tech, Inc.; Joe Harrison, Washington State University; Rick Koelsch, University of Nebraska; and Tom Hebert, Bayard Ridge Group

Cataloging and Evaluating Dairy Manure Treatment Technologies


Proceedings Home | W2W Home w2w17 logo

Purpose

To provide a forum for the introduction and evaluation of technologies that can treat dairy manure to the dairy farming community and the vendors that provide these technologies.

What Did We Do?

Newtrient has developed an on-line catalog of technologies that includes information on over 150 technologies and the companies that produce them as well as the Newtrient 9-Point scoring system and specific comments on each technology by the Newtrient Technology Advancement Team.

What Have We Learned?

Our interaction with both dairy farmers and technology vendors has taught us that there is a need for accurate information on the technologies that exist, where they are used, where are they effective and how they can help the modern dairy farm address serious issues in an economical and environmentally sustainable way.

Future Plans

Future plans include expansion of the catalog to include the impact of the technology types on key environmental areas and expansion to make the application of the technologies on-farm easier to conceptualize.

Corresponding author name, title, affiliation  

Mark Stoermann & Newtrient Technology Advancement Team

Corresponding author email address  

info@newtrient.com

Other Authors 

Garth Boyd, Context

Craig Frear, Regenis

Curt Gooch, Cornell University

Danna Kirk, Michigan State University

Mark Stoermann, Newtrient

Additional Information

http://www.newtrient.com/

Acknowledgements

All of the vendors and technology providers that have worked with us to make this effort a success need to be recognized for their sincere effort to help this to be a useful and informational resource.

The authors are solely responsible for the content of these proceedings. The technical information does not necessarily reflect the official position of the sponsoring agencies or institutions represented by planning committee members, and inclusion and distribution herein does not constitute an endorsement of views expressed by the same. Printed materials included herein are not refereed publications. Citations should appear as follows. EXAMPLE: Authors. 2017. Title of presentation. Waste to Worth: Spreading Science and Solutions. Cary, NC. April 18-21, 2017. URL of this page. Accessed on: today’s date.
USDA-NRCS and the National Air Quality Site Assessment Tool (NAQSAT) for Livestock and Poultry Operations

Proceedings Home | W2W Home w2w17 logo

Purpose

The National Air Quality Site Assessment Tool (NAQSAT) was developed as a first-of-its-kind tool to help producers and their advisors assess the impact of management on air emissions from livestock and poultry operations and identify areas for potential improvement related to those air emissions.

What did we do?

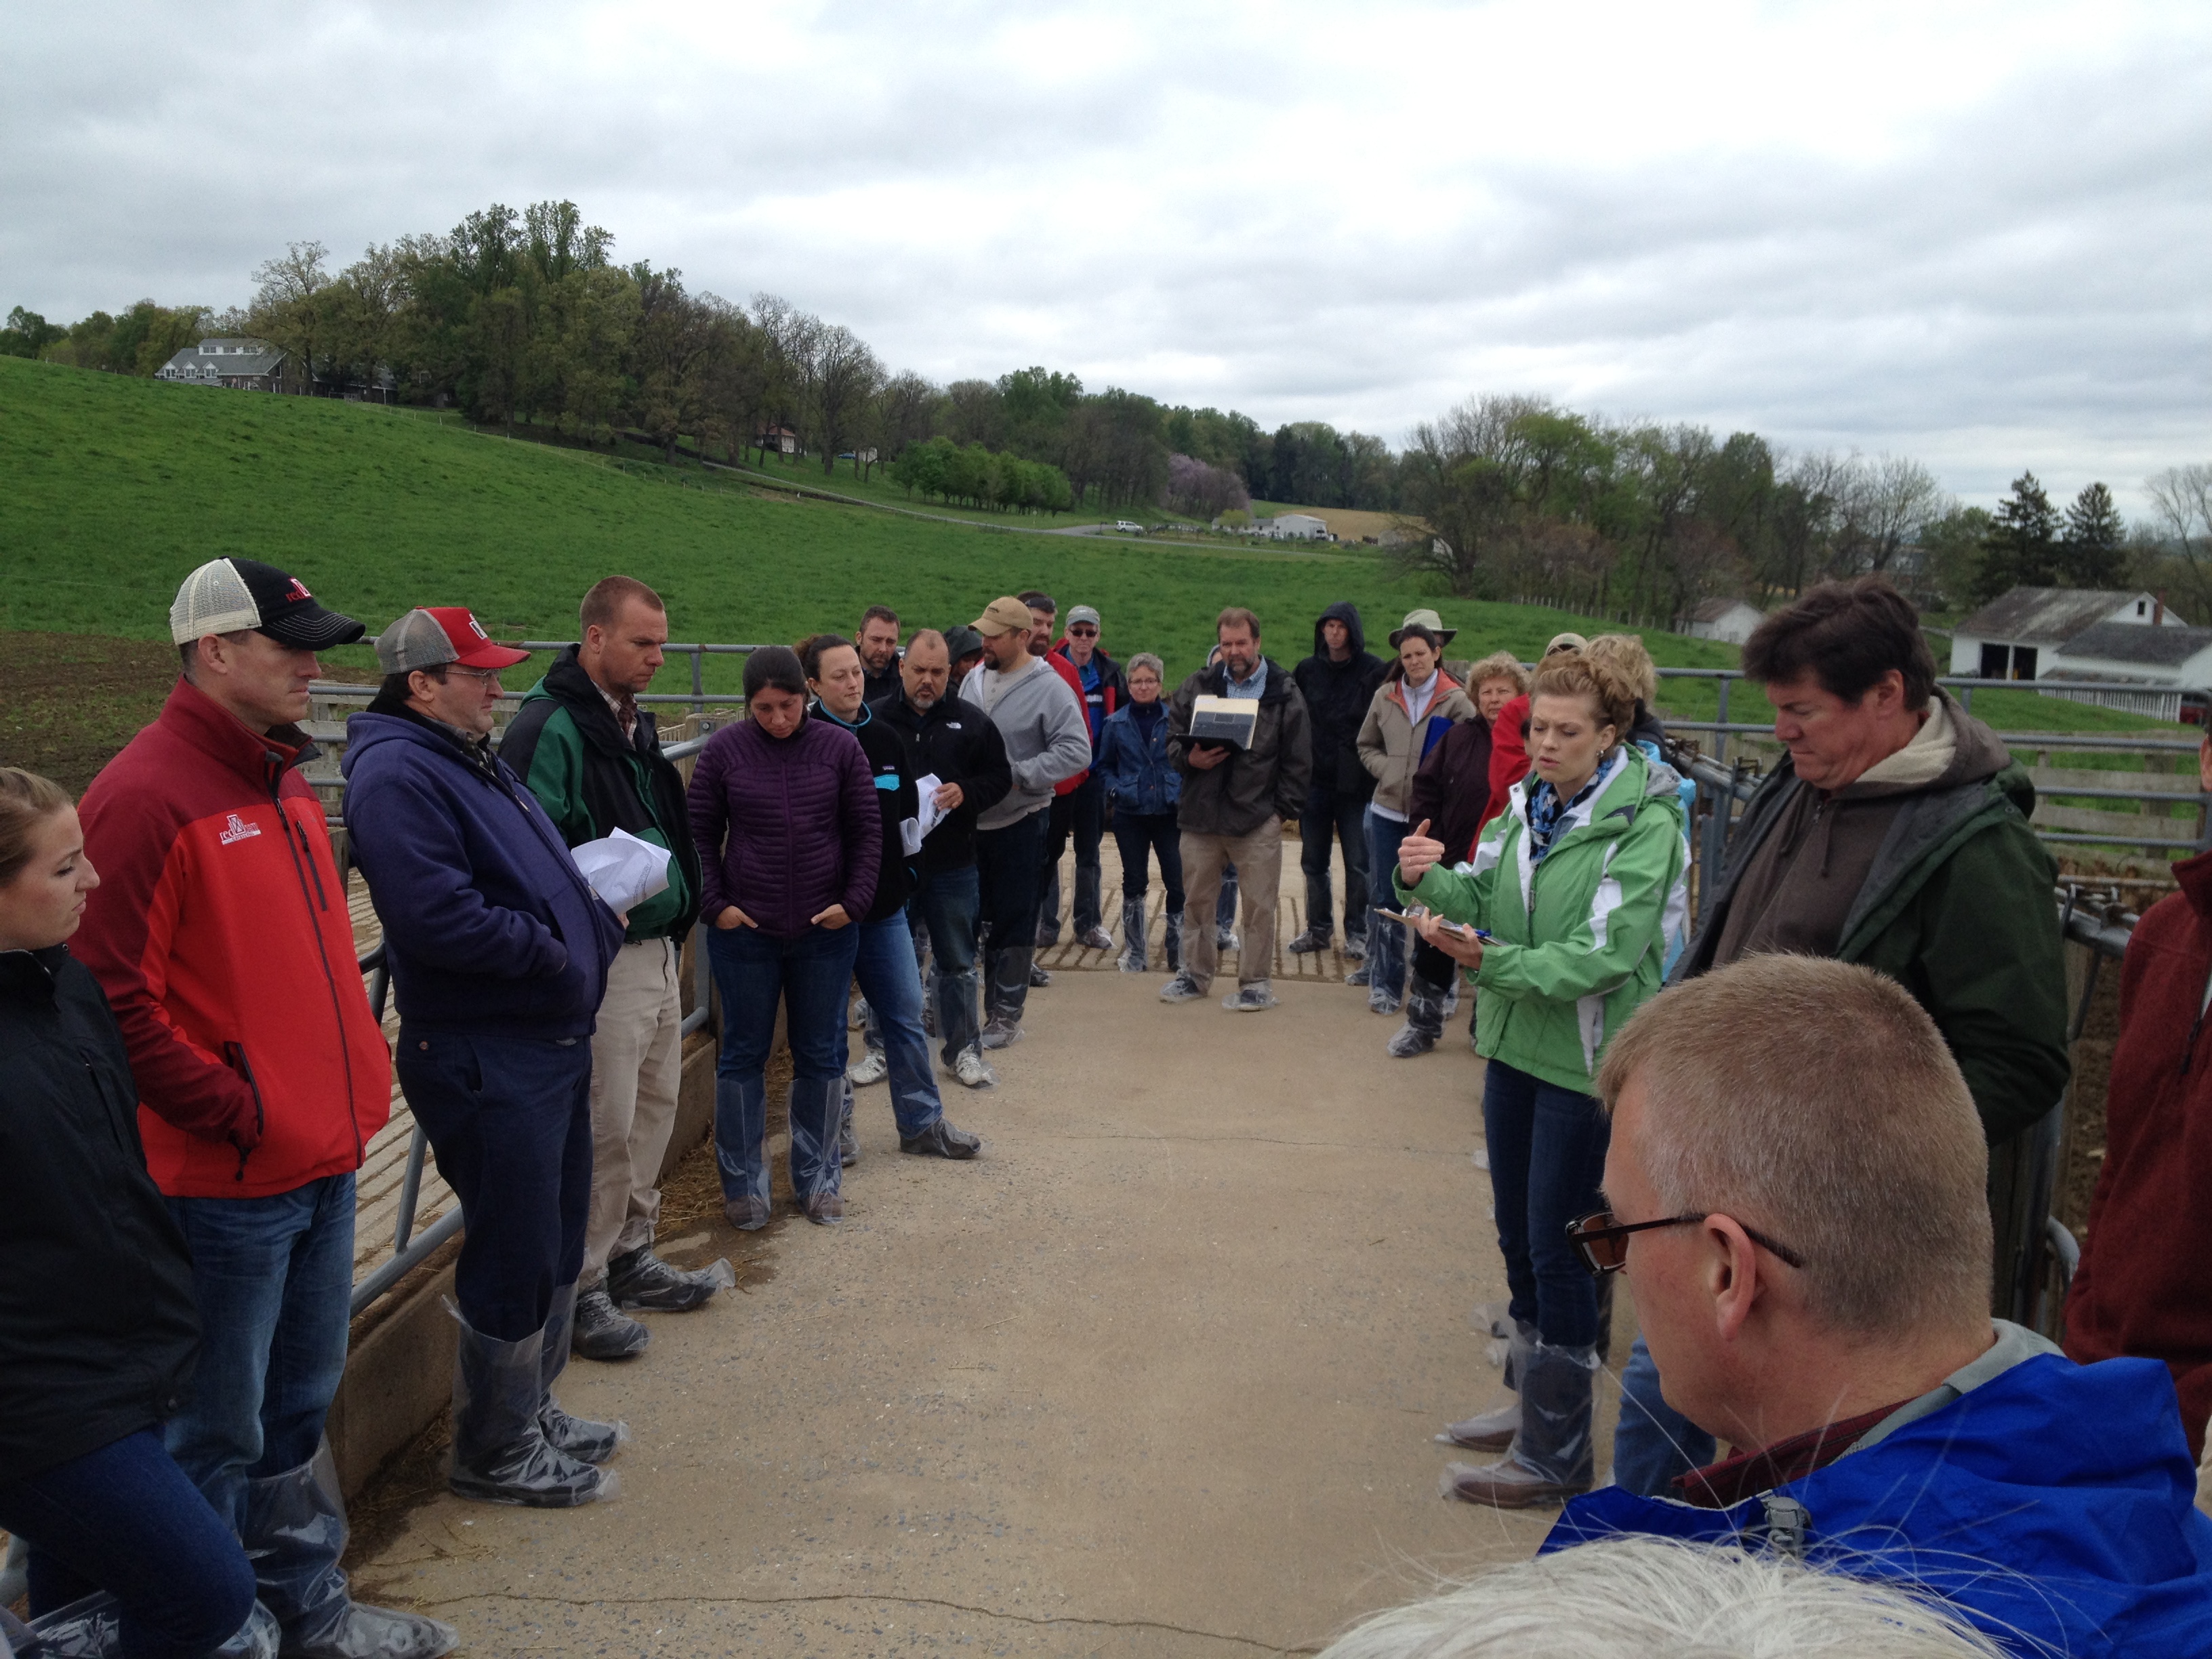
In 2007, several land-grant universities, with leadership from Michigan State University, began developing NAQSAT under a USDA-NRCS Conservation Innovation Grant (CIG). The initial tool included beef, dairy, swine, and poultry operations. A subsequent CIG project, with leadership from Colorado State University, made several enhancements to the tool, including adding horses to the species list. In 2015, USDA-NRCS officially adopted NAQSAT as an approved tool for evaluating air quality resource concerns at livestock and poultry operations. USDA-NRCS also contracted with Florida A&M University in 2015 to provide several regional training workshops on NAQSAT to NRCS employees. Six training workshops have been completed to date (Raleigh, NC; Modesto, CA; Elizabethtown, PA; Lincoln, NE; Richmond, VA; and Yakima, WA) with assistance from multiple NAQSAT development partners. Additionally, USDA-NRCS revised its comprehensive nutrient management plan (CNMP) policy in October 2015 to make the evaluation of air quality resource concerns mandatory as part of CNMP development.

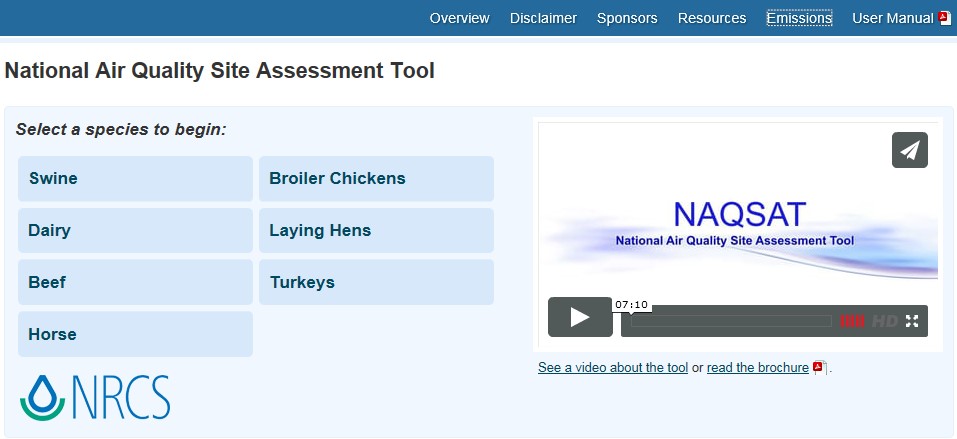
Snippet from website of the National Air Quality Site Assessment Tool

Group photo of team in field

Zwicke in class lecturing

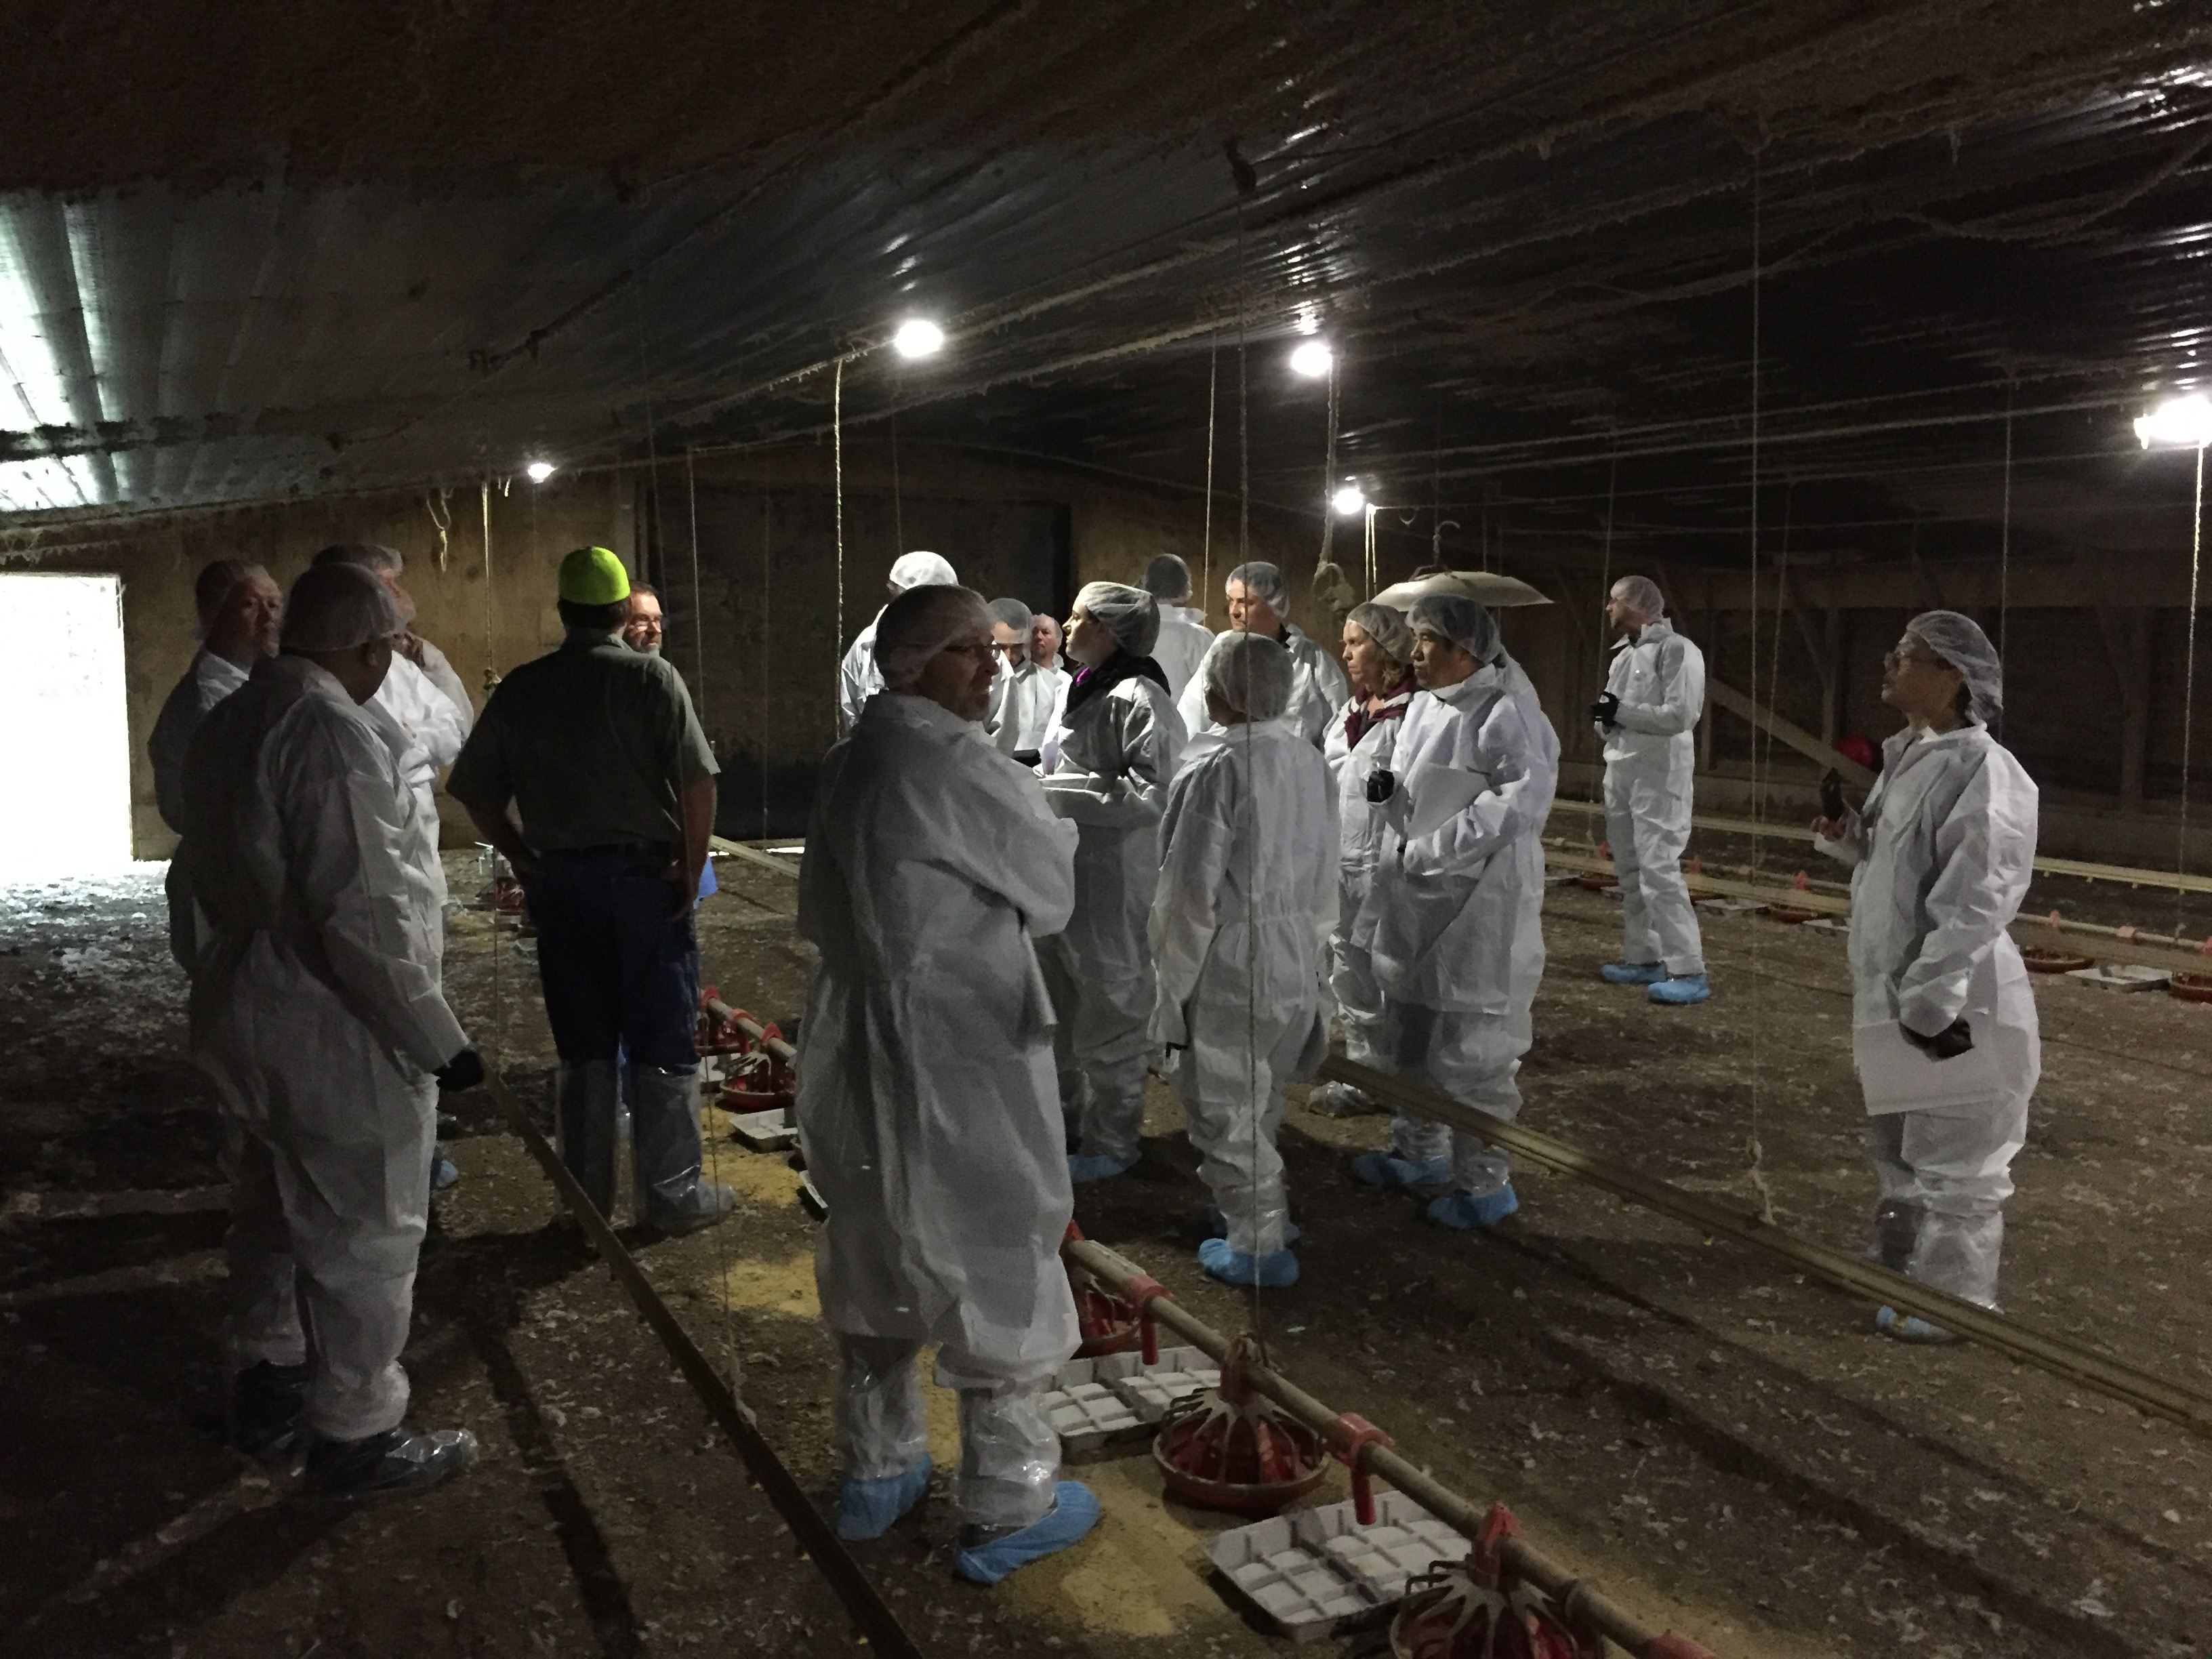
Zwicke and group in animal housing facility

What have we learned?

NAQSAT has proven to be a useful tool for bench-marking the air emissions impacts of current management on confinement-based livestock and poultry operations. In the training sessions, students have been able to complete NAQSAT runs on-site with the producer or producer representative via tablet or smartphone technologies. Further classroom discussion has helped to better understand the questions and answers and how the NAQSAT results can feed into the USDA-NRCS conservation planning process. Several needed enhancements and upgrades to the tool have been identified in order to more closely align the output of the tool to USDA-NRCS conservation planning needs. NAQSAT has also proven to be useful for evaluating the air quality resource concern status of an operation in relation to the CNMP development process.

Future Plans

It is anticipated that the identified needed enhancements and upgrades will be completed as funding for further NAQSAT development becomes available. Additionally, as use of NAQSAT by USDA-NRCS and our conservation planning and CNMP development partners expands, additional training and experience-building opportunities will be needed. The NAQSAT development team has great geographic coverage to assist in these additional opportunities.


Corresponding author, title, and affiliation

Greg Zwicke, Air Quality Engineer – Air Quality and Atmospheric Change Team, USDA-NRCS

Corresponding author email

greg.zwicke@ftc.usda.gov

Other authors

Greg Johnson, Air Quality and Atmospheric Change Team Leader, USDA-NRCS; Jeff Porter, Animal Nutrient and Manure Management Team Leader, USDA-NRCS; Sandy Means, Agricultural Engineer – Animal Nutrient and Manure Management Team, USDA-NRCS

Additional information

naqsat.tamu.edu

https://lpelc.org/naqsat-for-swine-and-poultry

https://lpelc.org/naqsat-for-beef-and-dairy/

Acknowledgements

C.E. Meadows Endowment, Michigan State University

Colorado Livestock Association

Colorado State University

Florida A&M University

Iowa Turkey Federation

Iowa Pork Producers

Iowa Pork Industry Center

Iowa State University

Iowa State University Experiment Station

Kansas State University

Michigan Milk Producers Association

Michigan Pork Producers Association

Michigan State University

Michigan State University Extension

National Pork Board

Nebraska Environmental Trust

Oregon State University

Penn State University

Purdue University

Texas A&M University

University of California, Davis

University of Georgia

University of Georgia Department of Poultry Science

University of Idaho

University of Maryland

University of Maryland Department of Animal and Avian Sciences

University of Minnesota

University of Missouri

University of Nebraska

USDA-ARS

Virginia Tech University

Washington State University

Western United Dairymen

Whatcom County (WA) Conservation District

The authors are solely responsible for the content of these proceedings. The technical information does not necessarily reflect the official position of the sponsoring agencies or institutions represented by planning committee members, and inclusion and distribution herein does not constitute an endorsement of views expressed by the same. Printed materials included herein are not refereed publications. Citations should appear as follows. EXAMPLE: Authors. 2017. Title of presentation. Waste to Worth: Spreading Science and Solutions. Cary, NC. April 18-21, 2017. URL of this page. Accessed on: today’s date.