
This webinar will examine how black soldier fly larvae (BSFL) can transform food and agricultural waste into valuable products for both animal feed and soil health. Presenters will discuss large-scale BSFL production, the frass co-product, and how nutrient content can vary based on inputs and processing. This presentation was originally broadcast on August 15, 2025. Continue reading “Flies, Frass, Feces, and Fields”
Using an interactive map exercise to help producers better manage their manure
Purpose
Time and time again, experience has taught us that many people learn by doing, not just from listening to presentations. The Nebraska Animal Manure Management Team has worked hard over the last six years to develop and expand what is now referred to as the Interactive Nutrient Management Decision-Making Exercise. This workshop will serve as a train-the-trainer event where attendees will:
-
- Discover how the exercise began and what it has grown to include
- Get familiar with the pieces and parts by helping set up the activity
- Experience a couple of the activities as participants
- Hear from others that have adapted the exercise and their experiences
- Brainstorm how the exercise can be used elsewhere or for other concepts
What Did We Do?
The Interactive Nutrient Management Decision-Making Exercise (mapping exercise) was developed by the Animal Manure Management Team at the University of Nebraska-Lincoln and University of Minnesota to engage participants during Manure Application Trainings. In Nebraska, these trainings previously relied heavily on PowerPoint and recorded presentations, but with many people being hands-on learners, an interactive exercise was proposed. In 2020, the original 6 activities were used for the afternoon portion, and it has since grown to the exercise it is today that is incorporated throughout the whole-day training.
It has been used not only for livestock producers but also crop producers. Parts of it have been modified to fit into workshops at conferences and, most recently, high school classrooms. Current expansion topics include spray drift to avoid sensitive areas and nitrogen management from all sources.
What Have We Learned?
Because many livestock producers in Nebraska are required to attend Land Application Training events every five years to maintain their Livestock Waste Control Facility permit, the winter 2024-2025 programming season for the Nebraska manure team offered an opportunity to ask participants how their operations have changed since the first time they had seen the Interactive Nutrient Management Decision-Making Exercise (in 2020). The team asked 3 questions specific to the exercise and changes on their operations and found the following results.
In general, participants are considering the topics taught during training more now than they were five years ago. The figure below indicates that 48% consider weather forecasts to decrease odor risk more or much more than they did prior to experiencing the Interactive Nutrient Management Decision-Making Exercise. Forty eight percent and 59% consider water quality and soil health impacts from manure more than five years ago, subsequently. While many participants already factored in transportation cost compared to nutrient value captured for a field, 59% reported that they consider it more or much more than they did, and 55% reported that they now considered the value of manure nutrients based on a field’s soil test more or much more.

We also asked participants to share with us how useful they felt the changes and expanded activities of the Interactive Nutrient Management Decision-Making Exercise were. All participants felt that the changes and expansion were useful with 52% indicating that they were very or extremely useful.

We also asked, “How do you expect your experience with the newer activities of the interactive nutrient management decision-making exercise will change your operation in the future?” and, among others, we received the following responses:
-
- “[we will] take more consideration to neighbors near application”
- “[we will make] better $ management decision[s] on manure application site[s]”
- “[the activity] makes us want to plan out better to get better results”
Future Plans
With so much success using this teaching tool, we would like to expand it to teach topics other than nutrient management. The Soil Health Nexus, a soil health workgroup in the north central region of the US, is in the process of developing an adaptation of this tool that will teach participants about the impacts of certain practices on soil health. Currently, progress has been made on activities focusing on tillage and the use of cover crops. Other planned activities include a focus on crop rotation and the use of the Soil Health Matrix, a tool developed by the Soil Health Nexus.
The Nebraska Animal Manure Management team, as part of a different grant, also has plans to create some activities focused on integrating livestock into cropping systems.
We also support using the base model of this exercise and adapting it for other practices and audiences outside of Nebraska.
Authors
Presenting & Corresponding author
Leslie Johnson, Animal Manure Management Extension Educator, University of Nebraska – Lincoln, leslie.johnson@unl.edu
Additional author
Amy Millmier Schmidt, Professor and Livestock Bioenvironmental Engineering Specialist, University of Nebraska-Lincoln;
Additional Information
Downloadable Curriculum: https://lpelc.org/interactive-nutrient-management-decision-making-exercise-curricula/
Acknowledgements
We would like to acknowledge all other contributors to the curriculum in the past including:
-
- Larry Howard, Rick Koelsch, Agnes Kurtzhals, Aaron Nygren, Agustin Olivio, Amber Patterson, Katie Pekarek, Amy Schmidt, Mike Sindelar, and Todd Whitney (University of Nebraska, Lincoln)
- Daryl Andersen, Tyler Benal, Will Brueggemann, Russ Oakland, and Bret Schomer (Lower Platte North NRD)
- Blythe McAfee and Tiffany O’Neill (Nebraska Department of Environment and Energy)
- Andy Scholting (Nutrient Advisors)
- Marie Krausnick, Dan Leininger (Upper Big Blue NRD)
- Chryseis Modderman (University of Minnesota)
- Nutrient Advisors
- Settje Agri Services Eng.
- Ward Laboratories Inc.
The authors are solely responsible for the content of these proceedings. The technical information does not necessarily reflect the official position of the sponsoring agencies or institutions represented by planning committee members, and inclusion and distribution herein does not constitute an endorsement of views expressed by the same. Printed materials included herein are not refereed publications. Citations should appear as follows. EXAMPLE: Authors. 2025. Title of presentation. Waste to Worth. Boise, ID. April 7-11, 2025. URL of this page. Accessed on: today’s date.
Evolution of material mixtures for leachate absorption during on-farm disposal of animal mortalities
Purpose
The safe and biosecure disposal of livestock mortalities is a vital concern for livestock producers and the environment. Traditional on-farm livestock disposal methods include composting and land burial, with burial posing environmental risks if leachate generated during carcass decomposition moves through the soil profile to reach groundwater. A 1995 study on the groundwater quality around six poultry mortality piles found elevated concentrations of ammonia and nitrate in the surrounding wells, demonstrating the risk of water contamination from carcass disposal (1). Moreover, the risk of disease transmission to nearby animal facilities associated with an outbreak and large mortality event, particularly due to a foreign animal disease outbreak, dictates that on-farm mortality disposal be conducted in a way that contains and eliminates pathogenic organisms. In the case of a large mortality event, landfills or rendering facilities may not have capacity to receive mortalities or they might refuse to accept them.
On-farm methods accepted in most states include land burial, composting, and incineration. While burial of mortalities often requires less labor and capital cost than composting or incineration, it comes with unique challenges, namely having sufficient space to bury large quantities of animals, adequate soil structure to contain leachate produced during decomposition, and sufficient depth to groundwater to avoid groundwater contamination. Composting is a valuable method as it can destroy many pathogens because of the heat produced in the process, and the by-product is useful. Some of its downsides include the nuisance odor produced and insects such as flies that often accompany the piles. Incineration, while highly effective at reducing volume of carcasses and disease-causing organisms, relies on access to a portable incinerator and sufficient fuel to operate it (2).
Shallow burial with carbon (SBC) is an emerging method for carcass disposal that combines the more common methods of composting and burial. With this method, a shallow pit is excavated in soil and 24 in of carbon material is placed in the trench prior to placing carcasses. The carcasses are then covered using the excavated soil. A field study comparing performance characteristics of SBC and composting for swine carcass disposal (3) found that SBC maintained thermophilic temperatures that met EPA 503(b) time-temperature standards (4), produced less leachate per unit mass of carcasses, and yielded lower contaminant loads (e.g. E. coli) than compost units, suggesting it may also be a suitable mortality disposal method during a foreign animal disease (FAD) outbreak. Further, SBC is a desirable mortality disposal option because it requires less carbon material than composting and does not require management beyond the establishment of the disposal site.
While the previous field study demonstrated lower leachate production from SBC than composting units, the potential may exist to further limit leachate production by identifying carbon materials with greater capacity to absorb liquid produced during carcass decomposition. The primary purpose of establishing a base of carbon material in SBC or composting disposal units is to absorb leachate released during decomposition, reducing the transport of contaminants to water sources. Therefore, this study explored absorbency of several organic materials for inclusion in SBC or mortality compost piles to reduce leachate losses.
What Did We Do?
Our team identified several alternative organic materials for pile construction including wood chips, silty clay loam soil, corn stover, recycled paper pulp (SpillTech(R) Loose Absorbent), and cellulose fiber (Pro Guard Cellulose Fiber). These were tested alone and in combination with 1% by mass (of base material) of sodium and potassium polyacrylate crystals, and 2-mm water gel beads (ZTML MS brand). Hydrogels (HG), sodium polyacrylate (SP), and potassium polyacrylate (PP) were demonstrated in previous studies to retain water in experimental greenhouses (5).
Five replicates of each treatment were enclosed in 4×6 inch cotton mesh bags (TamBee Disposable Tea Filter Bags, Amazon.com) and weighed prior to being submerged in deionized (DI) water at pH 7 for two hours (Figure 1). Bags were removed from the water and allowed to drain for 5 minutes before being weighed again. The bags were resubmerged for an additional 22 hours after which they were removed, allowed to drain for 5 minutes, and weighed again.

Five replicates of each combination of base material and absorbent additive were also evaluated using DI water adjusted to pH 3, 5, 7, 8, 10 and using 0.01M NaCl to evaluate the effect of pH on absorbency.
The swelling ratio (SR) of each treatment was calculated using the following formula:
SR = Ww – Wd
where Ww is the wet weight and Wd is the dry weight.
The expected water holding capacity (C) was calculated for each combination.
C = SR ⋅ D
Where C is measured in gallons of water per lb of treatment material and D is the density of base material.
The average of the SR value for the five replications of each combination was further used to determine economic feasibility for retaining leachate from a large-scale mortality compost or burial pile. This was done by first determining the average amount of leachate produced from the mortality piles during the preceding year-long field study in eastern Nebraska (6,030 gallons). This was considered the target volume of material held by an alternative material or combination of materials in the economic assessment.
The volume of leachate was converted to mass, and the swelling ratio average values were used to calculate the mass of base material needed to hold the target quantity of water. These values were then used to calculate the total cost (based on pricing from various sellers) to build a pile of each of these materials that would hold the target volume of leachate. Table 1 shows the price per pound of each material tested; the price of the wood chips, corn stover, and soil were estimated based on these sources, though true price will vary based on region and supplier.
Table 1. Costs of materials evaluated
| Material | $/lb | Source |
| Wood Chips | 0.05 | Evans Landscaping |
| Corn Stover | 0.02 | MSU Extension |
| Soil | 0.004 | Dirt Connections |
| Recycled Paper | 1.84 | Grainger |
| Cellulose Fiber | 7.00 | Pro Guard |
| Hydrogel | 15.09 | ZTML MS |
| Sodium Polyacrylate | 3.71 | Sandbaggy |
| Potassium Polyacrylate | 11.38 | A.M. Leonard |
What Have We Learned?
Results from an analysis of variance (ANOVA) of the SR data showed that SR was not significantly impacted by the soaking time or by pH of the soaking solution. The results also showed that only the addition of 1% SP had a significant effect among the three superabsorbent additives when compared to no additive in the same base material. This effect was relatively equal between all base materials. The other super absorbents (1% HG and 1% PP) did not have a significant effect due to the high variability in the results. The most meaningful differences in absorptive capacity were attributed to base material (Figure 2). On average, the swelling ratio of cellulose fiber (no additives, 24-hour soak, pH 7) is 0.577 gallons water/lb base material. For corn stover, this value is only slightly lower, at 0.447 gallons water/lb base material. Wood chips, the material used in compost piles in the preceding study, had much worse results at only 0.188 gallons water/lb base material.

The results of the economic analysis are included in Table 2. The corn stover (without super absorbents) emerged as the most cost-effective material, with an estimated $258 total cost of material required to absorb the average amount of leachate observed in a previous yearlong field study that evaluated leachate volume produced from six disposal piles, each containing 20 pigs with a mean weight of 5,826 lb (±90.8 lb). The next most economical option was soil alone ($392) and then corn stover with sodium polyacrylate added ($782).
Table 2. Material cost to retain a leachate volume of 6,030 gallons
| Material | Mass Required of Base Material (lb) | Cost |
| Woodchips | 36,425 | $ 1,655 |
| Woodchips + SP | 36,126 | $ 2,993 |
| Corn Stover | 14,202 | $ 258 |
| Corn Stover + SP | 14,060 | $ 782 |
| Cellulose Fiber | 10,442 | $73,085 |
| Cellulose Fiber + SP | 10,338 | $72,742 |
| Soil | 86,462 | $ 392 |
| Soil + SP | 85,597 | $ 3,596 |
| Recycled Paper | 27,289 | $50,256 |
| Recycled Paper + SP | 27,016 | $50,766 |
SP: sodium polyacrylate
Future Plans
To confirm the swelling ratios calculated in the lab are realistic, further testing of the effectiveness of the recommended base construction will be needed at field-scale. Additionally, analysis of evapotranspiration, rainfall, and temperature in the piles should be collected to build a working relationship of the leachate rates to important environmental conditions and provide insight into the variable water quantities that change with geographical location. Combining these measurements with climate information will form a better predictive model for broader applicability.
Authors
Presenting author
Alexis Samson, Undergraduate Researcher, Department of Biological Systems Engineering, University of Nebraska-Lincoln
Corresponding author
Amy Schmidt, Professor, Department of Biological Systems Engineering and Department of Animal Science, University of Nebraska-Lincoln, aschmidt@unl.edu
Additional authors
Mara Zelt, Research Technologist, University of Nebraska-Lincoln
Gustavo Castro Garcia, Graduate Research Assistant, University of Nebraska-Lincoln
Additional Information
-
- Ritter, W. F. & Chirnside A. E. M. (1995). Impact of Dead Bird Disposal Pits on Groundwater Quality on the Delmarva Peninsula, Bioresource Technology. https://www.researchgate.net/publication/256637308_Impact_of_dead_bird_disposal_pits_on_ground-water_quality_on_the_Delmarva_Peninsula.
- Costa, T. & Akdeniz, N. (2019). A review of the animal disease outbreaks and biosecure animal mortality composting systems, Waste Management. https://www.sciencedirect.com/science/article/pii/S0956053X19302600?via%3Dihub.
- Castro, G., Schmidt, A. (2023). Evaluation of Swine Cadaver Disposal through Composting and Shallow Burial with Carbon (poster presentation). ASABE AIM. Omaha, NE.
- Code of Federal Regulations, Chapter 40, Part 503. 1993. Standards for the Use or Disposal of Sewage Sludge. Appendix B. https://www.ecfr.gov/current/title-40/chapter-I/subchapter-O/part-503.
- Demitri, C., Scalera, F., Madaghiele, M., Sannino, A., & Maffezzoli, A. (2013). Potential of Cellulose-Based Superabsorbent Hydrogels as Water Reservoir in Agriculture, International Journal of Polymer Science. https://onlinelibrary.wiley.com/doi/10.1155/2013/435073?msockid=06caea3aa704636306b4f95fa67a62b8.
Acknowledgements
This project was partially supported by the National Pork Board Award #22-073. The technical assistance of Maddie Kopplin and Josh Mansfield was critical to the completion of this study.
The authors are solely responsible for the content of these proceedings. The technical information does not necessarily reflect the official position of the sponsoring agencies or institutions represented by planning committee members, and inclusion and distribution herein does not constitute an endorsement of views expressed by the same. Printed materials included herein are not refereed publications. Citations should appear as follows. EXAMPLE: Authors. 2025. Title of presentation. Waste to Worth. Boise, ID. April 7–11, 2025. URL of this page. Accessed on: today’s date.
Impacts on Soil Properties, E. Coli Prevalence, and Soybean Yield from Surface-Applied Swine Mortality Compost During a Single Growing Season in Eastern Nebraska
Purpose
Livestock producers dealing with animal mortalities may opt for composting as a biosecure on-farm carcass disposal method. The composting process accelerates the decomposition of animal remains, stabilizes nutrients, and, when executed correctly, subjects the carcasses to elevated temperatures capable of eliminating pathogens. Nevertheless, the use of compost derived from animal mortalities may introduce potentially harmful nutrients, heavy metals, pharmaceuticals, or pathogens to cropland when applied as a soil amendment (Sims and Kleinman, 2005).
At the same time, mortality compost represents a potential soil health amendment due to its high carbon content. With carbon being an important building block for organic matter in the soil, the soil will have improved structure and water-holding capacity if carbon content is elevated. There will also be increased microbial activity adding to the soil’s microbial diversity and nutrients present.
This study aimed to confirm these findings and to determine the balance of positive and negative impacts of mortality compost application in Eastern Nebraska by exploring key biological and chemical risk factors in soil receiving swine mortality compost over the course of one growing season.
What Did We Do?
This experiment was conducted at the University of Nebraska Rogers Memorial Farm, located 11 miles east of Lincoln, Nebraska. The study site was comprised of silty clay loam soil that had been cropped using a long-term no-till management system with controlled wheel traffic. Background soil and compost chemical results are portrayed in Table 1. Corn was grown during the previous season, and soybeans were grown during the period of this study. Eight plots (15’ x 15’) were established and randomly assigned to either a 20-ton/ac application of swine mortality compost or no application (control). The compost, made with swine mortalies and a bulking agent of wood chips, was applied to the surface one week after planting.
In-season sampling. Two weeks following treatment application, and every two weeks during the growing season thereafter, soil from each plot was collected from the top 0-4” of the soil profile by random core sampling using a 2 in diameter hand probe. A roughly 200 g composite sample of soil from each plot was used for subsequent analysis. Soil temperature was also recorded for each plot on sampling days at two random locations to depths of 2” and 4” at each location using a hand temperature probe.
Soil samples were assessed in the UNL Schmidt Laboratory in the Department of Biological Systems Engineering for moisture content by drying soil for 48 hours at 221°F, and for the mean weight diameter of wet-stable aggregates by wet-sieving for 10 min at a rate of 30 vertical oscillations per minute. Several biological properties of the soil were also examined, including E.coli prevalence, determined by the proportion of positive samples following enrichment of eight 1-g subsamples of soil in LB broth (Miller) for 8 h at 98.6°F followed by culturing on ChromAgar E.coli selective media for 24 h at 98.6°F. Microbial respiration was measured for two 20-g samples of air-dried soil per plot placed into a 33.8 fl oz glass jar containing a 0.5 fl oz vial of 0.5 M potassium hydroxide (KOH). The soil was re-wet with 0.24 fl oz of deionized water before jars were sealed and incubated at 77°F for 4 days, and the mass of CO2 released during the incubation was determined using the difference in electrical conductivity in the trap material. Finally, metabolic functional diversity was observed for the soil microbial populations by determining the oxidation rates of 31 different carbon substrates using Biolog® EcoPlates following a 48-hour incubation at 77°F of a 10-4 dilution of a 3 g soil sample. Soil microbes in the EcoPlate wells cause oxidation of the carbon species in the plates and results in a color change, which is measured by a microplate reader at 590 and 750 optical density (OD) units. The overall average color intensity, a measure of general population size and activity, as well as the proportional activity by metabolic type (amino acids, carbohydrates, carboxylic acids, polymers, and amines/amines), were considered as ecological soil health indicators in this study.
Harvest and post-harvest sampling. Grain yields were determined by hand harvesting a row length equal to 1/1000 ac from each plot. Soybeans were dried and weighed, and yield values were then converted to bu/ac using a standard 15% moisture content for the soybeans.
Following harvest, soil from each plot was retrieved according to the previously detailed methodology and sent to a commercial laboratory to determine end-of-season values for pH, sum of cations, soluble salts, calcium, organic matter (%), nitrate-N, phosphate (P2O5), potassium (K2O), sulfate, sodium, magnesium, zinc, iron, copper, manganese and heavy metals (arsenic, lead, and chromium) in the top 0-4” of the soil profile. Bulk density was also determined for two locations per plot at depths of 0-2″ and 2-4″.
Table 1. Initial chemical characteristics of compost and soil
| Chemical | Compost | Soil |
| pH | 7.1 | 6.6 |
| Soluble salts (mmho/cm) | 11.4 | 0.13 |
| Zinc, ppm | 57.6 | 1.12 |
| Iron, ppm | 1477 | 44.8 |
| Copper, ppm | 13.4 | 0.73 |
| Manganese, ppm | 100.6 | 9.2 |
| Arsenic, ppm | 1.807 | 5.971 |
| Lead, ppm | 2.09 | 14.46 |
| Chromium, ppm | 7.48 | 35.85 |
What Have We Learned?
The application of the compost treatment significantly increased the prevalence of E. coli in the soil samples, but only early (4 weeks) in the growing season (Figure 1). This is likely influenced by the compost’s organic matter and microbial diversity, which serve as a carbon source and support microbial population growth. However, as the season progressed, the difference in the prevalence of E.coli in soil that had or had not received compost application narrowed, potentially due to other factors impacting microbial survivability (such as temperature or moisture content) becoming dominant factors. Regression analysis comparing E.coli prevalence to soil moisture and temperature did not show a strong relationship (R-squared values of 0.48 and 0.18, respectively), which indicates that the microbial population is being impacted by other, more complex factors not included in this analysis.
No other soil biology, chemistry, or physical properties that we tested proved to be significantly impacted (a ≥ 0.05) by the application of mortality compost to the soil, nor was the soybean grain yield. This indicates that while the soil health impacts of this single-season compost application were negligible, there is also little risk to water quality associated with the application of 20 ton/ac swine mortality compost in crop production areas that are well-managed with soil conservation best practices.

Symbols next to values in week 4 denote a significant difference in the proportion of E.coli-positive samples. Error bars represent SEM (n=4).
Future Plans
The results suggest that there is little risk of prolonged elevated E. coli prevalence in soil when using swine mortality compost in row crop production areas. However, precipitation producing runoff may pose a risk to nearby surface water bodies if experienced within six weeks of compost application. Future research would be required to fully understand the risk of this occurring, but previous research conducted at the same farm determined that a 12.2 m (40 ft) setback of bare soil was sufficient to prevent most chemical and biological pollutants from leaving a field via runoff after receiving surface application of manure (Gilley et al., 2017). This is an encouraging and valuable guideline for producers who are generating compost as part of their operation and must find suitable sites for application.
The negligible soil health improvements from mortality compost application during this single-season study could dissuade crop producers from seeking out this material if it were available in their vicinity. However, where organic matter is needed to improve soil health over time, this product should not be discounted as a valuable soil carbon amendment. While we did not observe any positive soil health impacts from a single 20 ton/ac application of compost in this study, other studies have seen single season effects. Several other studies found significant impacts of applying a single season of organic amendment on soil microbial biomass (Lazcano, et al., 2012; Leytem, et al., 2024; Crecchio, et al., 2001) and on C:N ratio, which were not tested in this study. Thus, future research could explore alternative rates of application, frequency of sampling, or testing methodologies.
Another possible explanation for the lack of significant soil health impacts was that the field used in this study has been under long-term conservation (20+ years of no-till) practices. As a result, we suspect that the soil health improvement gap (e.g., the difference between soil health status and potential soil health status under ideal management) may be quite minimal. Soil sampled from our plots prior to treatment application revealed an average organic matter (OM) concentration of 3.8%, which exceeds the average 2 to 3% OM concentration for this soil type (Magdoff et al, 2021). However, other soil health factors such as bulk density, microbial population richness, and organic nutrient availability were in line with reports for similar soil types (Oregon State University Extension Service., 2019; Chau et al., 2011; University of Florida., 2015). This likely indicates that future applications of this sort should avoid fields with elevated soil organic matter, as they will not greatly benefit from the addition of organic amendments where soil carbon is already sufficient to the needs of the soil ecosystem.
Authors
Presenting author
Jillian Bailey; Undergraduate Researcher; Department of Biological Systems Engineering; University of Nebraska-Lincoln
Corresponding author
Amy Schmidt, Professor, Department of Biological Systems Engineering, University of Nebraska-Lincoln, aschmidt@unl.edu
Additional author
Mara Zelt, Research Technologist, Department of Biological Systems Engineering, University of Nebraska-Lincoln
Additional Information
Castro, G., Schmidt, A. (2023). Evaluation of Swine Cadaver Disposal through Composting and Shallow Burial with Carbon (poster presentation). ASABE AIM. Omaha, NE. https://publuu.com/flip-book/818714/1802503
Crecchio, C., Curci, M., Mininni, R., Ricciuti, P., & Ruggiero, P. (2001). Short-term effects of municipal solid waste compost amendments on soil carbon and nitrogen content, some enzyme activities and genetic diversity. Biology and Fertility of Soils, 34(5), 311–318. https://doi.org/10.1007/s003740100413
Gilley, J. E., Bartelt-Hunt, S. L., Eskridge, K. M., Li, X., Schmidt, A. M., & Snow, D. D. (2017). Setback distance requirements for removal of swine slurry constituents in runoff. Transactions of the ASABE, 60(6), 1885–1894. https://doi.org/10.13031/trans.12310
Lazcano, C., Gómez-Brandón, M., Revilla, P., & Domínguez, J. (2012). Short-term effects of organic and inorganic fertilizers on soil microbial community structure and function. Biology and Fertility of Soils, 49(6), 723–733. https://doi.org/10.1007/s00374-012-0761-7
Leytem, A.B., Dungan, R.S., Spiehs, M.J., Miller, D.N. (2024). Safe and sustainable use of bio-based fertilizers in agricultural production systems. In: Amon, B., editor. Developing Circular Agriculture Production Systems. 1st edition. Cambridge, UK: Burleigh Dodds Science Publishing. p. 179-214. https://doi.org/10.19103/AS.2023.0120.16
Magdoff, F., Es, Harold van. (2021) (2024, July 18). CH 3. Amount of organic matter in soils – SARE. USDA Sustainable Agriculture Research and Extension. https://www.sare.org/publications/building-soils-for-better-crops/amount-of-organic-matter-in-soils/
Oregon State University Extension Service, Horneck, D. A., Sullivan, D. M., Owen, J., & Hart, J. M. (2019). Soil Test Interpretation Guide. In EC 1478. https://extension.oregonstate.edu/sites/default/files/catalog/auto/EC1478.pdf
Sims, J. T., & Kleinman, P. J. A. (2005). Managing Agricultural Phosphorus for Environmental Protection. In J. T. Sims, & A. N. Sharpley (Eds.) Phosphorus: Agriculture and the Environment (Vol. 46, pp. 1021-1068). American Society of Agronomy. https://doi.org/10.2134/agronmonogr46.c31
University of Florida. (2015). Urban Design – Landscape plants – Edward F. Gilman – UF/IFAS. (n.d.-b). https://hort.ifas.ufl.edu/woody/critical-value.shtml
Acknowledgements
Funding for this study was provided by the Agricultural Research Division (ARD) of the University of Nebraska-Lincoln through an Undergraduate Student Research Program grant award. Much gratitude is extended to collaborating members of Rogers Memorial Farm, Stuart Hoff and Paul Jasa, and to the members of the Schmidt Lab – Alexis Samson, Logan Hafer, Maddie Kopplin, and Carol Calderon – for their assistance with sample collection and analysis.
The authors are solely responsible for the content of these proceedings. The technical information does not necessarily reflect the official position of the sponsoring agencies or institutions represented by planning committee members, and inclusion and distribution herein does not constitute an endorsement of views expressed by the same. Printed materials included herein are not refereed publications. Citations should appear as follows. EXAMPLE: Authors. 2025. Title of presentation. Waste to Worth. Boise, ID. April 7–11, 2025. URL of this page. Accessed on: today’s date.
Call for Abstracts for Waste-to-Worth 2025
You are invited to participate!
The Waste to Worth Conference will be April 7-11, 2025 at the Grove Hotel in Boise, Idaho.
Waste to Worth 2025 welcomes oral, poster, panel, and workshop presentation proposals focused on applied solutions related to animal manure management and protecting the environment.
-
- Submissions should align with one or more of the general areas of emphasis (see below).
- Graduate students are encouraged to submit and participate in a poster presentation competition.
To submit an abstract, go to https://tinyurl.com/W2W2025
For more information, go to: https://wastetoworth.org or the W2W Call for Abstracts flyer.
Deadline is October 30, 2024
Areas of Emphasis
-
- Circular Bioeconomy
- Biosecurity
- Feed & Nutrient Management
- Manure, Soil Health & Sustainability
- Emerging Contaminants
- Manure Storage, Treatment, Handling & Application Systems
- Robotics & Artificial Intelligence in Animal Production Systems
- Value-Added Products from Agricultural Production Systems
- Climate Impacts & Adaptation/Mitigation Measures
- Air Quality, Emissions & Fate
- Educational Programming & Delivery
- Environmental Planning & Regulations in Animal Agriculture
- Case Studies/On-Farm Experience
- Mortality Management
- Sustainable Animal Systems
- New & Innovative Technology
- Water Quality
Who attends?
-
- Extension agents & specialists
- Progressive farmers & producers
- NRCS staff
- Consultants & technical experts
- Regulatory & policy advisors
- Scientists
- Technology providers
Upcoming Models and Tools to Improve Manure Management
Responsible manure management uses multiple data types from a wide range of sources. This webinar highlights three new tools that aim to ease this burden while supporting effective decision-making. ManureDB aggregates U.S. manure analysis data and provides user-specified reports of manure characteristics. ManureTech synthesizes the environmental, economic and operational facets of manure treatment technologies. Manure Management Planner is a trusted tool but has also undergone recent updates for site-specific setback distances. Participants will be able to see these tools in action, and where further developments are headed. This presentation was originally broadcast on February 16, 2024. Continue reading “Upcoming Models and Tools to Improve Manure Management”
Overview of ODA’s Division of Livestock Environmental Permitting
Purpose
The purpose of this presentation is to provide a complete overview of ODA’s Division of Livestock Environmental Permitting (“ODA-DLEP”). ODA-DLEP regulates any livestock facility in Ohio that has the following number of animals or greater:
-
- 700 mature dairy cows
- 1,000 beef cattle or dairy heifers
- 2,500 swine weighing more than 55 pounds
- 10,000 swine weighing less than 55 pounds
- 82,000 layers
- 125,000 broilers or pullets
- 500 horses
- 55,000 turkeys
What Did We Do
Ohio Department of Agriculture’s Division of Livestock Environmental Permitting (“ODA-DLEP”) regulates the siting, construction, and operation of Ohio’s largest livestock facilities, referred to as Concentrated Animal Feeding Facilities (“CAFF”). ODA-DLEP’s primary objective is to minimize any water quality impacts, including both surface and ground waters, associated with the construction of new or expanding CAFFs, as well as implementation of best management practices once a CAFF becomes operational. These best management practices include management of manure, insect and rodent control, mortality management, and emergency response practices. ODA-DLEP issues Permits to Install (for construction) and Permits to Operate (for operations).
In addition, ODA-DLEP conducts routine inspections of each CAFF at least once a year, responds to complaints, and participates in emergency response. Inspections are conducted to review a CAFF’s compliance with Ohio Revised Code 903 and Ohio Administrative Code 901:10, the laws and regulations governing Concentrated Animal Feeding Facilities.
Finally, ODA-DLEP administers the Certified Livestock Manager program. Any individual in the State of Ohio that manages 4,500 dry tons of solid manure or 25 million gallons of liquid manure is required to be a Certified Livestock Manager (“CLM”).
What Have We Learned
Livestock operations continue to get larger and more concentrated and as a result, regulations are necessary to ensure proper handling and management of manure, particularly with land application of manure.
Future Plans
Over the past several years, DLEP has started to see more interest in manure treatment technologies. This could include, but is not limited to, anaerobic digestion, nutrient recovery, solids separation, and wastewater treatment. Technologies like this could greatly alter the landscape of the livestock industry by fundamentally changing the way manure is handled and how nutrients from manure are applied. DLEP does have regulations in place to account for manure treatment technologies. However, regulations, and specifically changes to regulations, cannot maintain the same pace as these technological advancements.
Authors
Samuel Mullins, Chief of ODA-Division Livestock Environmental Permitting
Samuel.mullins@agri.ohio.gov
Additional Information
https://agri.ohio.gov/divisions/livestock-environmental-permitting
https://codes.ohio.gov/ohio-administrative-code/901:10
https://codes.ohio.gov/ohio-revised-code/chapter-903
Videos, Slideshows and Other Media
ODA Division Spotlights – Division of Livestock Environmental Permitting 1
ODA Division Spotlights – Division of Livestock Environmental Permitting 2
The authors are solely responsible for the content of these proceedings. The technical information does not necessarily reflect the official position of the sponsoring agencies or institutions represented by planning committee members, and inclusion and distribution herein does not constitute an endorsement of views expressed by the same. Printed materials included herein are not refereed publications. Citations should appear as follows. EXAMPLE: Authors. 2022. Title of presentation. Waste to Worth. Oregon, OH. April 18-22, 2022. URL of this page. Accessed on: today’s date.
PFAS in Agricultural Operations
Even though we may not realize it, use of per- and polyfluoroalkyl substances (PFAS) are a part of our everyday lives. This webinar is centered around the potential impacts PFAS can have on agricultural production. This presentation was originally broadcast on February 19, 2021 in partnership with NRCS Conservation Webinar series. Continue reading “PFAS in Agricultural Operations”
Existing Data on Long Term Manure Storages, Opportunities to Assist Decision Makers
Long-term manure storages on dairy farms are temporary containment structures for byproducts of milk production. Manure, milkhouse wash, bedding, leachate, and runoff are stored until they can be utilized as fertilizer, bedding, irrigation, or energy. The practice of long-term storage creates stakeholders who collect data in their interactions with storages. This presents an opportunity to support data driven decision making on best use and operation of storages.
What Did We Do?
Prevalent stakeholders who collected data on storages were identified and the information they collected was examined. Data that could assist in depicting storage infrastructure was retained. Data not collected but of value to decision makers was noted. From this a combined data set was proposed that could depict the size, state, and impact of storage infrastructure. The feasibility of such a combined data set and opportunities from it were considered.
What Have We Learned?
General volume, general configuration, and year installed are most often collected by stakeholders while detailed configuration and detailed waste type are rarely collected. Cost is not collected. (Table 1) Stakeholders do not collect data on operations of all sizes. Most data is collected on large and medium operations while data is rarely collected on small operations. Stakeholders use their own definitions and classification structures.
| Table 1 Combined data to be collected to assist decision makers | ||
|---|---|---|
| Data | Specificity | Currently collected by |
| Location | County | State, NRCS, CNMP |
| City | STATE, CNMP | |
| Address | STATE, CNMP | |
| Lat, Long | NONE | |
| Storage Volume | Total | STATE, NRCS, CNMP |
| Operational | STATE, CNMP | |
| Geometric Dimensions | STATE, CNMP | |
| Above/Below Ground | STATE, NRCS, CNMP | |
| Year Built | Year Built | STATE, NRCS, CNMP |
| Year Inspected | STATE, CNMP | |
| Year Recertified | STATE, CNMP | |
| Year Upgraded | STATE, CNMP | |
| Configuration | Liner (Dug,Clay,Plastic,Concrete,Steel) | STATE, NRCS, CNMP |
| Certification(313,PE,ACI318,ACI350) | STATE, NRCS, CNMP | |
| Cover(none, rain, gas) | STATE, NRCS, CNMP | |
| Waste | Volume Produced | STATE, CNMP |
| Type(manure,washwater,leachate,runoff) | STATE, CNMP | |
| Manure Type(liquid, stack, pack, liquid sand, liquid recycled) | CNMP | |
| Advanced Treatment | CNMP | |
| Costs | Total | NONE |
| Per Component | NONE | |
| Operational | NONE | |
| *STATE-State of Michigan
*NRCS-United States Department of Agriculture Natural Resources Conservation Service |
||
| Table 2 First level characterization |
|---|
| Parameter |
| Number |
| Location |
| Age |
| Total Stored Capacity |
| Precipitation Stored Capacity |
| Waste Stored Capacity |
| Produced Waste Volume |
| Produced Waste Type |
| Produced Manure Volume |
| Produced Manure Type |
| Liner Type |
| Cover Type |
| Certification Type |
A first level characterization of storage infrastructure is proposed from Table 1, Table 2. Items in the first level characterization depict the location and condition of the storage infrastructure. Each of these items may be represented over a specific geographic area, such as state, watershed, or county. In a yearly inventory each of these items may be represented over time.
| Table 3 Second level characterization |
|---|
| Parameter |
| Length of Storage Estimate |
| Proximity to Sensitive Area Estimate |
| Storage Density |
| Seepage Estimate |
| Emissions Estimate |
Using Table 2 a second level characterization is proposed, Table 3. Items in the second level characterization estimate the capacity and impact of the state’s storage infrastructure. Supplementary information to estimate certain parameters is required. Each of these items may be represented over time and specific geographic area. Cost to implement and operate storage infrastructure are the third characterization, Table 4. Each of these items may be represented over time and specific geographic area.
| Table 4 Cost characterization |
|---|
| Parameter |
| Cost Estimate |
| Implement, Per Volume |
| Per Configuration |
| Operate, Per Volume |
| Per Configuration |
Combining and characterizing data from different stakeholders can provide a data-driven representation of storage infrastructure. Condition, capability, and impact of the storage infrastructure can be represented over time and geographic area. Monitoring, evaluating actions, forecasting issues, and targeting priority areas1 is made feasible. Example opportunities are as follows.
Long-term storage is desirable to enable storage of manure during winter months. Combined data can provide feedback on average days of storage in the state or watershed. The cost to achieve target days of storage may be estimated and the days of storage may be tracked over time as a result of funding efforts.
New York State released $50 million for water quality funding, which assisted in the implementation of new storages. In the implementation of these storages opportunity exits to collect cost data to inform future funding levels, quantify the increase in long-term storage provided as a result of the funding, and forecast when these storages are projected to reach the end of their lifecycle2.
As interest in cover and flare storages increase to offset livestock emissions combined data sets can assist in evaluating feasibility of such a proposal3 4 5. Potential emissions to be captured and cost to implement can be estimated.
Obstacles to collecting and combining data are cost, insufficiency, and misuse. As specificity in the data to be collected increases so does the cost to collect, combine, and maintain. Additionally, stakeholders have existing data collection infrastructure that must be modified at cost to allow combination. If the combined data set is not sufficiently populated by stakeholders is will depict an inaccurate representation of storage infrastructure. Finally, the risk of misuse and conflict amongst decision makers is present. Stakeholders may purposely or inadvertently use the inventory to reach erroneous conclusions.
Future Plans
Obstacles to implementation are not insignificant. Detailed analysis is required to determine the exact data to be collected, definitions to be agreed upon, and extent of coverage such that maximum benefit will be derived for decision makers.
Full benefit of storage data is increased by additional data sets such as state-wide livestock numbers, precipitation and temperature distributions, surface water locations, ground water levels, populations center locations, well locations, shallow bedrock locations, karst locations, complaint locations, and operator violations locations. The feasibility of obtaining these data sets should be determined.
The implementation and use of storages has additional stakeholders outside of those identified here. Additional stakeholders should be identified that can enhance or derive value from a combined data set on long term storages, such as manure applicators, handling and advanced treatment industry, extension services, zoning officials, professional engineers, environmental groups, and contractors.
Authors
Corresponding author
Michael Krcmarik, P.E., Area Engineer, United States Department of Agriculture Natural Resources Conservation Service, Flint, Michigan
Michael.Krcmarik@usda.gov
Other authors
Sue Reamer, Environmental Engineer, United States Department of Agriculture Natural Resources Conservation Service, East Lansing, Michigan
Additional Information
-
- “Conservation Effects Assessment Project (CEAP).” Ceap-Nrcs.opendata.arcgis.com, ceap-nrcs.opendata.arcgis.com/.
- $50 Million in Water Quality Funding Available for NY Livestock Farms.” Manure Manager, 27 Sept. 2017, www.manuremanager.com/state/$50-million-in-water-quality-funding-available-for-ny-livestock-farms-30286.
- Wright, Peter, and Curt Gooch. “ASABE Annual International Meeting.” Estimating the Economic Value of the Greenhouse Gas Reductions Associated with Dairy Manure Anaerobic Digestions Systems Located in New York State Treating Dairy Manure, July 16-19 2017.
- Wightman, J. L., and P. B. Woodbury. 2016. New York Dairy Manure Management Greenhouse Gas Emissions and Mitigation Costs (1992–2022). J. Environ. Qual. 45:266-275. doi:10.2134/jeq2014.06.0269
- Barnes, Greg. “Smithfield Announces Plans to Cover Hog Lagoons, Produce Renewable Energy.” North Carolina Health News, 28 Oct. 2018, www.northcarolinahealthnews.org/2018/10/29/smithfield-announces-plans-to-cover-hog-lagoons-produce-renewable-energy/.
- Michigan Agriculture Environmental Assurance Program. MAEAP Guidance Document For Comprehensive Nutrient Management Plans. 2015,www.maeap.org/uploads/files/Livestock/MAEAP_CNMP_Guidance_document_April_20_2015.pdf.
The authors are solely responsible for the content of these proceedings. The technical information does not necessarily reflect the official position of the sponsoring agencies or institutions represented by planning committee members, and inclusion and distribution herein does not constitute an endorsement of views expressed by the same. Printed materials included herein are not refereed publications. Citations should appear as follows. EXAMPLE: Authors. 2019. Title of presentation. Waste to Worth. Minneapolis, MN. April 22-26, 2019. URL of this page. Accessed on: today’s date.
Predicting Manure Nitrogen and Phosphorus Characteristics of Beef Open Lot Systems
This project involves the analysis of a new data set for manure characteristics from open lot beef systems demonstrating both average characteristics and factors contribution to variability in manure characteristics among these systems. Defining the characteristics and quantities of harvested manure and runoff from open earthen lot animal systems is critical to planning storage requirements, land requirements for nutrient utilization, land application rates, and logistical issues, such as equipment and labor requirements. Accuracy of these estimates are critical to planning processes required by federal and state permitting programs. Poor estimates can lead to discharges that result in court action and fines, neighbor nuisance complaints, and surface and ground water degradation. Planning procedures have historically relied upon standard values published by NRCS (Stettler et al., 2008), MWPS (Lorimor et al., 2000), and ASABE (2014) for average characteristics.
What Did We Do?
A large data set of analyses from manure samples collected over a 15-year period from 444 independent cattle feedlot pens at a single eastern Nebraska research facility was reviewed to provide insight to the degree of variability in observed manure characteristics and to investigate the factors influencing this variability. No previous efforts to define these characteristics have included data gathered over such a wide range of dietary strategies and weather conditions. This exclusive research data set is expected to provide new insights regarding influential factors affecting characteristics of manure and runoff harvested from open lot beef systems. The objective of this paper is to share a preliminary summary of findings based upon a review of this data set.
What Have We Learned?
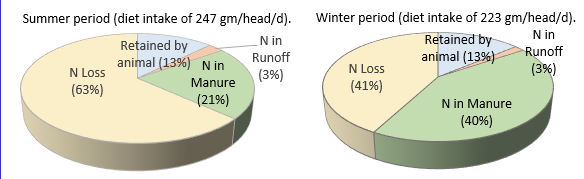
A review of this unique data set reveals several important preliminary observations. Standard values reported by ASABE and MWPS for beef manure characteristics in open lot systems are relatively poor indicators of the significant variability that is observed within open lot feeding systems. Our data set reveals significant differences between manure characteristics as a function of feeding period (Table 1) and substantial variability within feeding period, as illustrated by the large coefficients of variation for individual characteristics. Differences in winter and summer conditions influence the characteristics and quantities of solids, organic matter, and nutrients in the harvested manure. The timing of the feeding period has substantial influence on observed differences in nitrogen loss and nitrogen in manure (Figure 1). Nitrogen recovery for the warmer summer feeding periods averaged 51 and 6 grams/head/day in the manure and runoff, respectively, with losses estimated to be 155 grams/head/day. Similarly, nitrogen recovery in manure and runoff for the winter feeding period was 90 and 4 grams/head/day, respectively, with losses estimated at 92 grams/head/day (Figure 1 and Koelsch, et al., 2018). In addition, differences in weather and pen conditions during and following winter and summer feeding periods impact manure moisture content and the mixing of inorganics with manure (Table 1).
| Table 1. Characteristics of manure collected from 216 and 228 cattle feedlot pens during Summer and Winter feeding periods, respectively1. | ||||||||||
|---|---|---|---|---|---|---|---|---|---|---|
| University of Nebraska Feedlot in East Central Nebraska | Standard Values | |||||||||
| Summer | Winter | ASABE | NRCS | MWPS3 | ||||||
| Mean | CV2 | Mean | CV2 | Mean | Mean | |||||
| Total Manure (wet basis), kg/hd/d | 9.3 | 99% | 13.1 | 43% | 7.5 | 7.9 | ||||
| DM % | 71% | 10% | 63.2% | 15% | 67% | Collected | 55% | |||
| kg/hd/d | 5.4 | 80% | 8.0 | 41% | 5.0 | manure | 4.3 | |||
| OM % | 24% | 28% | 25.3% | 41% | 30% | is not | 50% | |||
| kg/hd/d | 1.00 | 52% | 1.87 | 41% | 1.5 | reported. | 2.2 | |||
| Ash % | 76% | 9% | 74.7% | 14% | 70% | 50% | ||||
| kg/hd/d | 4.16 | 72% | 6.10 | 49% | 3.5 | 2.2 | ||||
| N % | 1.3% | 36% | 1.19% | 23% | 1.18% | 1.2% | ||||
| g/hd/d | 51 | 50% | 90 | 33% | 88 | 95 | ||||
| P % | 0.37% | 41% | 0.34% | 29% | 0.50% | 0.35% | ||||
| k/hd/d | 17.7 | 55% | 26.0 | 42% | 37.5 | 27.7 | ||||
| DM = dry matter; OM = organic matter (or volatile solids)
1 Summer = April to October feeding period, Winter = November to May feeding period 2 Coefficient of variation, % 3 Unsurfaced lot in dry climate with annual manure removal. |
||||||||||
Dietary concentration of nutrients was observed to influence the harvested manure P content (Figure 2) but produce minimal impact on harvested manure N content (not shown). Diet was an important predictor in observed N losses, especially during the summer feeding period. However, its limited value for predicting harvested manure N and moderate value for predicting harvesting manure P suggests that other factors such as weather and management may be influential in determining N and P recovered (Koelsch, et al., 2018).

Significant variability exists in the quantity of total solids of manure harvested with a factor of 10 difference between the observed low and high values when compared on a mass per finished head basis (note large CVs in Table 1). This variability has significant influence on quality of the manure collected as represented by organic matter, ash content, and moisture content.
Although individual experimental trials comparing practices to increase organic matter on the feedlot surface have demonstrated some benefit to reducing nitrogen losses, the overall data set does not demonstrate value from higher pen surface organic matter for conservation of N in the manure (Koelsch, et al., 2018). However, higher organic matter manure is correlated to improved nitrogen concentration in the manure suggesting a higher value for the manure (Figure 3).

It is typically recommended that manure management planning should be based upon unique analysis for manure characteristics representative of the manure being applied. The large variability in harvested manure from open lot beef systems observed in this study further confirms the importance of this recommendation. The influence of weather on the manure and the management challenges of collecting manure from these systems adds to the complexity of predicting manure characteristics. In addition, standard reporting methods such as ASABE should consider reporting of separate standard values based upon time of the year feeding and/or manure collection period. This review of beef manure characteristics over a 15 year period further documents the challenge of planning based upon typical or standard value for open lot beef manure.
Future Plans
The compilation and analysis of the manure and runoff data from these 444 independent measure of feedlot manure characteristics is a part of an undergraduate student research experience. Final review and analysis of this data will be completed by summer 2019 with the data published at a later time. The authors will explore the value of this data for adjusting beef manure characteristics for ASABE’s Standard (ASABE, 2014).
References
ASABE. 2014. ASAE D384.2 MAR2005 (R2014): Manure Production and Characteristics. ASABE, St. Joseph, Ml. 32 pages.
Lorimor, J., W. Powers, and A. Sutton. 2000. Manure characteristics. Manure Management Systems Series MWPS-18. Midwest Plan Service. Ames Iowa: Iowa State University.
Stettler, D., C. Zuller, D. Hickman. 2008. Agricultural Waste Characteristics. Chapter 4 of Part 651, NRCS Agricultural Waste Management Field Handbook. pages 4-1 to 4-32.
Authors
Richard (Rick) Koelsch, Professor of Biological Systems Engineering and Animal Science, University of Nebraska-Lincoln
rkoelsch1@unl.edu
Megan Homolka, student, and Galen Erickson Professor of Animal Science, University of Nebraska-Lincoln
Additional Information
The authors are solely responsible for the content of these proceedings. The technical information does not necessarily reflect the official position of the sponsoring agencies or institutions represented by planning committee members, and inclusion and distribution herein does not constitute an endorsement of views expressed by the same. Printed materials included herein are not refereed publications. Citations should appear as follows. EXAMPLE: Authors. 2019. Title of presentation. Waste to Worth. Minneapolis, MN. April 22-26, 2019. URL of this page. Accessed on: today’s date.