
Strategies to Reduce the Crude Protein (Nitrogen) Intake of Dairy Cows for Economic and Environmental Goals

Contents


Introduction

This fact sheet has been developed to support the implementation of the Natural Resources Conservation Service Feed Management 592 Practice Standard. The Feed Management 592 Practice Standard was adopted by NRCS in 2003 as another tool to assist with addressing resource concerns on livestock and poultry operations. Feed management can assist with reducing the import of nutrients to the farm and reduce the excretion of nutrients in manure.

Of the nitrogen (N) fed to dairy cows, only 21 to 38% actually is exported as milk or meat. That means 62 to 79% of the N fed to cows is for the most part excreted via urine and feces of cows. Most N voided in urine is quickly emitted as ammonia whereas the percent of fecal N converted to ammonia is quite variable depending upon storage management and land application method. Because most N consumed in excess of requirement is excreted in urine, to improve efficiency of N use, urinary N needs to be reduced. Changes in diet formulation can improve efficiency of N use on dairies.

Please check this link first if you are interested in organic or specialty dairy production

Definitions

N = nitrogen; CP = crude protein = N X 6.25; NPN = nonprotein N; TDN = total digestible nutrients; RDP = ruminally degraded protein; LYS = lysine; MUN = milk urea N; MCP = microbial crude protein; RUP = ruminally undegraded protein; MET = methionine; FCM = fat-corrected milk; IOFC = income over feed costs

Historical Diet Formulations For Cows

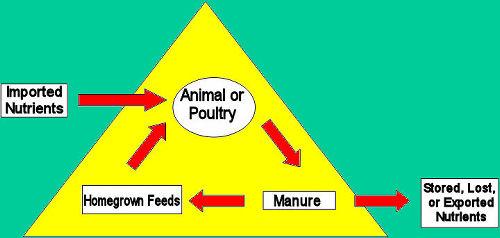
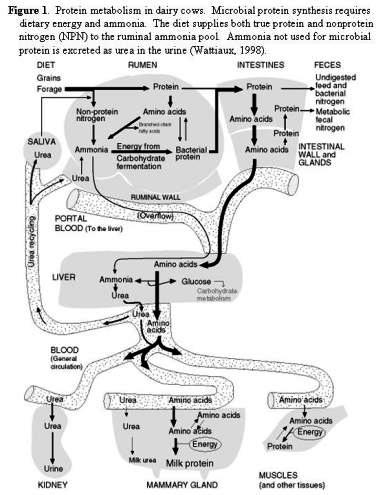
Protein nutrition of dairy cows has evolved over the decades. Initially, the approach was to determine the % or amount of dietary CP that cows needed for milk production. However, any CP consumed in excess of the cows’ requirements is excreted via urine. Thus, by feeding the cow to meet, and not exceed, her CP requirement, N excretion is reduced. The major weakness of formulating diets on a CP basis is that it ignores the type of CP consumed. For example, under this system all N in NPN sources (urea for example) is treated the same as the N in soybean meal, and clearly they are much different. The N in NPN does not include long chains of amino acids in the form of “true” protein whereas most of the N in soybean is amino-acid bound. Therefore, soybean meal contributes amino acids to both the ruminal micro-organisms and to intestinal amino acid absorption whereas NPN contributes only to the latter (Figure 1).

The goal of feeding protein to lactating cows is to support milk protein synthesis while meeting the needs for maintenance, growth and replacement of lost body protein. All proteins synthesized in the body have set amino acid patterns, so if a particular amino acid is lacking during protein synthesis, formation of that protein stops. Thus, we are not really trying to supply dietary protein to cows, we are trying to supply enough of each amino acid such that no single amino acid limits protein synthesis.

Another approach to improve upon balancing diets on a CP basis was the Burrough’s metabolizable protein system (Burroughs et al., 1975). This system considered the amount of dietary N that was solubilized in the rumen and could be used for microbial protein synthesis, a calculation that also involved the amount of TDN available to support microbial growth. To the calculated microbial protein was added the amount of dietary protein that escaped ruminal degradation. Use of ammonia and fermentable carbohydrate for microbial protein synthesis is illustrated in Figure 1. Finally, adjustment factors for digestibility and unavoidable fecal losses were applied to yield a Metabolizable Protein value. This system required knowing the amount of protein in feeds that was converted to ammonia in the rumen, the amount of feed protein that escaped ruminal breakdown, and the TDN value for the feeds. The concept was excellent but the system needed refinement.

The amount of dietary protein that is degraded in the rumen is primarily determined by characteristics of the N-containing compound (e.g., solubility and linkages) and how long it resides in the rumen (Figure 1). Residence time in the rumen, i.e. ruminal passage rate, is determined by total feed intake (the more the cow eats the faster the feed tends to move through the rumen), particle size and specific gravity (smaller, heavier particles move faster than large, light particles through the rumen), and other factors such as how quickly the microbes ferment the feed. Certain feeds are fermented faster than others (barley is fermented faster than sorghum), and feeds can be treated to reduce their rate of protein breakdown (most treatments involve lowering the protein solubility). Obviously the calculations to determine the amount of dietary protein that is degraded, or conversely undegraded, in the rumen get complicated, hence computer models tremendously speed the calculations.

Current approaches to meeting the amino acid needs of cows

First, we try to maximize microbial protein synthesis in the rumen. Microbial protein is high in LYS, and LYS is often the most limiting amino acid for milk production in feeding situations commonly found in the confined operations. Maximizing microbial protein synthesis involves supplying fermentable carbohydrates and soluble N sources to enable rapid bacterial growth. We need ammonia and other forms of soluble N to be available to the bacteria simultaneously with the fermentation of the carbohydrates so the bacteria have everything they need for growth, which includes protein synthesis (Figure 1). If the N is solubilized and degraded too quickly, much is absorbed as ammonia and subsequently excreted as urea N in urine or MUN. If too little N is solubilized in the rumen, the ammonia concentration in the ruminal fluid is too low to maximize microbial protein synthesis (Stokes et al., 1991; Clark et al., 1992). Generally, the amount of fermentable carbohydrate in the rumen is most limiting to microbial protein synthesis. Hence, the NRC (2001) predicts the yield of MCP as 0.13 x TDN (discounted), i.e., 130g MCP/kg of TDN (discounted) when RDP exceeds 1.18 x MCP yield. If the RDP intake is < 1.18 x TDN predicted MCP, then MCP is 0.85 of RDP intake. Thus, if a cow consumes 15 kg of TDN (discounted), MCP flowing to the intestine is estimated as: 15 x 0.13 = 1.95 kg.

Secondly, diets are formulated to supply amino acids for milk production by including dietary proteins that will not be completely degraded in the rumen and have a high content of the amino acids believed to be most limiting for milk production. Some feed proteins have relatively high LYS concentrations (porcine blood meal), some have relatively high MET concentrations (corn gluten meal), and some have a good balance of LYS and MET (fish meal). Thus, diets contain multiple proteins, all of which degrade at different rates in the rumen. In addition, the ruminal degradation rates for the 20 amino acids found in proteins vary substantially. Fortunately, all these data are contained in software programs so the estimated flow of feed amino acids into the small intestine is quickly calculated. Use of computer models allows us to take advantage of complementary protein and other N sources to achieve lower CP diets to achieve comparable milk yields.

Case I.

Using RDP/RUP feed data to achieve diets with a lower % CP.
Reynal and Broderick (2005) fed four diets that varied in RDP. Their diet description and results are given in Table 1. Urinary N excretion decreased about 60 g/cow/day as the % CP and % RDP decreased in the diet, however, the % milk protein also decreased. Their data suggest 11.7% RDP in ration DM as the best compromise between profitability and environmental quality.


Table 1. Effect of Percent Ruminal Degradable Protein on Dietary Components and Cow Responses
Dietary Treatments
A B C D
CP, % 18.8 18.3 17.7 17.2
RDP, % DM1 13.2 12.3 11.7 10.6
RDP, % of CP 70.2 67.2 66.1 61.6
RDP, % DM2 12.5 10.9 9.2 7.7
RUP, % DM1 5.8 6.2 6.0 6.6
RUP, % of CP 30.8 33.9 33.9 38.4
RUP, % DM2 6.3 7.4 8.5 9.5
NEL2, Mcal/lb DM 0.709 0.704 0.704 0.704
3.5% FCM, lb/d 93.1 94.2 93.3 91.3
Milk true protein, % 3.14a 3.14a 3.07b 3.04b
MUN, mg/dL 15.9a 15.6a 13.6b 12.8b
BUN, mg/dL 13.8a 14.0a 11.8b 12.4b
Ruminal NH3-N, mg/dL 12.33a 11.76a 8.68b 5.71c
Urinary N excretion, g/d 295a 293a 237b 239b
Fecal N excretion, g/d 222 220 219 197
N Efficiency
Milk N, % of N intake 29.6 29.5 30.4 30.4
lb of milk/lb of N excreted 84.5a 87.2a 94.3b 99.8b
1Measured in vivo.
2Predicted by NRC (2001) model.
abcMeans within the same row without a common superscript differ P < 0.05.


Case II.

Formulations using RUP/RDP and specific amino acids to reduce CP intake.
This concept applies RDP/RUP in predicting amino acid flows to the small intestinal tract, then adding specific amino acids to meet the cow’s requirements. The advantage is to reduce total N intake and hence, N excretion, while reducing total feed costs. Examples of using amino acid formulation to reduce CP and maintain milk yield are given below.

Example 1. VonKeyserlingk et al. (1999) formulated two diets for cows that were primarily in early lactation. The control diet was formulated according to the 1989 NRC recommendations. A second diet was formulated with the CNCPS system and included a commercial protein source and intestinally available MET source. Using a commercial protein source and “rumen by-pass” MET allowed the CP level in the grain mix to be reduced by 2.9% units and total TMR by 1% unit (Table 2).


Table 2. Diets formulated using NRC (1989) guidelines or CNCPS program.
Item NRC (1989) CNCPS
CP, % DM 18.7 17.7
ADF1, % DM 21.1 21.8
NEL, Mcal/lb 0.82 0.86
1Acid detergent fiber.

No difference was observed in DM intake or milk production between cows fed the diets formulated by the two methods (Table 3). The authors concluded that the CNCPS afforded the opportunity balance rations for reduced CP level without loss in milk production.


Table 3. Performance of dairy cows fed rations formulated by NRC (1989) guidelines or CNCPS formulation program.
Item NRC (1989) CNCPS
All cows
DMI, lb 47.4 46.6
Milk, lb 82.8 81.5
Multiparous Cows
Milk, lb 96.5 94.3
Milk fat, % 2.88 3.12
Milk protein, % 3.12 3.11
Primiparous Cows
Milk, lb 69.0 68.8
Milk fat, % 3.17 3.31
Milk protein, % 3.22 3.20

Example 2. Harrison et al. (2000) used the CPM (Cornell, Penn State, and Miner Institute) model to formulate two diets containing undegraded protein sources in the form of canola derivative or animal-marine blend. Each of these diets was estimated to be slightly deficient in LYS and MET. Two additional diets were formulated that were supplemented with a MET source and free LYS-HCl to improve the dietary supply of MET and LYS. The postpartum levels of MET and LYS in the non-supplemented diets were targeted to be at ~ 100% of the requirements (1.9% MET/MP and 6.4% LYS/MP) and 116% of MET (2.2% MET/MP) and 106% of LYS (6.6% LYS/MP) for supplemented diets. When formulating the diets, it was considered that 20 g of the commercial MET source provided 7 g of ruminal escape MET (Koenig et al.,1998) and 40 g of free LYS-HCl provided 8 g of ruminal escape LYS (Velle et al., 1998). Cows were fed the experimental diets from ~28 days before calving through week 17 postpartum. At 9 weeks post-partum, cows received rBST per label.

There tended to be increased yield of 3.5 FCM for cows fed the diet containing animal-marine bypass protein (Table 4). In early lactation, and at 14 to 17 weeks of lactation, there was an improvement in milk that appeared to be related to supplemental MET and LYS-HCl. In the early weeks of lactation (weeks 1 to 4) the MET supplemented cows fed the animal-marine blend protein source diet produced the most milk. After the beginning of rBST use (week 5), cows fed both un-supplemented diets (canola derivative and the animal-marine blend) produced more milk when supplemented with MET and LYS-HCl. A trend (P<0.14) was observed for increased milk fat percentage when the diets were supplemented with MET and LYS-HCl. These observations support the use of supplemental MET and LYS particularly during the critical need periods of early lactation and post rBST administration.


Table 4. Performance of cows fed diets containing supplemental sources of rumen undegraded amino acids.
P <
Item Treated canola protein Treated canola protein + Lys & Met Animal-marine blend protein Animal-marine blend protein + Lys & Met Pro-
tein
Suppl-
ement
Pro-
tein x Suppl
DMI, lb 48.2 48.0 48.8 47.7 NS NS NS
Milk, lb 85.4 85.6 87.1 87.3 NS NS NS
3.5 FCM, lb 86.9 87.6 89.3 91.1 0.08 NS NS
Milk fat, lb 3.08 3.12 3.19 3.28 0.03 NS NS
Milk fat, % 3.65 3.71 3.68 3.80 NS 0.14 NS
Milk protein, % 3.09 3.13 3.12 3.36 NS NS NS
Milk protein, lb 2.62 2.62 2.68 2.86 0.22 NS NS

Case III.

The importance of formulating for desired ratios of MET to LYS.
In another study (Harrison et al., 2003), researchers employed the CPM formulation model to reduce dietary CP from 18% to 16% by replacing alfalfa silage with corn silage and undegraded protein sources (Tables 5 & 6). Diet #3 was predicted to have the best ratio and supply of MET and LYS, and resulted in the highest milk yield, and ratio of milk true protein to diet protein (Table 7). The reduced milk yield of cows fed diet #2 emphasizes the need to ensure the ratio of LYS to MET is ~ 3.2 to 1. Total N import (as feed N) onto the dairy was reduced by nearly 9% and IOFC was increased 6.5% by diet #3.


Table 5. Chemical Analysis of Total Mixed Rations (% DM).
Item Diet 1 Diet 2 Diet 3 SE
CP 18.6 16.0 16.0 0.35
NDF1 38.9 41.2 44.7 1.88
Soluble CP 7.53 5.1 5.4 0.38
Soluble CP, % of CP 40.5 31.9 33.8
NFC2 31.9 34.4 30.7 2.16
1Neutral detergent fiber
2Nonfiber carbohydrate


Table 6. Diet Formulation Results from CPM
Item Diet 1 Diet 2 Diet 3
Lysine, % required 89 99 116
Methionine, % required 91 116 109
Ratio of Lys/Met 3.32 2.89 3.16
MP1 balance, g -477 -104 -117
1Metabolizable protein


Table 7. Response of cows to diets that differ in crude protein and ratio of lysine to methionine
Item Diet 1 Diet 2 Diet 3 SE P <
DMI, lb 44.9 45.1 45.1 2.97 NS
Milk, lb 78.8 77.9 82.5 5.10 NS
Milk Fat, % 3.80a 3.24b 3.79a 0.151 0.01
Milk Protein, % 3.08 3.08 3.07 0.071 NS
MUN, mg/dL 18.8a 13.0b 14.4b 0.92 0.01
CP Intake, lb/d 8.34 7.22 7.22
Milk True Protein/Feed CP 0.29 0.33 0.34
Reduction in CP imports, % 8.6 8.6
IOFC1, $/d/cow 5.49 4.64 5.85
1Income over feed costs


Case IV.

Impact of reduced dietary % CP on N excretion on a commercial dairy. A field study (Harrison et al., 2002) was conducted with a high producing herd to compare the general herd diet formulated at ~18% CP to a diet that was reformulated at ~17% (Table 8). Milk production was maintained while N imports to the farm (Tables 9 & 10) were decreased. In addition, the reformulated diet increased IOFC (Table 11). These results agree with those of Wattiaux and Karg (2004) who reported a 16% drop in urinary N when a diet with 18% CP was reformulated to 16.5% CP.


Table 8. Chemical compositions of a control diet and a reformulated diet containing supplemental amino acids.
Item Control Reformulated
CP, % DM 17.8 17.0
Soluble Protein, % DM 6.4 6.0
Soluble Protein, % CP 35.7 37.0
NDF<suo>1</sup>, % DM 32.4 32.7
NFC2, % DM 39.0 39.8
1Neutral detergent fiber
2Nonfiber carbohydrate


Table 9. Treatment response to a diet reformulated on the basis of metabolizable methionine and lysine.
Item Control Reformulated SE P <
DMI, lb 56.7 55.2
CP Intake, lb 10.1 9.4
Milk, lb 99.9 101.9 0.53 0.007
3.5 FCM, lb 96.0 96.6 0.46 0.32
Milk fat, % 3.28 3.21 0.014 0.001
Milk protein, % 2.90 2.93 0.006 0.0009
MUN, mg/dL 17.5 14.5
Milk True Protein: Intake Protein Ratio 0.285 0.316


Table 10. Effect on nitrogen excretion when a diet was reformulated on the basis of metabolizable lysine and methionine
Item Control Reformulated % Change
N intake, g/d 734 680 -7.4
Milk total N, g/d1 240 246 +2.5
Predicted Urinary N, g/d2 289 239 -17.3
Calculated Fecal N, g/d3 205 195 -5.0
1(Milk True Protein/6.38) X 1.17
2Urinary N (g/d) = 0.026 x BW (kg) X MUN (mg/dL); J Dairy Sci. 85:227-233.
3Fecal N = Intake N – Milk N – Urine N


Table 11. Economic impact of reformulating a diet on the basis of metabolizable lysine and methionine
Item Control Reformulated
Feed Costs, $/d/cow 4.82 4.88
Milk Income, $/d/cow 11.92 12.10
IOFC1, $/d/cow 7.10 7.22
1IOFC = Income over feed costs


Summary

Reducing CP intake of high-producing cows can be achieved by strategic use of undegraded protein sources and amino acids (LYS and MET) under a variety of diet conditions. Diet reformulations can reduce N excretions by ~10% without negatively affecting milk yield or IOFC. These successes require the use of ration balancing software that estimate the amino acid (MET and LYS especially) needs of the lactating cow. Use of undegraded protein sources that have dependable concentrations of amino acids is critical to achieve consistent production responses.
 

RUP Fig 1.jpg


Selected References

Burroughs, W., D.K. Nelson, and D.R. Mertens. 1975. Evaluation of protein nutrition by metabolizable protein and urea fermentation potential. J. Dairy Sci. 58:611-619.

Clark, J.H., T.H. Klusmeyer, and M.R. Cameron. 1992. Symposium: Nitrogen metabolism and amino acid nutrition in dairy cattle: Microbial protein synthesis and flows of nitrogen fractions to the duodenum of dairy cows. J. Dairy Sci. 75:2304-2323.

Harrison, J.H., D. Davidson, L. Johnson, M.L. Swift, M. VonKeyserlingk, M. Vazquez-Anon, and W. Chalupa. 2000. Effect of source of bypass protein and supplemental Alimet and lysine-HCl on lactation performance. J. Dairy Sci. 83(suppl 1):268.

Harrison, J.H., D. Davidson, J. Werkhoven, A. Werkhoven, S. Werkhoven, M. Vazquez-Anon, G. Winter, N. Barney, and W. Chalupa. 2002. Effectiveness of strategic ration balancing on efficiency of milk protein production and environmental impact. J. Dairy Sci. 85(suppl.1):205.

Harrison, J.H., R.L. Kincaid, W. Schager, L. Johnson, D. Davidson, L.D. Bunting, and W. Chalupa. 2003. Strategic ration balancing by supplementing lysine, methionine, and Prolak on efficiency of milk protein production and potential environmental impact. J. Dairy Sci. 86(Suppl 1):60.

Koenig, K.M., L.M. Rode, C.D. Knight, and P.R. McCullough. 1999. Ruminal escape, gastrointestinal absorption, and response of serum methionine to supplementation of liquid methionine hydroxyl analog in dairy cows. J. Dairy Sci. 82:355.

NRC. 1989. National Research Council. Nutrient Requirements of Dairy Cattle. Vol. 6th rev. ed. Natl. Acad. Sci., Washington, DC.

NRC. 2001. National Research Council. Nutrient Requirements of Dairy Cattle. Vol. 7th rev. ed. Natl. Acad. Sci., Washington, DC.

Reynal, S.M. and G.A. Broderick. 2005. Effect of dietary level of rumen-degraded protein on production and nitrogen metabolism in lactating dairy cows. J. Dairy Sci. 88:4045-4064.

Stokes, S.R., W.H. Hoover, T.K. Miller, and R. Blauweikel. 1991. Ruminal digestion and microbial utilization of diets varying in type of carbohydrate and protein. J. Dairy Sci. 74:871-881.

Tamminga, S. 1992. Nutrition management of dairy cows as a contribution to pollution control. J. Dairy Sci. 75:345-357.

Velle W., T.I. Kanui, A. Aulie, and O.C. Sjaastad. 1998. Ruminal escape and apparent degradation of amino acids administered intraruminally in mixtures to cows. J. Dairy Sci. 81:3231-3238.

VonKeyserlingk, M.A.G., M.L. Swift, and J.A. Shelford. 1999. Use of the Cornell Net Carbohydrate and Protein System and rumen-protected methionine to maintain milk production in cows receiving reduced protein diets. Can. J. Anim. Sci. 79:397-400.

Wattiaux, M. A. 1998. Protein metabolism in dairy cows. In: Technical Dairy Guide—Nutrition, 2nd edition. The Babcock Institute for International Dairy Research and Development. The University of Wisconsin.

Wattiaux, M.A and K.L. Karg. 2004. Protein level for alfalfa and corn silage-based diets: II. Nitrogen balance and manure characteristics. J. Dairy Sci. 87:3492-3502.

“Extension programs and policies are consistent with federal and state laws and regulations on nondiscrimination regarding race, sex, religion, age, color, creed, national or ethnic origin; physical, mental or sensory disability; marital status, sexual orientation, or status as a Vietnam-era or disabled veteran. Evidence of noncompliance may be reported through your local Extension office.”


Disclaimer

This fact sheet reflects the best available information on the topic as of the publication date. Date 6-20-2006

This Feed Management Education Project was funded by the USDA NRCS CIG program. Additional information can be found at Feed Management Publications.
Image:Feed mgt logo4.JPG

This project is affiliated with the Livestock and Poultry Environmental Learning Center.

Image:usda,nrcs,feed_mgt_logo.JPG

Project Information

Detailed information about training and certification in Feed Management can be obtained from Joe Harrison, Project Leader, jhharrison@wsu.edu, or Becca White, Project Manager, rawhite@wsu.edu.

Author Information

R. L. Kincaid rkincaid@wsu.edu
J. H. Harrison
R. A. White
Washington State University

Reviewer Information

Floyd Hoisington – Consulting Nutritionist

Michael Wattiaux – University of Wisconsin

Partners

Image:Logos2.JPG

Evaluating Corn Silage Quality for Dairy Cattle

Printer friendly version

Contents


Introduction

This fact sheet has been developed to support the implementation of the Natural Resources Conservation Service Feed Management 592 Practice Standard. The Feed Management 592 Practice Standard was adopted by NRCS in 2003 as another tool to assist with addressing resource concerns on livestock and poultry operations. Feed management can assist with reducing the import of nutrients to the farm and reduce the excretion of nutrients in manure.

The Natural Resources Conservation Service has adopted a practice standard called Feed Management (592) and is defined as “managing the quantity of available nutrients fed to livestock and poultry for their intended purpose”. The national version of the practice standard can be found in a companion fact sheet entitled “An Introduction to Natural Resources Feed Management Practice Standard 592”. Please check in your own state for a state-specific version of the standard.

An index of forage quality, milk per ton of forage DM (Undersander et al., 1993), was developed using an energy value of forage predicted from ADF content and DMI potential of forage predicted from NDF content as its basis. The milk per ton quality index was later modified for corn silage (Schwab et al., 2003) using an energy value derived from summative equations (Schwab et al., 2003; NRC, 2001) and DMI predicted from both NDF content (Mertens, 1987) and in vitro NDF digestibility (IVNDFD, % of NDF; Oba and Allen, 1999b) as its basis. This milk per ton quality index (MILK2000; Schwab et al., 2003) has become a focal point for corn silage hybrid-performance trials and hybrid-breeding programs in academia and the seed-corn industry (Lauer et al., 2005). An update, MILK2006, will be discussed herein.

Please check this link first if you are interested in organic or specialty dairy production

Model NEL-3x and DMI

We (Schwab et al., 2003) modified the NRC (2001) TDNmaintenance summative energy equation for corn silage to include starch and non-starch NF C components with a variable predicted starch digestibility coefficient, and a direct laboratory measure of the NDF digestibility coefficient rather
energy value was derived from TDNmaintenance using the NRC (1989) empirical equation in MILK2000 (Schwab et al., 2003). In MILK2006, the NEL-3x energy value is derived using an adaptation of the TDN-DE-ME-NE conversion equations provided in NRC (2001).

Neutral detergent fiber content and IVNDFD are used to predict DMI (Schwab et al., 2003) in both MILK2000 and MILK2006. However, a one %-unit change in IVNDFD (% of NDF) from lab-average IVNDFD changes DMI 0.26 lb. per day (Oba and Allen, 2005; Jung et al., 2004) in MILK2006 versus the 0.37 lb. per day value (Oba and Allen, 1999b) that was used in MILK20

In MILK2000, variation in IVNDFD impacts NEL intake through effects on both NEL-3x content and DMI (Schwab et al., 2003). However, Tine et al. (2001) and Oba and Allen (1999a) reported that at production levels of intake, IVNDFD has minimal impact on NEL-3x content but impacts NEL intake primarily through effects on DMI. In MILK2006, the IVNDFD value used for calculating NEL-3x is adjusted for differences in DMI predicted from IVNDFD using an equation adapted from Oba and Allen (1999a). Thus, IVNDFD impacts NEL intake and hence the milk per ton quality index mainly through its impact on predicted DMI in MILK2006.

Non-fiber Carbohydrates and Their Digestibility

Dairy cattle nutritionists have long used non-fiber carbohydrate (NFC) as a quasi-nutrient rather than starch specifically. However, NFC is a calculated value (100-NDF-CP+NDFCP-Fat-Ash; NRC, 2001) comprised of varying proportions of starch, sugar, soluble fiber, and organic acids, and is subject to errors associated with analyzing the five nutrients used to calculate NFC. Although the NRC 2001 summative energy equation was based on NFC, starch rather than NFC is being used in summative energy equations (Schwab et al., 2003) by many commercial feed testing laboratories especially for corn silage which they have long been analyzing for starch content and have developed NIRS calibrations for starch determination. However, determining digestion coefficients for starch to use in summative energy equations has been difficult. The NRC 2001 model uses an NFC true digestibility coefficient of 98% and arbitrary processing adjustment factors. The MILK2000 model uses a non-starch NFC (NFC minus starch) true digestibility coefficient of 98% (NRC, 2001) and varies the starch true digestibility coefficient from a minimum of 76% (Firkins et al., 2001) to a maximum of 98% (NRC, 2001) using whole-plant DM and kernel processing as regression equation variables to predict apparent total tract starch digestibility (Schwab et al., 2003). Both approaches though are limited in their ability for detecting potential variation in starch digestibility across a wide array of samples, and novel lab assays are needed.

Starch, supplied in Midwestern and Northeastern diets primarily from dry or high-moisture corn grain and whole-plant corn silage, is an important source of energy for dairy cattle. However, the digestibility of corn starch can be highly variable (Nocek and Tamminga, 1991; Orskov, 1986; Owens et al., 1986; Rooney and Pflugfelder, 1986; Theuer, 1986). Various factors, particle size (fine vs. coarse grind), grain processing (steam flaked vs. dry rolled), storage method (dry vs. high-moisture corn), moisture content of high-moisture corn, type of corn endosperm, and corn silage maturity at harvest, chop length, and kernel processing, influence starch digestibility in lactating dairy cows. Because both physical and chemical properties of starch influence starch digestion, assessment of starch digestibility in the laboratory has been challenging.

In an attempt to address variation in starch digestibility, NRC (2001) suggested empirical processing adjustment factors (PAF) to adjust NFC digestion coefficients for high-starch feeds. However, since no system to measure variation in PAF for feedstuffs is available the PAF’s are subjective book values with minimal practical utility. For corn silage, U.S. Dairy Forage Research Center workers developed a kernel processing score (KPS; Ferreira and Mertens, 2005; Mertens, 2005) to assess adequacy of kernel processing in corn silage. But, the relationship between KPS values and in vivo starch digestibility measurements is not well defined. Ruminal in-vitro or in-situ degradation, either alone or in combination with in vitro post-ruminal enzymatic digestion of the ruminal residues, have been explored by some groups (Sapienza, 2002). Some commercial laboratories are attempting to employ in situ or in vitro systems to evaluate starch digestibility, but to date methods are highly variable between laboratories. Regardless of the method it is doubtful that samples can be fine ground as fine grinding of samples may mask differences among samples (Doggett et al., 1998). Relationships between in situ/in vitro measurements and in vivo starch digestibility are often not well defined. We recently developed an enzymatic lab assay, Degree of Starch Access (DSA), which is sensitive to differences in particle size, moisture content, and vitreousness of corn-based feeds (Blasel et al., 2006).

The DSA assay was found to be quite sensitive (Blasel et al., 2006) to particle size (R2 = 0.99) and moderately sensitive to DM content (R2 = 0.76) and endosperm type (R2 = 0.59), which are three primary factors that influence starch digestibility in corn grain. However, The DSA assay is a laboratory starch recovery procedure that does not result in a direct estimate of starch digestibility and only reveals differences in starch recoveries. For example, the DSA procedure would recover 95 percent of the starch in finely ground corn but only 5 percent of the starch in whole shelled corn. Thus, the DSA values provide an index of the variation in degree of starch access among feeds. We (Shaver and Hoffman, 2006) reviewed eight trials in the scientific literature (Taylor and Allen, 2005a; Remond et al., 2004; Oba and Allen, 2003; Crocker et al., 1998; Knowlton et al., 1998; Yu et al., 1998; Joy et al., 1997; Knowlton et al., 1996) with lactating dairy cows that reported total tract starch digestibility and particle size, moisture content, and endosperm type of the corns tested. From these data, we estimated their DSA values and evaluated the relationship between DSA and their measures of total tract starch digestibility. The resultant regression equation is applied to starch recovery values generated from the DSA assay to provide an estimate of total tract starch digestibility (termed Starch DigestibilityDSA; Shaver and Hoffman, 2006) which can be used in summative energy equations (Schwab et al., 2003; NRC, 2001) directly to calculate energy values for corn-based feeds on a standardized basis.

More field and in vivo evaluations of these laboratory assays related to starch digestibility (KPS, DSA, and in situ/in vitro) are needed. Therefore, the MILK2006 model continues to use the regression approach of MILK2000 (Schwab et al., 2003) as the default method for determining starch digestibility. But, user-defined options are available within the MILK2006 spreadsheet for determining starch digestibility from available KPS, DSA, or in situ/in vitro data. For hybrid performance trials where an objective is to assess true hybrid differences for kernel endosperm properties, the harvest maturity, whole-plant DM content, and sample particle size should be kept as similar as possible since these factors all influence the starch digestibility determinations.

Fiber and Its Digestibility

The NRC (2001) summative energy equation is based on fiber digestibility calculated using lignin. Whole-plant lignin content was found to have a strong negative relationship with IVNDFD within comparisons of brown midrib (bm3) hybrids to isogenic counterparts (Oba and Allen, 1999b). However, stover NDF and lignin contents increase while NDFD decreases with progressive maturity, but whole-plant NDF and lignin contents are constant or decline as grain proportion increases (Russell et al., 1992; Hunt et al., 1989). This may partially explain why for 534 corn silage samples, NDFD calculated using lignin according to NRC (2001) accounted for only 14% (P < 0.001) of IVNDFD variation (Schwab and Shaver, unpublished). Michigan State workers (Oba and Allen, 2005; Allen and Oba, 1996; M. S. Allen, personal communication, 2003 Tri-State Nutr. Conf. Pre-Symp.) reported that lignin (% of NDF) explained only half or less of the variation for corn silage IVNDFD. These observations coupled with the NRC (2001) suggestion that IVNDFD measurements could be used directly in the NRC model led us to implement IVNDFD rather than lignin-calculated NDF digestibility in the corn silage milk per ton models (Schwab et al., 2003). Use of NDF and IVNDFD in the corn silage milk per ton models has been discussed above.

Several commercial testing laboratories offer wet chemistry IVNDFD measurements. NIRS calibrations for predicting IVNDFD on corn silage samples are available at some commercial forage testing laboratories. However, Lundberg et al. (2004) found poor prediction by NIRS of corn silage IVNDFD. It is hoped that NIRS calibration equations can be improved upon in the future. The NRC (2001) recommended a 48-h IVNDFD for use in the NRC (2001) model, and for that reason we used 48-h IVNDFD measurements in MILK2000 (Schwab et al., 2003). However, debate continues within the industry about the appropriateness of 48-h vs. 30-h IVNDFD measurements. Some argue that the 30-h incubation better reflects ruminal retention time in dairy cows (Oba and Allen, 1999a) and that most of the in vivo trials that have evaluated effects of varying IVNDFD on animal performance also performed 30-h IVNDFD measurements (Oba and Allen, 2005). Labs and their customers also like the faster sample turn around that is afforded by the 30-h incubation time point. For that reason, and also for improved lab operation efficiency, a 24-h incubation time point is being employed by some labs. However, some argue that the 48-h incubation time-point is less influenced by lag time and rate of digestion, and thus is more repeatable in the laboratory (Hoffman et al., 2003). Hoffman et al. (2003) provided data on the relationship between 30- and 48-h IVNDFD measurements that showed a strong positive relationship (r-square = 0.84). But, the lab average at a specific incubation time point and the relationship between incubation time points within a lab can be highly variable among labs making the development of a universal incubation time point adjustment equation difficult. The average lignin-calculated corn silage NDF digestibility in the NRC (2001) is 59%. This reference point is important for adjustment of IVNDFD values from different labs and varying incubation time points so that the resultant TDN and NEL values are comparable to NRC (2001) values.

User-defined flexibility is available within the MILK2006 spreadsheet for entry of 48-, 30-, or 24-h IVNDFD incubation time point measurements. But, the labs incubation time point and average results for corn silage at that time point must also be entered into the spreadsheet along with the sample data. The 48-h IVNDFD incubation time point continues to serve as the default in the milk per ton spreadsheets. The Wisconsin Corn Silage Hybrid Performance Trials (Lauer et al., 2005) will continue to use the 48-h IVNDFD incubation time point because NIRS calibrations for this time point have been developed from corn silage samples obtained in this evaluation program over several years by locations and Justen (2004) did not find the earlier incubation time points to provide any benefit over the 48-h time point for hybrid selection.

Model Comparisons

Values for TDNmaintenance, NEL-3x, and milk per ton calculated using MILK2006 and MILK2000 across a wide range of whole-plant corn IVNDFD values and extreme quality differences are presented in Tables 1 and 2, respectively. The TDNmaintenance differences between MILK2006 and MILK2000 are minimal. The NEL-3x and milk per ton values are lower and the range in these values is compressed for MILK2006 relative to MILK2000 according to the equation differences between the two models that were described above.

Analysis of correlations between corn silage NDF, IVNDFD, starch, and starch digestibility and milk per ton estimates from MILK 2006, 2000, 1995, and 1991 models (n = 3727 treatment means; Shaver and Lauer, 2006) is presented in Table 3. Results show that the MILK2000 model was revolutionary relative to the earlier models (milk per ton hybrid rank correlation between MILK2000 and MILK1991 was only 0.68), because of its recognition of IVNDFD as an important quality parameter while the earlier models were influenced mostly by whole-plant starch and grain contents. The MILK2006 model relative to MILK2000 appears to be more evolutionary reflecting the relatively minor fine-tuning of equations (milk per ton hybrid rank correlation between MILK2006 and MILK2000 was 0.95), but the spreadsheet will allow for more user-defined flexibility. Future developments in laboratory methods for determining starch digestibility may influence its relationship to milk per ton estimates relative to the other quality measures.

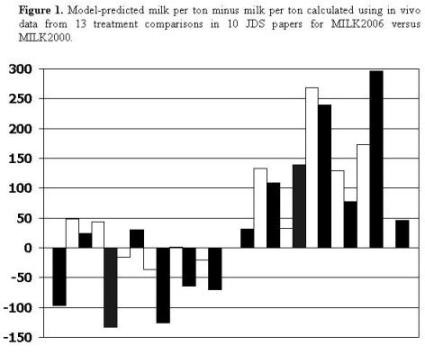
Ivan et al. (2005) evaluated “low-fiber” (26% starch, 49% NDF, 58% IVNDFD) versus “high-fiber” (22% starch, 53% NDF, 67% IVNDFD) corn silages in 30% NDF diets fed to lactating dairy cows. Reported per cow per day milk yields were converted to milk per ton of corn silage DM basis using their corn silage DMI data. Actual milk per ton was 168 lb. higher for high-fiber than low fiber corn silage. Model-predicted milk per ton estimates were 132 lb. and 297 lb. higher for high-fiber than low-fiber corn silage from MILK2006 and MILK2000 models, respectively. This suggests reasonable agreement with in vivo data for MILK2006 and better agreement with in vivo data for MILK2006 than MILK2000. Presented in Figure 1 is model-predicted milk per ton minus milk per ton calculated using in vivo data from 13 treatment comparisons in 10 JDS papers (Ballard et al., 2001; Ebling and Kung, 2004; Ivan et al., 2005; Neylon and Kung, 2003; Oba and Allen, 2000; Oba and Allen, 1999a; Qiu et al., 2003;Taylor and Allen, 2005b; Thomas et al., 2001; Weiss and Wyatt, 2002) for MILK2006 versus MILK2000. There was less model over-predictive bias for MILK2006 than MILK2000. The model-predicted milk per ton minus in vivo-calculated milk per ton difference exceeded 100 lb. (approximately 1 lb. per cow per day) for only 2 of 13 treatment comparisons with MILK2006 versus 8 of 13 treatment comparisons with MILK2000.

While these observations with MILK2006 are encouraging, more model validations relative to in vivo data are needed. The MILK2006 Excel Workbook can be downloaded at the University of Wisconsin’s Extension website.

Table 1. Impact of IVNDFD (average lab IVNDFD 58% of NDF) in whole-plant corn harvested at 35% DM content with kernel processing on TDN1x (%), NEL-3x (Mcal/lb.) and milk (lb.) per ton using MILK2006 or MILK2000 with nutrient composition adapted from NRC (2001) for “normal” corn silage (8.8% CP, 45% NDF, 27% starch, 4.3% ash, and 3.2% fat).
IVNDFD% MILK
2006
TDN1x
MILK
2006
NEL-3x
MILK
2006
Milk/ton
MILK
2000
TDN1x
MILK
2000
NEL-3x
MILK
2000
Milk/ton
46 65.3 0.66 2936 66.4 0.69 3074
50 67.0 0.67 3037 68.2 0.71 3244
54 68.8 0.68 3138 70.0 0.73 3413
58 70.5 0.69 3237 71.8 0.75 3579
62 72.3 0.70 3336 73.6 0.77 3743
66 74.0 0.72 3434 75.4 0.79 3905
70 75.8 0.73 3530 77.2 0.81 4065

Table 2. Impact of “low” (45% DM, unprocessed, 8.8% CP, 54% NDF, 46% IVNDFD, 20% starch, 4.3% ash, and 3.2% fat) versus “high” (30% DM, processed, 8.8% CP, 36% NDF, 70% IVNDFD, 34% starch, 4.3% ash, and 3.2% fat) quality extremes in whole-plant corn on TDN1x (%), NEL-3x (Mcal/lb.) and milk (lb.) per ton using MILK2006 or MILK2000.
Quality MILK
2006
TDN1x
MILK
2006
NEL-3x
MILK
2006
Milk/ton
MILK
2000
TDN1x
MILK
2000
NEL-3x
MILK
2000
Milk/ton
“Low” 56.2 0.55 2242 57.3 0.58 2418
“High” 76.3 0.74 3617 79.9 0.84 4256

Table 3. Analysis of correlations for selected corn silage nutrients and their digestibility coefficients with milk per ton estimates from MILK2006, 2000, 1995, and 1991 models (n = 3727 treatment means; Shaver and Lauer, 2006).
r-values MILK
2006
Milk/ton1
MILK
2000
Milk/ton2
MILK
1995
Milk/ton3
MILK
1991
Milk/ton4
NDF% -0.46 -0.40 -0.94 -0.99
Starch% 0.48 0.44 0.75 0.74
IVNDFD, % of NDF 0.49 0.70 0.16 -0.10
StarchD, % of Starch 0.30 0.21 -0.25 -0.27
1Calculated as per Schwab et al. (2003) except for modifications discussed herein.
2Calculated as per Schwab et al. (2003).
3Calculated as per Undersander et al. (1993) except for in vitro DM digestibility adjustment.
4Calculated as per Undersander et al. (1993) using ADF and NDF.

Corn Silage Fig 1.jpg


References

  • Allen, M., and M. Oba. 1996. Fiber digestibility of forages. Pages 151-171 in Proc. MN Nutr. Conf. Bloomington, MN.
  • Ballard, C. S., E. D. Thomas, D. S. Tsang, P. Mandebvu, C. J. Sniffen, M. I. Endres, and M. P. Carter. 2001. Effect of corn silage hybrid on dry matter yield, nutrient composition, in vitro digestion, intake by dairy heifers, and milk production by dairy cows. J. Dairy Sci. 84:442–452.
  • Blasel, H.M., P. C. Hoffman, and R. D. Shaver. 2006. Degree of starch access: An enzymatic method to determine starch degradation potential of corn grain and corn silage. J. Anim. Feed Sci. Technol. 128:96-107.
  • Crocker, L.M., E. J. DePeters, J. G. Fadel, H. Perez-Monti, S. J. Taylor, J. A. Wyckoff, and R. A. Zinn. 1998. Influence of processed corn grain in diets of dairy cows on digestion of nutrients and milk composition. J. Dairy Sci. 81: 2394-2407.
  • Doggett, C. G., Hunt, C. W., Andrae, J. G., Pritchard, G. T., Kezar, W., and J. H. Harrison. 1998. Effect of hybrid and processing on digestive characteristics of corn silage. J. Dairy Sci. 81(Suppl.1):196(Abstr.)
  • Ebling, T. L., and L. Kung, Jr. 2004. A comparison of processed conventional corn silage to unprocessed and processed brown midrib corn silage on intake, digestion, and milk production by dairy cows. J. Dairy Sci. 87:2519–2527.
  • Ferreira, G., and D. R. Mertens. 2005. Chemical and physical characteristics of corn silages and their effects on in vitro disappearance. J. Dairy Sci. 88:4414-4425.
  • Firkins, J. L., M. L. Eastridge, N. R. St-Pierre, and S. M. Noftsger. 2001. Effects of grain variability and processing on starch utilization by lactating dairy cattle. J. Anim. Sci. 79(E. Suppl.): E218-E238.
  • Hoffman, P. C., Lundberg, K. L., L. M. Bauman, and R. Shaver. 2003. In vitro NDF digestibility of forages: The 30 vs. 48 hour debate. Univ. of WI Extension Focus on Forage Series. Vol. 5, No. 16. http://www.uwex.edu/ces/crops/uwforage/30vs48-FOF.htm.
  • Hunt, C. W., W. Kezar, and R. Vinande. 1989. Yield, chemical composition and ruminal fermentability of corn whole plant, ear, and stover as affected by maturity. J. Prod. Agric. 2:357-361.
  • Ivan, S. K., R. J. Grant, D. Weakley, and J. Beck. 2005. Comparison of a Corn Silage Hybrid with High Cell-Wall Content and Digestibility with a Hybrid of Lower Cell-Wall Content on Performance of Holstein Cows. J. Dairy Sci. 2005 88:244-254.
  • Joy, M. T., E. J. DePeters, J. G. Fadel, and R. A. Zinn. 1997. Effects of corn processing on the site and extent of digestion in lactating cows. J. Dairy Sci. 80: 2087-2097.
  • Jung, H.G., M., Raeth-Knight, and J. G. Linn. 2004. Forage fiber digestibility: Measurement, variability, and impact. Pages 105-125 in Proc. 65th MN Nutr. Conf. Bloomington, MN.
  • Justen, B. A. L. 2004. Digestion kinetics and vitreousness in breeding maize (Zea Mays L.) for silage yield and nutritional quality. M. S. Thesis. Plant Breeding and Genetics. Univ. of Wisconsin – Madison.
  • Knowlton, K.F., M. S. Allen, and P. S. Erickson. 1996. Lasalocid and particle size of corn grain for dairy cows in early lactation. 1. Effect on performance, serum metabolites, and nutrient digestibility. J. Dairy Sci. 79: 557-564.
  • Knowlton, K. F., B. P. Glenn, and R. A. Erdman. 1998. Performance, ruminal fermentation, and site of starch digestion in early lactation cows fed corn grain harvested and processed differently. J. Dairy Sci. 81:1972-1984.
  • Lauer, J., K. Kohn, and P. Flannery. 2005. Wisconsin Corn Hybrid Performance Trials Grain and Silage. Univ. of WI Ext. Publ. A3653. http://corn.agronomy.wisc.edu/HT/2005/2005Text.aspx.
  • Lundberg, K. L., P. C. Hoffman, L. M. Bauman, and P. Berzaghi. 2004. Prediction of forage energy content by near infrared reflectance spectroscopy and summative equations. Prof. Anim. Sci. 20:262-269.
  • Mertens, D. R. 2005. Particle size, fragmentation index, and effective fiber: Tools for evaluating the physical attributes of corn silages. Pages 211-220 in Proc. Four-State Dairy Nutr. & Mgmt. Conf. MWPS-4SD18. Dubuque, IA.
  • Mertens, D. R. 1987. Predicting intake and digestibility using mathematical models of ruminal function. J. Anim. Sci. 64:1548-1558.
  • National Research Council. 2001. Nutrient Requirements of Dairy Cattle. 7th rev. ed. Natl. Acad. Sci., Washington, DC.
  • National Research Council. 1989. Nutrient Requirements of Dairy Cattle. 6th rev. ed. Natl. Acad, Sci., Washington, DC.
  • Neylon, J. M., and L. Kung, Jr. 2003. Effects of cutting height and maturity on the nutritive value of corn silage for lactating cows. J. Dairy Sci. 86:2163–2169.
  • Nocek, J. E., and S. Tamminga. 1991. Site of digestion of starch in the gastrointestinal tract of dairy cows and its effects on milk yield and composition. J. Dairy Sci. 74:3598-3629.
  • Oba, M. and M. Allen. 2005. In vitro digestibility of forages. Pages 81-91 in Proc. Tri-State Dairy Nutr. Conf. Ft. Wayne, IN.
  • Oba, M, and M. S. Allen. 2003. Effects of corn grain conservation method on ruminal digestion kinetics for lactating dairy cows at two dietary starch concentrations. J. Dairy Sci. 86:184-194.
  • Oba, M. and M. S. Allen. 2000. Effects of brown midrib 3 mutation in corn silage on productivity of dairy cows fed two concentrations of dietary neutral detergent fiber: 1. Feeding behavior and nutrient utilization. J. Dairy Sci. 83:1333-1341.
  • Oba, M. and M. S. Allen. 1999a. Effects of brown midrib 3 mutation in corn silage on dry matter intake and productivity of high yielding dairy cows. J. Dairy Sci. 82:135-142.
  • Oba, M. and M. S. Allen. 1999b. Evaluation of the importance of the digestibility of neutral detergent fiber from forage: effects on dry matter intake and milk yield of dairy cows. J. Dairy Sci. 82:589-596.
  • Orskov, E. R. 1986. Starch digestion and utilization in ruminants. J. Anim. Sci. 63:1624-1633.
  • Owens, F. N., R. A. Zinn, and Y. K. Kim. 1986. Limits to starch digestion in the ruminant small intestine. J. Anim. Sci. 63:1634-1648.
  • Qiu, X., M. L. Eastridge, and Z. Wang. 2003. Effects of corn silage hybrid and dietary concentration of forage NDF on digestibility and performance by dairy cows. J. Dairy Sci. 86:3667–3674.
  • Remond, D., Cabrer-Estrada, J. I., Chapion M., Chauveau B., Coudure R., Poncet C. 2004. Effect of corn particle size on site and extent of starch digestion in lactating dairy cows. J. Dairy Sci. 87:1389-1399.
  • Rooney, L. W., and R. L. Pflugfelder. 1986. Factors affecting starch digestibility with special emphasis on sorghum and corn. J. Anim. Sci. 63:1607-1623.
  • Russell, J. R., N. A. Irlbeck, A. R. Hallauer, and D. R. Buxton. 1992. Nutritive value and ensiling characteristics of maize herbage as influenced by agronomic factors. J. Anim. Feed Sci. Technol. 38:11-24.
  • Sapienza, D. 2002. Pioneer tripartite method: Linking nutrient content to availability. Pages 27-40 in Proc. 64th Cornell Nutr. Conf. East Syracuse, NY.
  • Schwab, E. C., R. D. Shaver. J. G. Lauer, and J. G. Coors. 2003. Estimating silage energy value and milk yield to rank corn hybrids. J. Anim. Feed Sci. Technol. 109:1-18.
  • Shaver, R. D., and P. C. Hoffman. 2006. Corn silage starch digestibility: What’s new? In Proc. NRAES Silage for Dairy Farms Conf. Camp Hill, PA.
  • Shaver, R. D., and J. G. Lauer. 2006. Review of Wisconsin corn silage milk per ton models. J. Dairy Sci. 89(Suppl. 1):282(Abstr.)
  • Taylor, C. C. and M. S. Allen. 2005a. Corn grain endosperm type and brown midrib 3 corn silage: Site of digestion and ruminal digestion kinetics in lactating cows. J. Dairy Sci. 2005 88: 1413-1424.
  • Taylor, C. C. and M. S. Allen. 2005b. Corn grain endosperm type and brown midrib 3 corn silage: Feeding Behavior and Milk Yield of Lactating Cows. J. Dairy Sci. 88: 1425-1433.
  • Theurer, C. B. 1986. Grain processing effects on starch utilization by ruminants. J. Anim. Sci. 63:1649-1662.
  • Thomas, E. D., P. Mandebvu, C. S. Ballard, C. J. Sniffen, M. P. Carter, and J. Beck. 2001. Comparison of corn silage hybrids for yield, nutrient composition, in vitro digestibility, and milk yield by dairy cows. J. Dairy Sci. 84:2217–2226.
  • Undersander, D.J., W.T. Howard, and R.D. Shaver. 1993. Milk per acre spreadsheet for combining yield and quality into a single term. J. Prod. Ag. 6:231 235.
  • Weiss, W. P., and D. J. Wyatt. 2002. Effects of feeding diets based on silage from corn hybrids that differed in concentration and in vitro digestibility of neutral detergent fiber to dairy cows. J. Dairy Sci. 85:3462–3469.
  • Yu, P., J. T. Huber, F.A.P. Santos, J. M. Simas, and C. B. Theurer. 1998. Effects of ground, steam-flaked, and steam-rolled corn grains on performance of lactating cows. J. Dairy Sci. 81: 777-783.

“Extension programs and policies are consistent with federal and state laws and regulations on nondiscrimination regarding race, sex, religion, age, color, creed, national or ethnic origin; physical, mental or sensory disability; marital status, sexual orientation, or status as a Vietnam-era or disabled veteran. Evidence of noncompliance may be reported through your local Extension office.”

Disclaimer

This fact sheet reflects the best available information on the topic as of the publication date. Date 5-25-2007

This Feed Management Education Project was funded by the USDA NRCS CIG program. Additional information can be found at Feed Management Publications.

Image:Feed mgt logo4.JPG
This project is affiliated with the Livestock and Poultry Environmental Learning Center.

Image:usda,nrcs,feed_mgt_logo.JPG

Project Information

Detailed information about training and certification in Feed Management can be obtained from Joe Harrison, Project Leader, jhharrison@wsu.edu, or Becca White, Project Manager, rawhite@wsu.edu.

Author Information

Randy Shaver
Professor and Extension Dairy Nutritionist
Department of Dairy Science
College of Agricultural and Life Sciences
University of Wisconsin – Madison
University of Wisconsin – Extension

Reviewer Information

Pat Hoffman – University of Wisconsin
Jim Barmore – Nutrition Consultant

Partners

Logos2.JPG


Market Based Conservation

Market-based conservation is an evolving concept that can mean different things to different people. Market-oriented approaches to conservation can include:

  • Using economic approaches, such as auctions and trading of credits, niche marketing, and a variety of payment for ecosystem services strategies
  • Encouraging competitions, such as bidding for grants or offers to pay for a greater share of the cost
  • Providing data to inform the conservation investment decisions of others
  • Focusing on monetary and non-monetary incentives
  • Fostering knowledge-based conservation

Webcast Presentation

The LPE Learning Center hosted a webcast on Market Based Conservation: Implications for Manure Management in May, 2008.

Market Based Conservation as a Policy

At the White House Conference on Cooperative Conservation in 2005, Agriculture Secretary Johanns announced a new U.S. Department of Agriculture Policy on Market-Based Environmental Stewardship. The goal of this policy is to broaden the use of markets for environmental and ecosystem services through voluntary market mechanisms. These mechanisms may include environmental credit trading, insurance, mitigation banking, competitive offer-based auctioning, eco-labeling—and more. The intent of this new policy is to make a deliberate, determined effort to help bring producers and consumers together and to develop innovative tools to quantify environmental impacts. In December of 2008, the USDA announced the creation of the Office of Environmental Markets to catalyze the development of markets for ecosystem services.

Until the last few years, in the U.S., most of the incentives for conservation have been provided by government through sharing the cost of conservation practices on private lands because these practices also have public environmental benefits. Trading is a market approach that is gaining acceptance through the cap and trade system. The Environmental Protection Agency policy on water quality trading is an example of the market approach. With trading, regulated industries have the flexibility to find the least cost avenue to comply with emissions, or at times, to trade with others to improve environmental quality. That is, when regulated industries must reduce emissions it may be cheaper to pay other firms or farms to reduce emissions than to do it themselves. Trading has the potential to accelerate air and water quality improvement and reduce compliance costs. The key to market-based incentives is that they are voluntary, verifiable, and transparent.

Examples of Market Based Conservation or Trading Programs

The New York City Watershed Agricultural Program is a great example of market based trading with a complementary municipal and agricultural partnership. Local farmers and agribusiness worked with the city to protect drinking water quality on nearly 500,000 acres of farmland in the watershed that supplies New York with drinking water. This saved the city millions of dollars in the development of advanced treatment systems and helped the rural community maintain its character.

One of the best manure based examples that is currently available is the Environmental Credit Corporation Lagoon Cover Program. Through this program, they will design, finance, and install lagoon covers to capture methane and other emissions at no cost to the farmer. They use the results to sell the carbon credits and can provide additional income to producers in some cases. Companies that buy and sell credits like ECC are called aggregators of credits. While national carbon legislation in the US has still not passed, there are still voluntary opportunities that exist for those in the agricultural sector as outlined in this webcast on opportunities for pork producers.

A final example is Vermont’s Cow Power program. Central Vermont Public Service, a utility, created a surcharge/premium people can pay to purchase green power generated by anaerobic digesters on dairy farms. This premium goes back to the farmer, generating a marketplace incentive and reward for farmers who are generating renewable, green energy from manure.

Recommended Reading on Market Based Conservation

EPA has just issued a new publication as part of its effort to support innovative, market-based approaches to water quality trading. The Water Quality Trading Toolkit for Permit Writers: Interim Technical Guide provides National Pollutant Discharge Elimination System (NPDES) provides permitting authorities with the tools they need to incorporate trading provisions into permits. The Toolkit also serves as EPA’s first “how-to” manual on designing and implementing trading programs consistent with EPA’s 2003 National Water Quality Trading Policy and will be valuable to all stakeholders. The Toolkit is focused on trading nitrogen and phosphorus, although, based on the Trading Policy, other pollutants may be considered for trading on a case-by-case basis.

The USDA Economic Research Service published a publication on Environmental Credit Trading; Can Farming Benefit. This six page document outlines several opportunities and discusses the potential markets for agricultural credit providers. They also published a document called The Use of Markets to Increase Private Investment in Environmental Stewardship that provides an overview of some market based conservation options.

American Farmland Trust’s Center for Agriculture in the Environment helps protect America’s agricultural lands and promotes healthy farming practices. This public policy research center has some excellent materials on market based conservation such as insurance programs to pay for yield reductions do to reduced nutrient inputs and materials on ecosystem services provided by agriculture.

The Ecosystem Marketplace Website provides many links to great resources and is a good example of an established trading program.

Harnessing Farms and Forests in the Low-Carbon Economy: How to Create and Verify Greenhouse Gas Offsets, a technical guide for farmers, foresters, traders and investors. A preview of the guide is available online at the Duke University Nicholas Institute for Environmental Policy Studies

Research Summaries on Market Based Conservation

An economic analysis of nutrient trading in the Chesapeake Bay Region: A study looks into nutrient credit trading as a means to improve the quality of water in the Chesapeake Bay.

Water Quality Trading in the United States provides a great overview of water quality trading programs implemented in the U.S. The primary source of information for this overview is a detailed database, collected and compiled by a team of researchers at Dartmouth College.

Paying For Environmental Performance: Using Reverse Auctions To Allocate Funding For Conservation Since demand for funding in conservation programs usually exceeds the available funds, allocating funding in a way that achieves the greatest environmental outcomes is essential. Reverse auctions are one way to efficiently allocate funding. This paper examines two reverse auctions conducted in Pennsylvania, designed to fund best management practices that reduced phosphorus pollution. It explains how reverse auctions can be used to maximize environmentally desirable outcomes, and outlines lessons learned from the Conestoga Reverse Auction Project within Pennsylvania’s Susquehanna River Watershed.

The Florida Ranchlands Environmental Services Project: Field Testing a Pay-for-Environmental-Services Program This paper examines a project in Florida that will field test a program that pays cattle ranchers to provide environmental services that will benefit the lake. The program came about after a 2004 study conducted by World Wildlife Fund (WWF) with several cattle ranchers concluded that a program to promote changes in water management practices on 850,000 acres of improved and unimproved pasture could moderate water flows to the lake, reduce phosphorus loads, and add to wetlands habitat. The study concluded that the agencies could buy these environmental services from cattle ranchers at a lower cost than producing the services by building new public works projects.

Doug Parker at the University of Maryland has written a report on Creating Markets for Manure: Basin-wide Management in the Chesapeake Bay Region. This report summarizes various methods for creating manure based markets. Other reports and programs from Georgia and Arkansas have focused on improving markets for poultry litter.

Author: Mark Risse, University of Georgia
Reviewers: John Lawrence, Iowa State University and Suzy Friedman, Environmental Defense Fund

Livestock and Poultry Environmental Stewardship Curriculum Lessons

Livestock and Poultry Environmental Stewardship Curriculum contains a series of lessons, CAFO fact sheets, Small Farm fact sheets, and Ag EMS publications.
feature

CC 2.5 Jill Heemstra

The LPES Curriculum would not have been possible without the effort of many. Meet the LPES Team…

Module A. Introduction

1.Principles of Environmental Stewardship (individual sections) (entire lesson)
2.Whole Farm Nutrient Planning (individual sections) (entire lesson)

Module B. Animal Dietary Strategies

10. Reducing the Nutrient Excretion and Odor of Pigs Through Nutritional Means (individual sections) (entire lesson)
11.Using Dietary and Management Strategies to Reduce the Nutrient Excretion of Poultry (individual sections) (entire lesson)
12. Feeding Dairy Cows to Reduce Nutrient Excretion (individual sections) (entire lesson)
13. Using Dietary Strategies to Reduce the Nutrient Excretion of Feedlot Cattle (individual sections) (entire lesson)

Module C. Manure Storage and Treatment

20. Planning and Evaluation of Manure Storage (individual sections) (entire lesson)
21. Sizing Manure Storage, Typical Nutrient Characteristics (entire lesson)
22. Open Lot Runoff Management Options (individual sections) (entire lesson)
23. Manure Storage Construction and Safety, New Facility Considerations (individual sections) (entire lesson)
24. Operation and Maintenance of Manure Storage Facilities (individual sections) (entire lesson)
25. Manure Treatment Options (individual sections) (entire lesson)

Module D. Land Application and Nutrient Management

30. Soil Utilization of Manure (individual sections) (entire lesson)
31. Manure Utilization Plans (entire lesson)
32. Land Application Best Management Practices (individual sections) (entire lesson)
33. Selecting Land Application Sites (individual sections) (entire lesson)
34. Agricultural Phosphorus Management Protecting Production and Water Quality (individual sections) (entire lesson)
35. Land Application Records and Sampling (individual sections) (entire lesson)
36. Land Application Equipment (individual sections) (entire lesson)

Module E. Outdoor Air Quality

40. Emission from Animal Production Systems (individual sections) (entire lesson)
41. Emission Control Strategies for Building Sources (individual sections) (entire lesson)
42. Controlling Dust and Odor from Open Lot Livestock Facilities (entire lesson)
43. Emission Control Strategies for Manure Storage Facilities (individual sections) (entire lesson)
44. Emission Control Strategies for Land Application (individual sections) (entire lesson)

Module F. Related Issues

50. Emergency Action Plans (individual sections) (entire lesson)
51. Mortality Management (individual sections) (entire lesson)

About the Livestock and Poultry Environmental Learning Center

Mission | Contact Us | Topic Teams | Products | Core Values | Funding | Membership

What Is the Livestock and Poultry Environmental Learning Center (LPELC)?

The LPELC is a network made up of professionals from across the U.S. (and Canada) with an interest and expertise in some aspect of animal agriculture and environmental stewardship. (A nice way of saying we talk about manure….a lot.) Public sector funding for people and projects devoted to the outreach and extension of research information has dwindled at an alarming rate. This learning network offers faculty and staff with opportunities to network, collaborate, mentor, and share. What used to be done by walking down the hall, now can be done in “virtual” settings. It is our way of trying to do more with less. The network was officially established in 2005 with a USDA National Facilitation grant focused on water quality. It has continued to the present through the support of other grants related to air quality, beginning farmers, and climate change among others.

A learning network like the LPELC strives to bring together all types of expertise; all the way from research and technical knowledge to application of science on the farm. Ideally, a learning network creates a feedback loop where on-farm application informs the research and science. Better science should lead to positive applications on the farm which continues to refine the science, and so on.

Our Mission

Individuals involved in public policy issues, animal production, and delivery of technical services for animal agriculture will have on-demand access to the nation’s best science-based resources that is responsive to priority and emerging environmental issues associated with animal agriculture.

Contact Us

Webcast series, web content: Leslie Johnson, University of Nebraska leslie.johnson@unl.edu

Leadership committee:

Topic Teams

Most of the website content is created by the focused groups within the learning network–the topic teams. These teams host “virtual work days” (usually on an annual basis) for the review and development of  web content, identification of “hot” topics, professional development needs, or opportunities to collaborate for grant funding. The team leaders serve on a rotating basis and new members are welcomed at any time. (If you use the signup link, be sure to request membership in the LPELC during the process). The mutli-disciplinary nature of the LPELC is one of its greatest strengths.

Products

The major products of the learning center are:

  • This website. The LPELC chose to affiliate with the eXtension Initiative platform for production of web content. This system is one of the largest outreach networks ever assembled and allows us to access expertise on beef, dairy, poultry, and other topics to supplement that already on our team.
  • Webcast series. The LPELC was a pioneer in delivering scientific information through live broadcasts over the web. We produced our first webinar in September, 2006 and continue on a monthly basis to the present. Webcasts are archived for future use.
  • Waste to Worth conference. The first W2W was held in 2013 in Denver, Colorado with over 250 people in attendance. The conference aims to bring together science, on-farm application, and solutions for the questions surrounding animal agriculture and environmental stewardship. A winning recipe, for turning waste into worth!
  • Newsletter. A comprehensive, national newsletter highlighting science, programs, activities, resources, and hot topics related to animal ag and stewardship. Subscribe now….
  • Ask an expert. If a question cannot be answered by looking through the website, you have the option to ask an expert. We have knowledgeable people from 40+ states ready to assist.
  • Our outreach goes beyond a website. Look for us on Youtube, Slideshare, Twitter, Facebook, and Flickr.

Pillars of This Learning Network

A national team representing a broad spectrum of those creating, delivering and utilizing research-based knowledge will establish a national Livestock and Poultry Environmental Learning Center committed to:

  • Implementing a customer driven approach that will identify critical or emerging issues. We regularly ask stakeholders what they need and how this information impacts their daily work.
  • For priority issues identified by stakeholders, developing or curating the best science-based resources available. Reliable, credible information that is reviewed and recommended by a multi-disciplinary team of experts.
  • Developing and testing innovative outreach models for connecting those who are creating new research knowledge with the end users of that knowledge. We are finding new ways to learn and interact with experts, peers, learners, and influencers.
  • Identifying appropriate national learning center roles that best support existing organizations committed to an outreach mission. We are not trying to compete with existing resources–we are committed to finding ways to help increase the usage of good resources already published and then develop original content as appropriate.
  • Provide a repository for information that is accessible beyond a funded project. Grant-funded projects provide exceptional opportunities to develop new knowledge and explore outreach strategies. To prevent this accrued knowledge from falling out of common use as personnel move on to new projects or websites are decommissioned, it is important to provide an accessible “home” for that information. This also provides future projects with a base from which to build rather than have to start from scratch.

Our Audience

Our ultimate customer is the livestock or poultry producer. However, this network tends to emphasize delivery of information to ag professionals that influence producer environmental management decisions. This allows for the professional to appropriately contextualize information for different geographical locations or production systems. The LPELC places a high value on working with a wide range of groups such as: extension, research and teaching faculty/staff, commodity groups, ag organizations, agencies, environmental organizations, farmers, public and private sector advisers, and those involved in public policy implementation.

How Is the Livestock and Poultry Environmental Learning Center (LPELC) Funded?

The LPELC is funded through grant dollars. Our leadership and staff write grant grants for outreach in animal agriculture and stewardship efforts. They also work with projects that would like to partner with the LPELC to enhance their outreach efforts. A copy of the collaboration planner is available at: http://create.extension.org/node/99673 (need an eXtension ID to view it). A copy can also be obtained from Jill jheemstra@unl.edu.

How Do I Become a Member? Why?

Becoming a member is easy. Sign up through eXtension’s “people” application or request an invitation from Leslie Johnson at leslie.johnson@unl.edu.

Being a part of a collaborative network as active as the LPELC often raises questions for perspective members:

  • How much time will it take? Being involved is voluntary and many members go through periods of activity followed by phases where they have to focus on other priorities. This is a normal and expected part of learning networks. It is our goal to assist members in finding resources and connections that help increase their efficiency. We hope you get as much (or more) out of this network than what you put in and welcome involvement as your efforts and interest allow and align with other activity in the LPELC.
  • Will I lose credit for my work? The LPELC produces some original content and also curates (links to, embeds, or otherwise highlight in its original location and form) information. Even in original content that is branded for the LPELC (which is a choice made by the authors) the individual contributors and their respective institutions are highlighted. The transparency of authorship and reivew is an important aspect of establishing the credibility of information on this site. Articles or resources authored through the LPELC should be reported on an author or reviewer’s annual reporting for their supervisor as a national scope, peer-reviewed resource.

Feed Management Planning as a Tool to Reduce Nutrient Excretion

Why is Feed Management Important to Nutrient Planning?

Feed represents the largest import of nutrients to the farm, followed by commercial fertilizer. Feed management practices impact the amount of nutrients that are imported to the farm and excreted in manure. The excreted nutrients are subsequently available for volatile loss (nitrogen) to the atmosphere and potentially lost via surface runoff (nitrogen and phosphorus) or leached to ground water (nitrogen and phosphorus).

Nutrient management planning addresses the proper distribution of manure nutrients, but typically only focuses on the nutrients after they have been excreted by the animal. It may seem obvious, but the amount of N and P consumed by an animal is directly related to the amount it excretes. Formulating an inexpensive ration with excess N or P, will increase the amount of these nutrients excreted in the manure. Depending on the requirements of the farm nutrient management plan, this may mean that the manure must be spread over a larger number of acres compared to manure that contains lower N or P levels.

Feed management opportunities currently exist to reduce imports of nutrients (particularly N and P) to most animal livestock and poultry operations. Since consulting nutritionists play such a key role with regard to importation of nutrients to the farm, a systematic approach to evaluate the role that Feed Management has on whole farm nutrient management is warranted.

Resources Available for Managing Feed Nutrients

The National Feed Management Education Project (NFMEP) has developed a systematic approach to feed management and whole farm nutrient management. The team has developed a series of fact sheets and resources for the four major species. In addition, the LPE Learning Center Small Farms team has developed resources for small acreage livestock and poultry owners.

graphic

CC2.5 LPELC

Authors: Joe Harrison, Washington State University and Jill Heemstra, University of Nebraska

Webinar Troubleshooting


livestock and poultry environmental learning center logo with cow, pig, and chicken sillhouettes over a map of the U.S. with three circling arrows

Firewalls

As of Summer of 2016, we have begun using a different virtual meeting room and system. We hope that there are no firewall issues with it, but please let us know if you’re having problems. If one or more of the diagnostic tests in Step 1 on How Do I Participate in a Webinar? fails, contact your IT staff or Internet Service Provider and work with them to see if there are ways to allow the stream through the firewall. With the new system, the URL for each webinar will be different. Questions can be directed to the LPE Learning Center coordinator, Jill Heemstra, jheemstra@unl.edu or the webinar coordinator, Leslie Johnson, leslie.johnson@unl.edu.

Other Things to Check

Quick things to check if you have trouble connecting. Check the following simple items to help resolve meeting access issues.

  • Are you connected to the Internet?
  • Disable popup blocker software.
  • Clear the browser’s cache.
  • Try connecting from another computer.
  • Are you accessing the correct URL?

Cannot Hear the Presenters

If you cannot hear the presenters or the volume is very low, try the following:

  • adjust the volume on your computer and/or speakers
  • exit the virtual meeting room and return
  • send a note to the presenters through the “chat” pod in the virtual meeting room

Continuing Education Units Available Through the Livestock and Poultry Environmental Learning Center

The Livestock and Poultry Environmental Learning Community offers continuing education units (CEUs) through our monthly webinar series. You can receive credits through one of two ways.

Certified Crop Advisers (CCA), Certified Professional Agronomist (CPAg), Certified Professional Soil Scientists (CPSS)

The webinars are submitted for national credit for CCA, CPSS, and CPAg.

American Registry of Professional Animal Scientists (ARPAS)

The webinars are submitted for national credit.

Technical Service Providers (TSPs)

The TSP program operates continuing education programs on a state-by-state basis. Many webinars are appropriate for continuing education for these organizations. We can provide attendance lists and information about the topic and presenters for those attending live webinars to submit to their state organization.

    • NRCS Technical Service Providers

Professional Engineers (PE)

The PE program operations continuing education programs on a state-by-state basis. Many webinars are appropriate for continuing education for these organizations. We can provide attendance lists and information about the topic and presenters for those attending live webinars to submit to their state organization. Contact information…

Software Requirements

To view a live webinar, all you need is a live Internet connection.

Archived webinars, produced October, 2007 and later are playable through your web browser. Real Player is needed to view LPE Learning Community Webinars produced between September, 2006 and September, 2007. If you do not already have Real Player, you can download a free player Real.com.

Software and Web-Based Resources for Nutrient Management

Why Utilize Tools for Nutrient Planning?

The process of nutrient management planning can be complex and time consuming. Doing a good job requires:

  • collecting and organizing extensive information about a farm;
  • making a diverse series of decisions and calculations about crops, fertilizer and manure management; and
  • communicating the completed plan to a multiple audiences including the farmer.

There is an expanding list of web-based and personal-computer-based tools that can help nutrient management planners write effective nutrient management plans. Some of these tools help with a specific element of the nutrient management process where others perform multiple parts of the process.

The objective of this page is to show some of the diversity in software tools that may be useful to nutrient management planners. The listing is not and cannot be comprehensive and will focus on tools that have a national audience. Some state-specific tools are included if they provide a particularly unique service or approach.

There are many state-specific tools. If you see a helpful resource on this site you may want to search for an analogous program developed in your region or state that may have more relevant supporting data integrated into the program. Links to state-specific nutrient management pages may be listed on State Specific Manure Nutrient Management Information.

Data Collection and General Information

  • Google Map provides aerial view of areas of interest and driving directions. A good place to get started.
  • University of Missouri National Data Finder. Download spatial and soils data needed to run RUSLE2, MMP and SNMP for any location in the U.S. Includes selected soils data and black and white georeferenced aerial photos (DOQ’s). Clip areas up to 10,000 acres.
  • University of Missouri Animal Feeding Operation Site Assessment Tool (AFO SITE): Available only for Missouri. Web-based application that produces a detailed site assessment evaluating the sites suitability for an animal feeding operation.
  • Web Soil Survey. Download tabular and spatial soils data for U.S. counties. Whole county data sets sent in an email.
  • NRCS Geospatial Gateway provides access to a diverse set of spatial layers. Cannot clip to area of interest so file sizes typically too large to download over the internet.
  • USDA National Agricultural Imagery Program provides georeferenced aerial photography of agricultural land taken during the growing season. The imagery is available for download as mosaicked DOQQ’s either individually or as compressed county images.

Nutrient Balance Calculators

Whole farm nutrient balance looks at all nutrient imports and exports on a farm and can be a useful tool to evaluate the nutrient status of a farm. Are there too many nutrients? Is the farm nutrient deficient?

  • University of Nebraska Nutrient Balance Calculator. A spreadsheet based calculator. The web site includes links to good supporting information.
  • Cornell University Nutrient Balance Calculator. A spreadsheet based calculator. The web site includes links to good supporting information.

Nutrient Management Software

This software helps the user through the many steps of completing a nutrient management plan. Many states have there own software including NC, NY, VA, and WI.

  • Purdue’s Manure Management Planner. The most complete multi-state software for writing nutrient management plans. Includes state-specific fertilizer recommendations, manure nutrient availability calculations and generates plans that meet national standards for USDA-NRCS and EPA. Automated links to SNMP for geographic information and to the record keeping program WinMax. A free stand alone program available for 34 states.

Economics of Manure Management

What is manure worth? This can be a complicated question to answer. These tools provide some help in making economic decisions about manure.

  • Feed Nutrient Management Planning Economics (FNMP$): a comprehensive program connecting feed ration characteristics, manure storage type and cropping systems impacts on the value of manure as a fertilizer. FNMP$ estimates: 1) manure nutrients, 2) land requirements, 3) labor and equipment application time, and 4) costs and value for land application. Spreadsheet-based program. Instructions for program.
  • University of Missouri Manure Value Spreadsheet A spreadsheet-based calculator of the fertilizer value of manure based on manure test results, crop fertilizer recommendations and fertilizer prices.
  • University of Minnesota What Is Manure Worth? spreadsheet.

Other Tools and Resources

  • Spatial Nutrient Management Planner (SNMP): an ArcView 3.x program that facilitates delineating farm fields, mapping setbacks and soil test levels and calculating field sizes and spreadable acres. Available for all states. Links automatically to MMP. An ArcView 9.x version to be released soon.
  • Revised Universal Soil Loss Equation ver. 2 (RUSLE(2)): Used by USDA-NRCS to estimate edge-of-field erosion losses. Complicated to get started and not fully intuitive to use. The good news is that it will soon be fully integrated into MMP.
  • NRCS eFOTG (electronic Field Office Technical Guide: This is not software, but this website has links to conservation standards such as Nutrient Management (590) and Waste Utilization (633) for every state. Search in section IV under “Conservation Practices”.
  • Phosphorus Index: There is no national P index. Instead individual states have developed P indexes that meet the needs of their state. Look for information about the P index through the state NRCS office or Land Grant University.
  • Animal Waste Management (AWM) software: Facilitates sizing of manure storage facilities for animal feeding operations. Estimates the volume of manure, waste water and solids generated by animals in confinement. Does not address state-specific requirements. Some states have state-specific programs. To view a tutorial on using this software, see Animal Waste Management Software Training Video

If there is web page or software program you would like to have included on this webpage please contact John Lory.

Author: John Lory, University of Missouri, loryj@missouri.edu
Reviewers: Rick Koelsch, University of Nebraska and Rich Meinert, University of Connecticut

Calculating Manure Application Rate

How much manure can I apply to this field? is a common question when developing a nutrient management plan for the upcoming year. This type of planning allows a farmer to ensure there is enough crop land available to adequately use manure nutrients, plan for manure storage emptying, or estimate commercial fertilizer needs to take advantage of lower pricing. Manure is a very good source of nutrients for plants and organic matter for soils. These nutrients have significant value if managed properly. This page describes the information needed to make these calculations. While the process may seem complicated, it is not difficult and provides an easy template to follow in future years.

How Many Nutrients Will the Crop Use?

The starting point for determining manure application is to calculate the amount of nutrients, especially nitrogen (N) and phosphorus (P), expected to be used by that year’s crop. To find the values recommended for your area, do a web search for “crop nutrient uptake” or “crop nutrient removal” plus your state’s name. If your search turns up empty, contact your local extension service for assistance. The following pieces of information are usually needed to use your state crop nutrient tables.

  • What is the crop to be grown?
  • What is the soil type in the field? (Not needed in all states.)
  • What is the expected yield for this crop?

A realistic yield can be determined by taking the 5-year average yield for this field and crop and add 10% (some states may recommend a different factor to add) to account for improvements in hybrids and farming techniques. If the 5-year average includes a disaster or exceptionally low yield due to hail, flooding, or similar situation, remove that year from the calculation. The crop nutrient uptake tables for your state will usually provide a factor to calculate nutrient need of the crop based on the expected yield.

Nitrogen Credits from Legumes and Past Manure Application

Organic-nitrogen from past legume crops or past manure applications continues to mineralize into crop-available nitrate-nitrogen for several years. To estimate how much nitrogen will become available from past manure or compost applications, see “Estimating Crop Nutrient Availability of Manure and Other Organic Nutrient Sources“. Legume credits recommended for your state can be found by doing a web search for “legume credit” plus your state name.

What Level of Plant Available Nutrients Are Already Present In the Soil?

In addition to organic-nitrogen that may be already present in soils, there may be plant-available nitrate-nitrogen already present. The best way to determine this is to do a soil nitrate test. To find recommended procedures and labs in your state, do a web search for “soil testing” plus your state name.

Phosphorus and potassium form past manure applications are mostly plant-available right away. If overapplied year after year (as can be the case with a field that receives repeated manure applications) the levels will build up over time. For phosphorus, this is a concern because of the potential for runoff to water. In some states, soils with extremely high phosphorus levels may be off-limits for further manure application (due to the relatively high phosphorus content of manure in comparison to nitrogen). Most states have developed a phosphorus index which is a risk management tool for avoiding fields or situations with greater potential for phosphorus runoff to water. If you are concerned that some of your fields fall into this category, see “What is the P Index?

How Many Nutrients Are In the Manure?

Manure is highly variable from farm to farm. The nutrient content changes based on how is the manure collected, stored, and treated. It also varies by animal species. When doing pre-season planning, the best indicator of nutrient content in the manure is to look at past manure tests from your own farm. If you are doing your nutrient planning close to the time manure will be land-applied, then sampling manure in your storage will provide good information. As a last resort, planning can be done using “book values” or averages based on research and testing done in your state (do a web search for “manure book values” plus your state name).

It is impossible for plants to use applied nutrients with 100% efficiency, regardless if source is animal manures or commercial fertilizers. Studies have shown that nutrient use efficiency for nitrogen ranges from 30% to 75%, and is dependent on the crop, the specific nutrient, weather, and many other environmental factors. The goal of a nutrient management planner and waste applicator is to obtain the best use of the manure nutrients. This requires intensive management.

Nutrient Management Planning

Nutrient management guidance is typically done at the state level. General guidance may be available at a regional or national level from USDA Natural Resources Conservation Service (NRCS). You can also seek the advice of a local expert who is with the Cooperative Extension Service, land grant institution, state department of agriculture, or the state regulatory agency to obtain manure nutrient generation values relevant to the area, specieds, and system you are working with.

Tables that offer production volumes for manure as well as manure nutrient concentration are available for planning purposes, but should not be used to determine application rates on a daily basis. Frequent manure sampling is the only way to make a good assessment of manure nutrient value. Then, with data that relates to loss potential as it relates to manure application method and timing, one can make good recommendations as to appropriate application rates that assure maximum crop use efficiency and minimize losses.

Author: Karl Shafer, North Carolina State University