
Purpose
Plastic pollution remains a pervasive environmental challenge and identifying economically viable alternatives is imperative. While regulatory efforts primarily target plastic bags, recent research highlights consumer acceptance of biodegradable alternatives across various product categories, including plant pots. However, much of the existing literature relies on estimates for “willingness-to-pay” (WTP) of certain products—according to their attributes—by using survey-based data of potential spending, which may not reflect actual market purchase behavior. This study connects hypothetical WTP survey data with observed market transactions from consumer panel data with the goal of better assessing the market of biodegradable pots.
What Did We Do?
Our analysis focuses on plastic pot store purchases recorded in the NielsenIQ consumer (transaction) panel data from 2006 to 2009. To ensure compatibility with results from a recent study of survey-derived WTP estimates, we restricted the sample to households purchasing a single plastic pot per month. Price purchase data is inflation-adjusted to 2024 values using U.S. Bureau of Labor Statistics (BLS) consumer price index data, updating the purchasing power to that of corresponding survey-based data. Given the limited number of scanner-based purchases (113 observations), we employed bootstrapping—a statistical technique that generates additional observations by repeatedly sampling from the original dataset—to augment the dataset to 471 transactions in order to meet the number of survey data observations.
A new price variable (composite price variable) was constructed by taking random market prices and adding random WTP survey data observations. These new prices and their dynamics represent increases in monthly expenditure. We incorporated key product attributes in our model; see details in Table 1 to analyze their effect. Attributes include different periods of biodegradability duration, the type of plastic product targeted by policy or regulation (single use food containers, packaging products, grocery bags, or all single-use products), and the type of bioproduct used (animal waste, agricultural waste, or wood waste feedstock). We estimated a conditional logit model using Stata, which allowed us to compare how consumers valued different options having several product attributes or features—including timespan for biodegradability and type of biodegradable material—when making purchasing decisions.

Source: Field, 2024
For the survey implementation, respondents are presented with three options each containing a randomly generated combination of four attributes and can select one option from three given options. A sample shown in Figure 1.
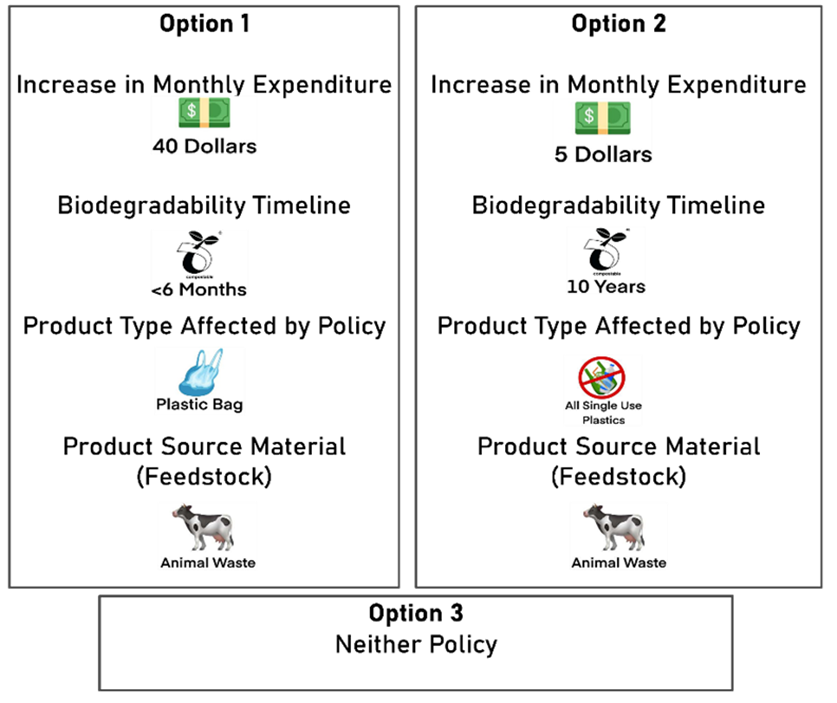
Source: Field, 2024
What Have We Learned?
| VARIABLES | Parameter Estimates | |
|---|---|---|
| Previous Price, Increase in Expenditure (X0) | -0.014*** (0.0012) |
|
| New Price, Increase in Expenditure (X1) | -0.013*** (0.0012) |
|
| Time to Fully Biodegrade in years (X2) | -0.003*** (0.0007) |
-0.004*** (0.0007) |
| Policy targeting: | ||
| (i) Single Use Packaging Products (X3) | 0.067 (0.0824) |
0.112 (0.0833) |
| (ii) Single Use Food Containers (X4) | 0.027 (0.0782) |
0.132* (0.0782) |
| (iii) All Single Use Products (X5) | 0.199** (0.0888) |
0.292*** (0.0842) |
| Product source: | ||
| (i) Animal Waste Feedstock (X6) | -0.010 (0.0681) |
-0.034 (0.0714) |
| (ii) Wood Waste Feedstock (X7) | 0.015 (0.0661) |
0.025 (0.0667) |
| Neither Option 1 or Option 2 Policy choice (X8) | -1.302*** (0.1110) |
-1.604*** (0.1100) |
| Observations | 8,478 (471) | 8,478 (471) |
Column 2 shows estimate of attribute effects from combining transaction and survey WTP data, while Column 3 shows prior survey-based estimates of attribute effects. X₁ represents the New Price Variable in our analysis, while X0 corresponds to the increase in monthly expenditure in survey data analysis. Robust standard errors in parentheses. Asterisks indicate: *** p<0.01, ** p<0.05, * p<0.1
| VARIABLES | WTP (n = 471) | WTP (n = 471) |
|---|---|---|
| Time to Fully Biodegrade (years) | -0.23 | -0.26 |
| Policy targeting: | ||
| (i) Single Use Packaging Products | 5.15 | 7.97 |
| (ii) Single Use Food Containers | 2.08 | 9.46 |
| (iii) All Single Use Products | 15.31 | 20.86 |
| Product Source: | ||
| (i) Animal Waste Feedstock | -0.77 | -2.44 |
| (ii) Wood Waste Feedstock | 1.15 | 1.76 |
Column 2 shows WTP estimates from combining transaction and survey WTP data, while Column 3 shows prior survey-based WTP estimates. All WTP estimates are in USD ($). n represents the total number of observations. Figures in bold represent significance at 5%.
Future Plans
We will incorporate demographic variables into the econometric model to examine how WTP varies across different consumer groups. Producers of biodegradable pots should consider WTP estimates across attributes in their feasibility assessment. Notably, each additional year of biodegradability decreases WTP by $0.23 per month, suggesting a preference for faster decomposition. Meanwhile, consumers exhibit no significant difference in WTP based on whether the bioproduct source is agricultural feedstock, animal waste, or wood waste, indicating flexibility in material choice.
Authors
Presenting & Corresponding author
Sanket Parajuli, Applied Economics Graduate Research Assistant, Department of Agricultural Economics and Rural Sociology, University of Idaho, Para5126@vandals.uidaho.edu
Additional author
Hernan Tejeda, PhD., Associate Professor and Extension Specialist, Department of Agricultural Economics and Rural Sociology, University of Idaho
Additional Information
Field, C. T. (2024). Greenbacks and grazing gambles: Exploring plastic preferences and pasture predicaments in two acts (Master’s thesis, University of Idaho).
U.S. Bureau of Labor Statistics. (2025). Consumer price index data. U.S. Department of Labor. Retrieved February 1, 2025, from https://www.bls.gov/cpi/data.htm
Acknowledgements
We thank USDA NIFA Sustainable Agricultural Systems project IDA02004-CG (Award No. 2020-69012-31871) for supporting this research. We also acknowledge the Kilts Center for Marketing Data Center at the University of Chicago Booth School of Business for providing access to NielsenIQ datasets. The conclusions drawn from the NielsenIQ data are those of the researcher(s) and do not reflect the views of NielsenIQ. NielsenIQ is not responsible for, had no role in, and was not involved in analyzing and preparing the results reported herein.
The authors are solely responsible for the content of these proceedings. The technical information does not necessarily reflect the official position of the sponsoring agencies or institutions represented by planning committee members, and inclusion and distribution herein does not constitute an endorsement of views expressed by the same. Printed materials included herein are not refereed publications. Citations should appear as follows. EXAMPLE: Authors. 2025. Title of presentation. Waste to Worth. Boise, ID. April 7–11, 2025. URL of this page. Accessed on: today’s date.