About the Participating Farms
| Take Home Message |
| Thirteen swine farms demonstrated significantly better nutrient management over previous studies as measured by Whole Farm Nutrient Balance. Feed program for phosphorus, manure storage selection, and nutrient plan implementation proved to be the most critical factors. |
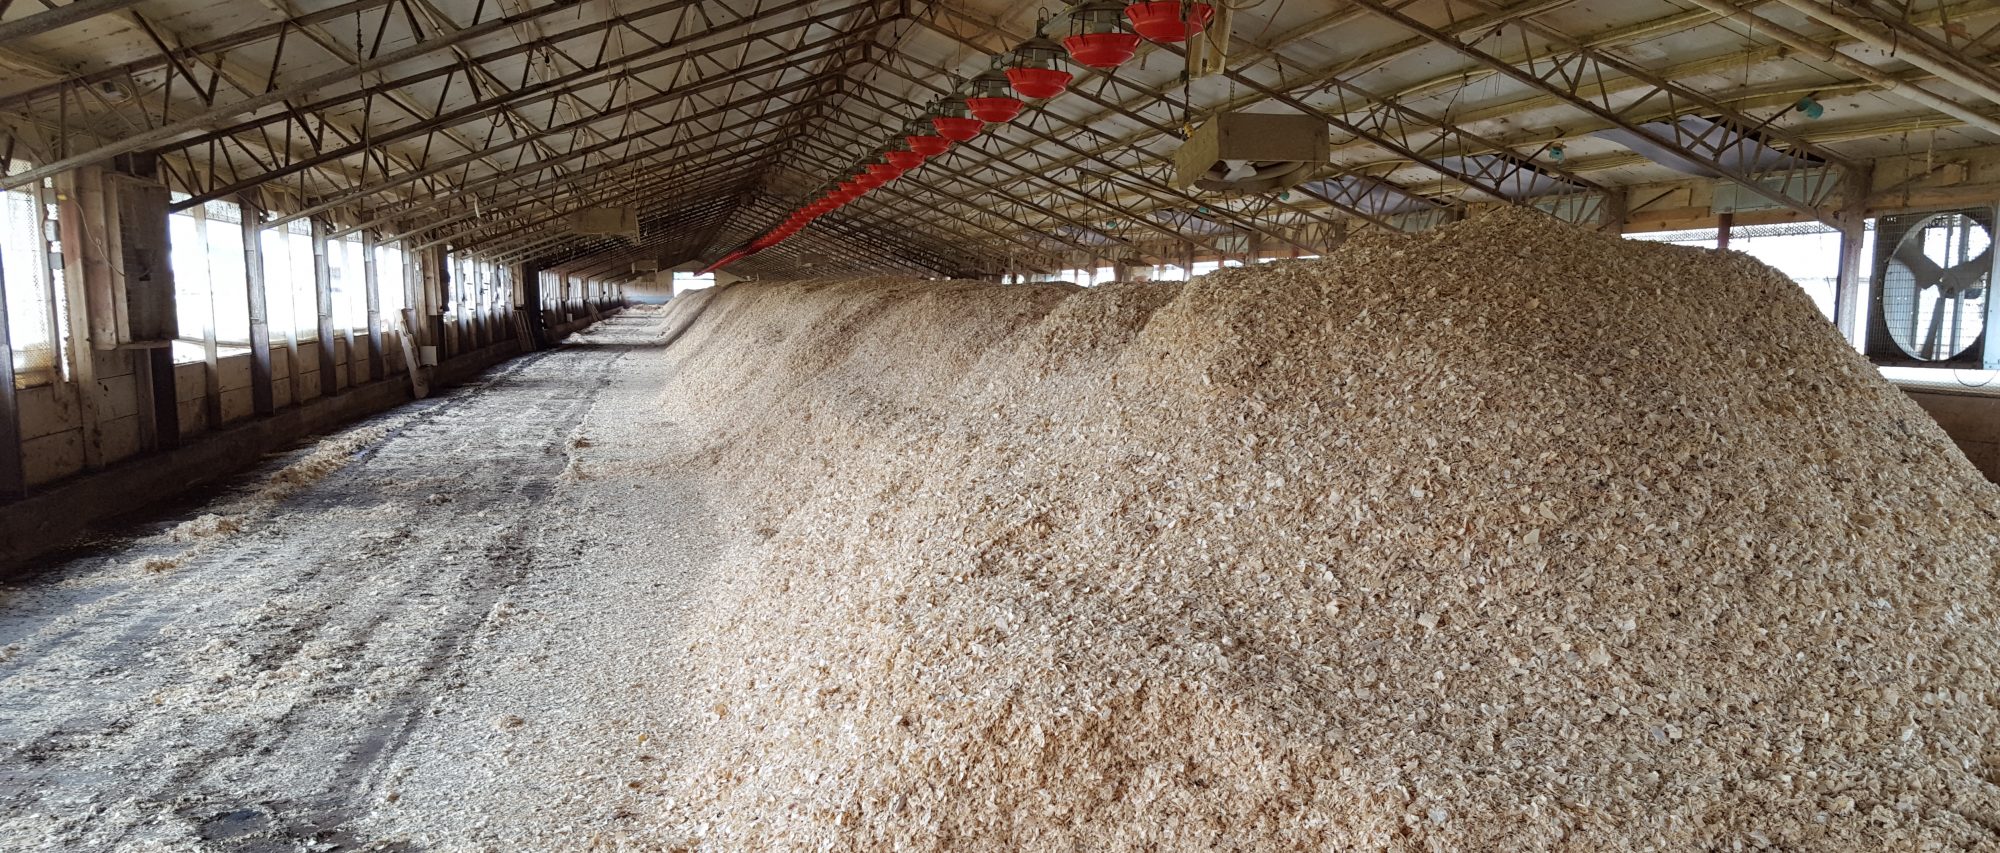
Thirteen pork production facilities in Indiana, Iowa, and Nebraska were engaged in defining their whole farm nutrient balance (WFNB) for two one-year periods (2006 and 2007). The average balance observed for these farms is reported in Figure 1 with the results of individual farms summarized in Appendix A (2006) and B (2007). These farms ranged in size from 2,000 to 16,000 head finishing capacity with most farms being wean to finish or feeder pig to finish. Two farms included sow facilities. Most farms included a crop production component ranging from 0 to more than 2000 acres. All but two farms were operated by individual families. Eight farms operated a contract swine operation, four were independent and one was an integrated operation.
Information was collected and analyzed independently for 2006 and 2007. While information was shared with producers at the end of 2006, no effort was made to encourage farm management or practice changes by the participating farms. Procedures used for collecting data in 2006 were discussed with farms at the end of 2006 and, if appropriate, modified procedures were implemented in 2007 for data collection only. In all cases, those modified procedures were also applied to the 2006 results.
WFNB Results
On average, 1.5 lbs of nitrogen entered these 13 farms from off-farm sources (Inputs – see green arrow in Figure 1) for every 1 lb of nitrogen leaving as Managed Outputs (see yellow arrow in Figure 1). This ratio ranged from 1.1 to 2.5 lbs input per 1lb managed outputs. Feed was the single largest source of inputs on average (79% of all inputs) followed by fertilizer (11%). Animals, legume fixed nitrogen, and nitrates in irrigation water accounted for the remaining 10%.
On average, phosphorus input to managed output ratio was 1.5 to 1 with a range of 0.8 – 3.3 lbs input to 1 lb managed output for the 25 farm-years of data collected (13 in 2006 and 12 in 2007). Again feed represented the single largest off-farm source of phosphorus (85%) with fertilizer and animals accounting for the remaining phosphorus inputs.
Critical Control Points
An analysis of several critical control points have been reviewed from the results of WFNB for these 13 farms. Based upon these reviews it is our conclusion that the following factors are the most critical control points for avoiding excess accumulations of nutrients on farm or losses from farms:
- Phosphorus in purchased feeds.
- Type of manure storage system.
- Implementation of manure nutrient management plan.

The results also suggest that some additional factors will influence WFNB and the resulting accumulation of and loses from farms:
Finally the results provide insights that the following factors have little or no influence on WFNB and the resulting accumulation of and losses from farms:
Comparison to Other Species
The WFNB has been applied primarily to dairy farms in previous research. Spears et al. (2003) conducted whole-farm nitrogen balances on 41 Western dairy farms. On average 2.8 lbs of Nitrogen entered the farm for every pound leaving as a managed output. Castillo et al. (2000) estimated whole-farm nitrogen balances from European dairy farms to range from 1.2 – 2.3 to 1. Studies conducted prior to most nutrient management planning efforts also revealed relatively high whole farm imbalances. Fox (et al, 1994) reported whole farm balances for five dairies that ranged from 2.6 – 4.2 to1 (nitrogen) and 2.4 – 4 to 1 (phosphorus). Koelsch (2005) reviewed whole farm nutrient balances on 33 beef finishing and swine farms from 1996. Nitrogen balance ranged from 0.8 – 4.0 to 1 and phosphorus balance from 0.5 – 4.8 to 1.
WFNB values observed in previous research was significantly higher than observed with the 13 swine farms. This may be explained in part by the degree of implementation of nutrient plans, the utilization of feeding technologies such as the use of dietary phytase, and the degree of integration of animal and crop production into the same farm. In general, the results of the swine operations that participated in this study suggest significantly better nutrient management over previous studies.
Literature
Castillo AR, Kebreab E, Beever DE, France J. 2000. A review of efficiency of nitrogen utilization in dairy cows and its relationship with environmental pollution. J Anim Feed Sci 9:1–32.
Koelsch R. 2005. Evaluating livestock system environmental performance with whole-farm nutrient balance. J Environ Qual 34:149–55.
Spears, RA, Kohn RA, Young AJ. 2003. Whole-farm nitrogen balance on Western dairy farms. J Dairy Sci 86:4178–86.
Klausner, S. 1995. Nutrient management planning. p. 383–392. In K. Steele (ed.) Animal waste and the land-water interface. Lewis Publ., New York.
Results of On-Farm Measurement of WFNB
Return to Introductory Page for WFNB Resources
Authors: Rick Koelsch, University of Nebraska; Joe Lally, Iowa State University; Alan Sutton, Purdue University
This project was funded by The National Pork Board Project

