
Animals excrete a lot of nitrogen as they grow with a large fraction escaping into the air as ammonia. What happens to that ammonia, and can we predict how that excess nitrogen might be beneficial to nearby crop production? This webinar will present pilot-scale research for manure and food waste treatment. This presentation was originally broadcast on May 16, 2025. Continue reading “A USDA multi-location project monitoring ammonia deposition near animal production sites”
Energy Conservation in Livestock and Poultry Operations
To be sustainable, producers need to conserve energy while still maintaining or improving their facilities and the lives of the animals they house. This presentation was originally broadcast on December 15, 2023. Continue reading “Energy Conservation in Livestock and Poultry Operations”
Weeding the Worries Out of Manure Use
This webinar focuses on on adoption of place-based conservation practices to improve water quality. This presentation was originally broadcast on November 19, 2021. Continue reading “Weeding the Worries Out of Manure Use”
Industry Initiatives for Environmental Sustainability – a Role for Everyone
This webinar introduces current and future industry-based initiatives for environmental sustainability in the livestock and poultry sector, and how Livestock and Poultry Environmental Learning Community learners can play a critical role in their region. This presentation was originally broadcast on September 17, 2021. Continue reading “Industry Initiatives for Environmental Sustainability – a Role for Everyone”
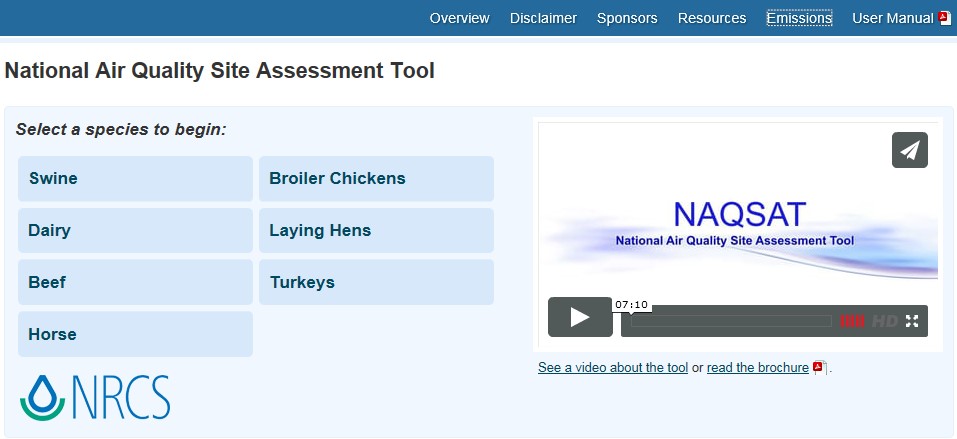
USDA-NRCS and the National Air Quality Site Assessment Tool (NAQSAT) for Livestock and Poultry Operations
Proceedings Home | W2W Home 
Purpose
The National Air Quality Site Assessment Tool (NAQSAT) was developed as a first-of-its-kind tool to help producers and their advisors assess the impact of management on air emissions from livestock and poultry operations and identify areas for potential improvement related to those air emissions.
What did we do?
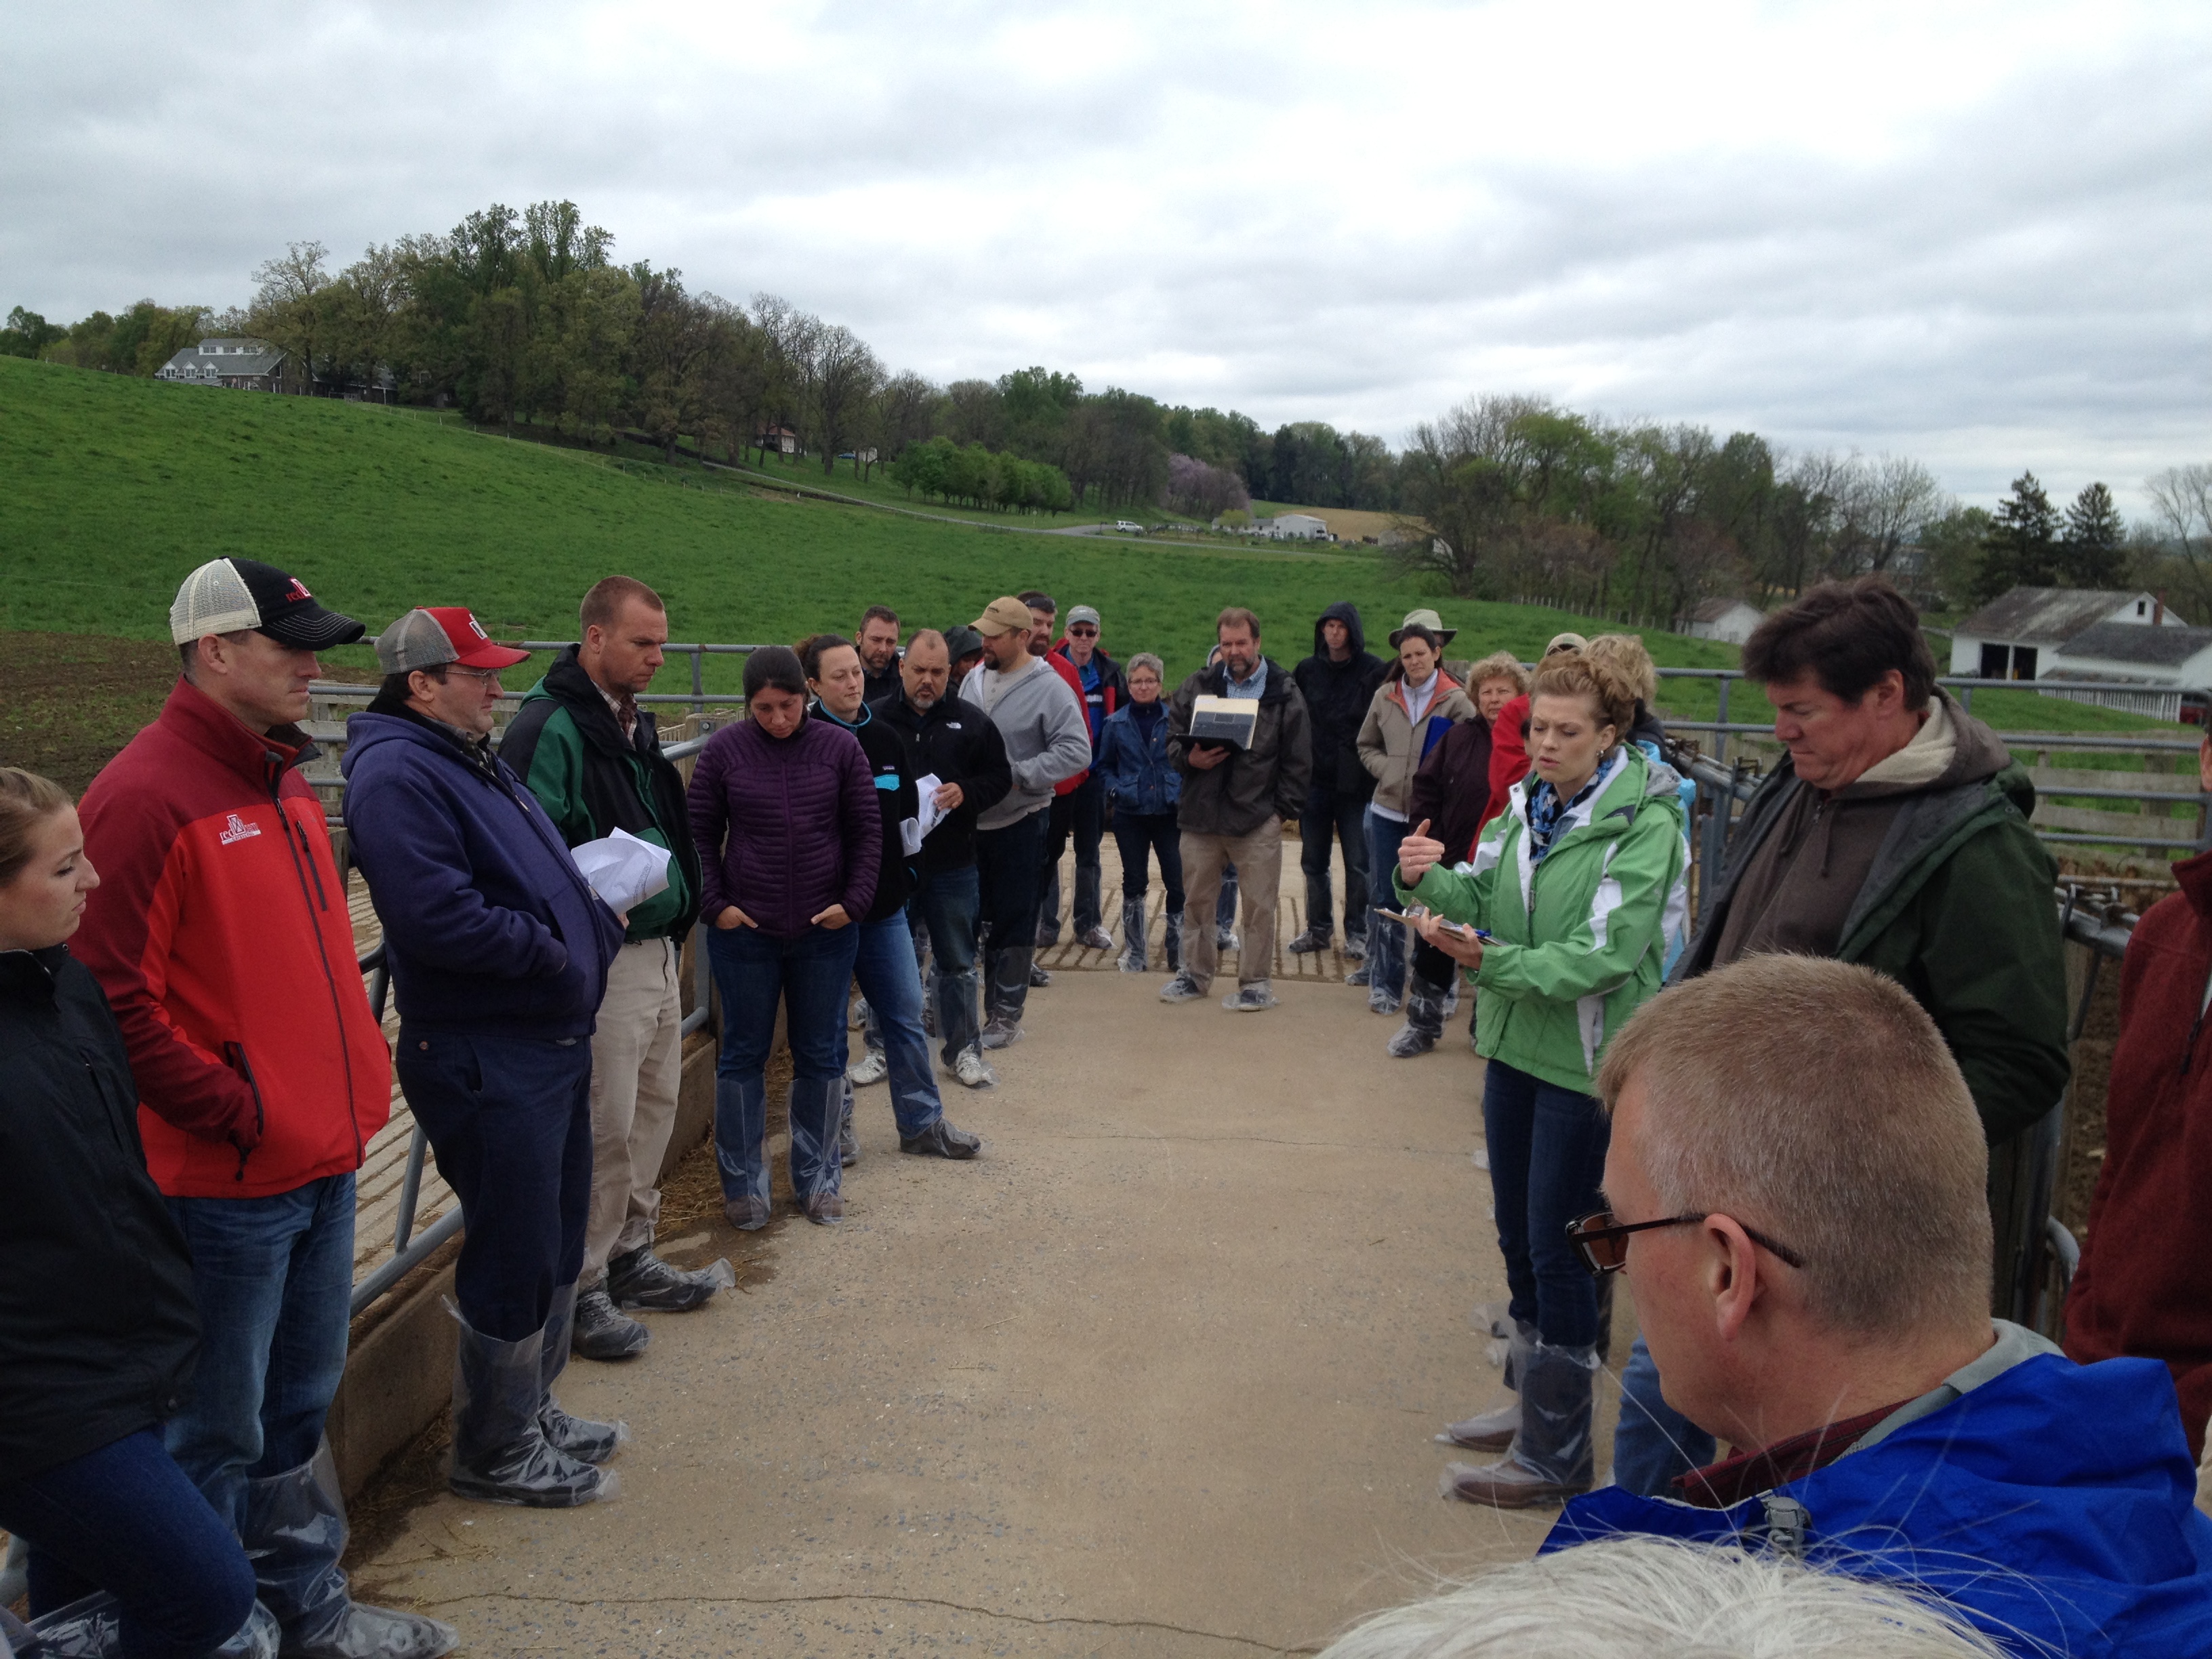
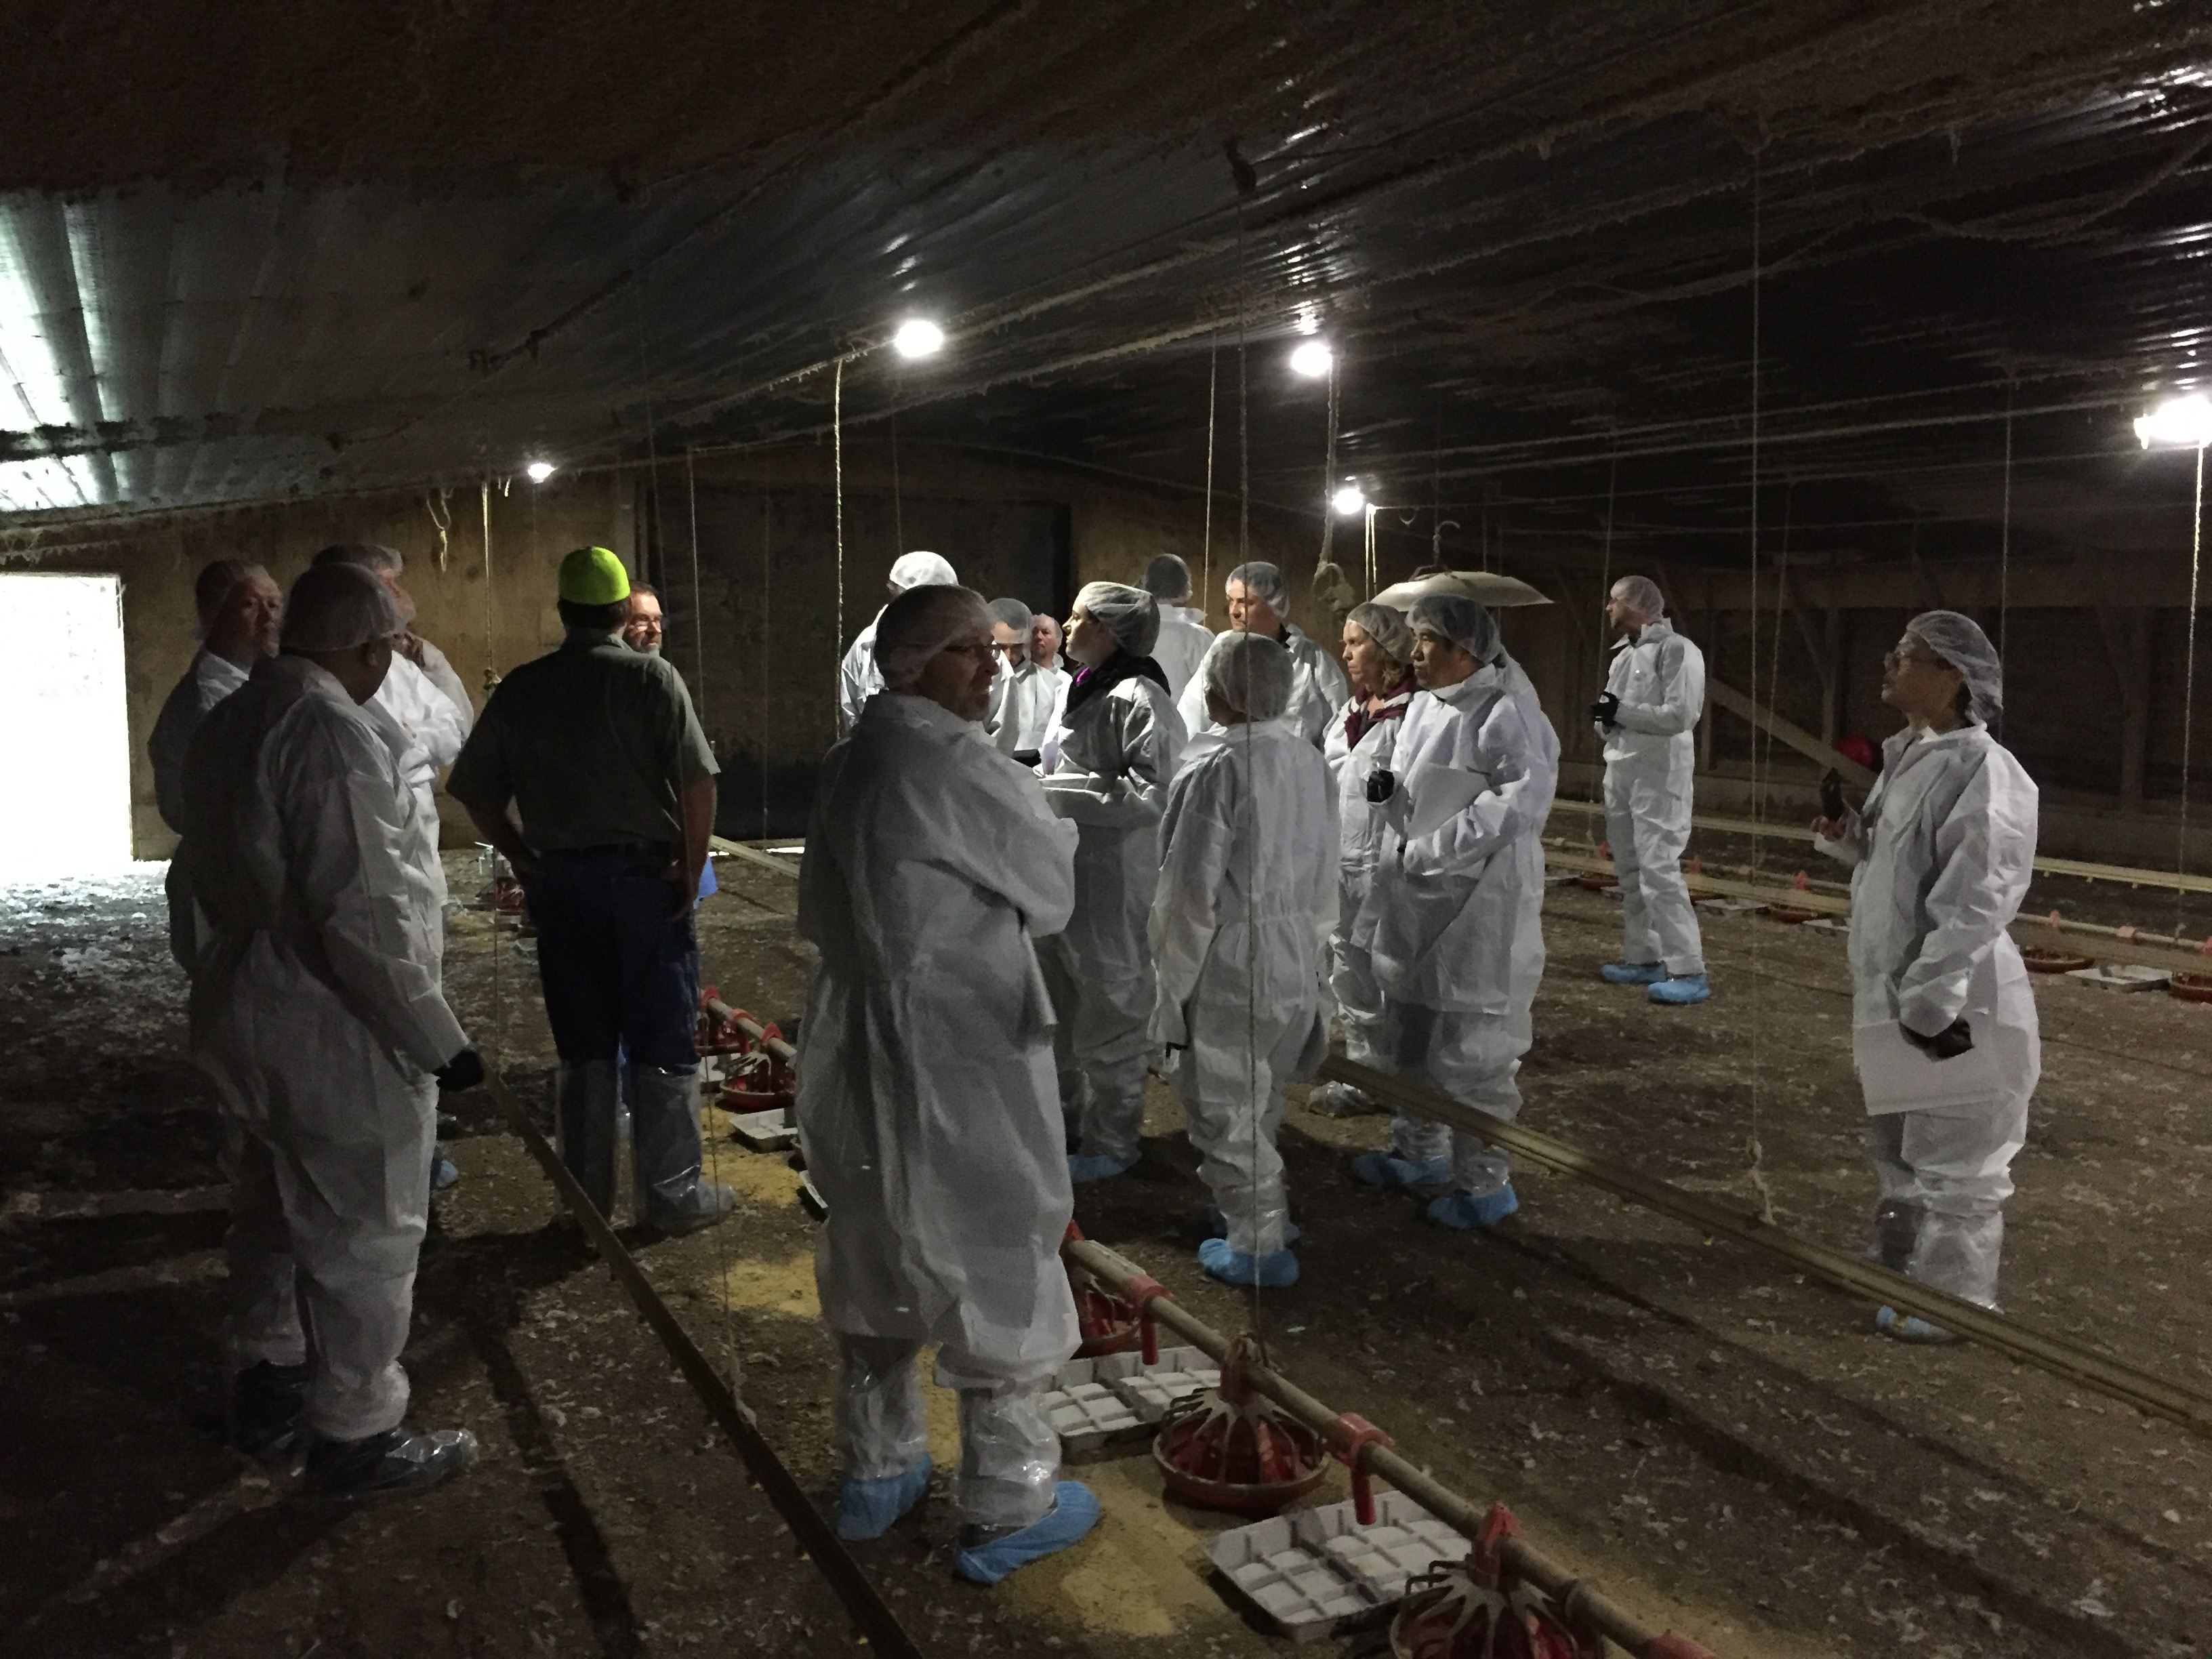
In 2007, several land-grant universities, with leadership from Michigan State University, began developing NAQSAT under a USDA-NRCS Conservation Innovation Grant (CIG). The initial tool included beef, dairy, swine, and poultry operations. A subsequent CIG project, with leadership from Colorado State University, made several enhancements to the tool, including adding horses to the species list. In 2015, USDA-NRCS officially adopted NAQSAT as an approved tool for evaluating air quality resource concerns at livestock and poultry operations. USDA-NRCS also contracted with Florida A&M University in 2015 to provide several regional training workshops on NAQSAT to NRCS employees. Six training workshops have been completed to date (Raleigh, NC; Modesto, CA; Elizabethtown, PA; Lincoln, NE; Richmond, VA; and Yakima, WA) with assistance from multiple NAQSAT development partners. Additionally, USDA-NRCS revised its comprehensive nutrient management plan (CNMP) policy in October 2015 to make the evaluation of air quality resource concerns mandatory as part of CNMP development.

What have we learned?
NAQSAT has proven to be a useful tool for bench-marking the air emissions impacts of current management on confinement-based livestock and poultry operations. In the training sessions, students have been able to complete NAQSAT runs on-site with the producer or producer representative via tablet or smartphone technologies. Further classroom discussion has helped to better understand the questions and answers and how the NAQSAT results can feed into the USDA-NRCS conservation planning process. Several needed enhancements and upgrades to the tool have been identified in order to more closely align the output of the tool to USDA-NRCS conservation planning needs. NAQSAT has also proven to be useful for evaluating the air quality resource concern status of an operation in relation to the CNMP development process.
Future Plans
It is anticipated that the identified needed enhancements and upgrades will be completed as funding for further NAQSAT development becomes available. Additionally, as use of NAQSAT by USDA-NRCS and our conservation planning and CNMP development partners expands, additional training and experience-building opportunities will be needed. The NAQSAT development team has great geographic coverage to assist in these additional opportunities.
Corresponding author, title, and affiliation
Greg Zwicke, Air Quality Engineer – Air Quality and Atmospheric Change Team, USDA-NRCS
Corresponding author email
Other authors
Greg Johnson, Air Quality and Atmospheric Change Team Leader, USDA-NRCS; Jeff Porter, Animal Nutrient and Manure Management Team Leader, USDA-NRCS; Sandy Means, Agricultural Engineer – Animal Nutrient and Manure Management Team, USDA-NRCS
Additional information
naqsat.tamu.edu
https://lpelc.org/naqsat-for-swine-and-poultry
https://lpelc.org/naqsat-for-beef-and-dairy/
Acknowledgements
C.E. Meadows Endowment, Michigan State University
Colorado Livestock Association
Colorado State University
Florida A&M University
Iowa Turkey Federation
Iowa Pork Producers
Iowa Pork Industry Center
Iowa State University
Iowa State University Experiment Station
Kansas State University
Michigan Milk Producers Association
Michigan Pork Producers Association
Michigan State University
Michigan State University Extension
National Pork Board
Nebraska Environmental Trust
Oregon State University
Penn State University
Purdue University
Texas A&M University
University of California, Davis
University of Georgia
University of Georgia Department of Poultry Science
University of Idaho
University of Maryland
University of Maryland Department of Animal and Avian Sciences
University of Minnesota
University of Missouri
University of Nebraska
USDA-ARS
Virginia Tech University
Washington State University
Western United Dairymen
Whatcom County (WA) Conservation District
The authors are solely responsible for the content of these proceedings. The technical information does not necessarily reflect the official position of the sponsoring agencies or institutions represented by planning committee members, and inclusion and distribution herein does not constitute an endorsement of views expressed by the same. Printed materials included herein are not refereed publications. Citations should appear as follows. EXAMPLE: Authors. 2017. Title of presentation. Waste to Worth: Spreading Science and Solutions. Cary, NC. April 18-21, 2017. URL of this page. Accessed on: today’s date.
Nitrogen and Phosphorus Cycling Efficiency in US Food Supply Chains – A National Mass-Balance Approach
Proceedings Home | W2W Home 
Purpose
Assessing and improving the sustainability of livestock production systems is essential to secure future food production. Crop-livestock production systems continue to impact nitrogen (N) and phosphorus (P) cycles with repercussions for human health (e.g. secondary particle formation due to ammonia emission and drinking water contamination by nitrate) and the environment (e.g. eutrophication of lakes and coastal waters and exacerbation of hypoxic zones). Additionally, P is a limited resource, and sustaining an adequate P supply is a major emerging challenge. To develop strategies for a more sustainable use of N and P, it is essential to have a quantitative understanding of the flows and stocks of N and P within the society. In this study, we developed detailed national N and P budgets to assess nutrient cycling efficiency in US (livestock) food supply chains, to identify hotspots of nutrient loss and to indicate opportunities for improvement!
What did we do?
1. National nutrient mass-balance
A mass-balance framework was developed to quantify nutrient flows within the US. In this framework, the national US system is represented by 9 major sectors are relevant in terms of nutrient flows: mining (relevant for P only), industrial production, agriculture, food & feed processing industry, retail, households and other consumers, energy and transport, humans, and waste treatment. These sectors can exist of several sub-sectors. For example, the agricultural sector consists of several secondary sub-systems including pasture, agricultural soil, livestock and manure management (WMS – waste management system).
Different livestock categories can have distinct environmental impacts and nutrient use efficiencies (e.g. (Hou et al. 2016), (Eshel et al. 2014), (Herrero et al. 2013)), we therefore distinguish six livestock categories (dairy cattle, beef cattle, poultry (meat), poultry (layers), sheep, hogs) and
their associated food commodities (dairy products, beef from dairy cattle, beef, poultry, eggs, lamb, pork).
For each sub-system, we identify and quantify major flows to and from this compartment. All flows are expressed in a common unit, i.e. metric kiloton N per year (kt N/yr) for nitrogen and metric kiloton P per year (kt P/yr) for phosphorus. Quantified flows include nutrient related emissions to the environment and waste flows.
At present, the waste sectors and environmental compartment are outside the system boundaries, that is, we quantify flows to these compartments, but we do not attempt to balance these sectors. We do, however, keep track of the exact chemical species (e.g. emission of N2O-N to air instead of N to air) emitted as far as possible. The municipal waste treatment (MSW) and municipal waste water treatment (WWTP) are treated in more detail: major flows from and to these compartments are quantified. These sub-sectors are treated in more detail because of their role in nutrient recycling through e.g. sewage sludge application on agricultural soils.
Data were collected in priority from national statistics (e.g. USDA NASS for livestock population) and peer-reviewed literature, and were supplemented with information from industrial reports and extension files if needed. If available, data were collected for the years 2009 to 2012 and averaged, when unavailable, we collected data for the closest year.
2. Scenario analysis
In the scenario analysis, we test the opportunity for dairy livestock production systems to contribute to a more efficient nutrient use through anaerobic co-digestion of dairy manure and organic food waste. Recently, Informa Economics assessed the national
market potential of anaerobic digester products for the dairy industry (Informa Economics 2013). Next to a reduction in greenhouse gas emissions, anaerobic co-digestion of dairy manure and organic food waste can contribute to improve nutrient cycling efficiency (Informa Economics 2013). Dairy manure contains high levels of nitrogen and phosphorus, which can be used as a natural crop fertilizer, if recuperated from manure. Presently, non-farm organic substrates such as food waste are typically disposed of in landfills, which causes greenhouse gas (GHG) emissions and also results in a permanent removal of valuable nutrients from the food supply chain (Informa Economics 2013). By anaerobic co-digestion, a part of the nutrien! ts contai ned in dairy manure and food waste can be recovered. These nutrients can be used to fertilize crops and substitute synthetic fertilizer application. In the scenario analysis, we test to what extent anaerobic co-digestion of dairy manure and food waste can contribute to improve nutrient cycling efficiency, particularly by substituting synthetic fertilizers. We develop the scenario based on data provided in the InformaEconomics report.
What have we learned?
In general, our results show that livestock production is the least efficient part of the total food supply chain with large losses associated with manure management and manure and fertilizer application to crops. In absolute terms, the contribution of the household stage to total and N and P losses from the system is small, approximately 5 and 7% for N and P, respectively. However, households ‘waste’ a relatively large percentage of purchased products, (e.g. 16% and 18% of N and P in dairy products end up as food waste), which presents an opportunity for improvement. A scenario was developed to test to what extent anaerobic co-digestion of dairy manure and food waste can contribute to improving nutrient cycling efficiency on a national scale. Results suggest that 22% and 63% of N and P applied as synthetic fertilizer could potentially be avoided in dairy food supply chains by large scale implementation of anaerobic co-digestion o! f manure and food waste.
Future Plans
Future research plans include a further development of scenarios that are known to reduce nutrient losses at the farm scale and to assess the impact of these scenarios on national nutrient flows and losses.
Corresponding author, title, and affiliation
Karin Veltman, PhD, University of Michigan, Ann Arbor
Corresponding author email
Other authors
Carolyn Mattick, Phd, Olivier Jolliet, Prof., Andrew Henderson, PhD.
Additional information
Additional information can be obtained from the corresponding author: Karin Veltman, veltmank@umich.edu
Acknowledgements
The authors wish to thank Ying Wang for her scientific support, particularly for her contribution in developing the anaerobic co-digestion scenario.
This work was financially supported by the US Dairy Research Institute.
The authors are solely responsible for the content of these proceedings. The technical information does not necessarily reflect the official position of the sponsoring agencies or institutions represented by planning committee members, and inclusion and distribution herein does not constitute an endorsement of views expressed by the same. Printed materials included herein are not refereed publications. Citations should appear as follows. EXAMPLE: Authors. 2017. Title of presentation. Waste to Worth: Spreading Science and Solutions. Cary, NC. April 18-21, 2017. URL of this page. Accessed on: today’s date.
Planning for Resilience: Using Scenarios to Address Potential Impacts of Climate Change for the Northern Plains Beef System
Proceedings Home | W2W Home 
Purpose
Resiliency to weather extremes is a topic that Northern Plains farmers and ranchers are already familiar with, but now climate change is adding new uncertainties that make it difficult to know the best practices for the future. Scenario planning is a method of needs assessment that will allow Extension and beef system stakeholders to come together using the latest climate science to discover robust management options, highlight key uncertainties, prioritize Extension programming needs, and provide an open forum for discussion for this sometimes controversial topic.
Overall objectives:
1. Determine a suite of key future scenarios based on climate science that are plausible, divergent, relevant, and challenging to the beef industry.
2. Determine robust management options that address the key scenario drivers.
3. Develop a plan for Extension programming to address determined educational needs.
What did we do?
A team of researchers, Extension specialists, and educators was formed with members from University of Nebraska and South Dakota State University. They gathered the current research information on historical climate trends, projections in future climate for the region, and anticipated impacts to the beef industry. These were summarized in a series of white papers.
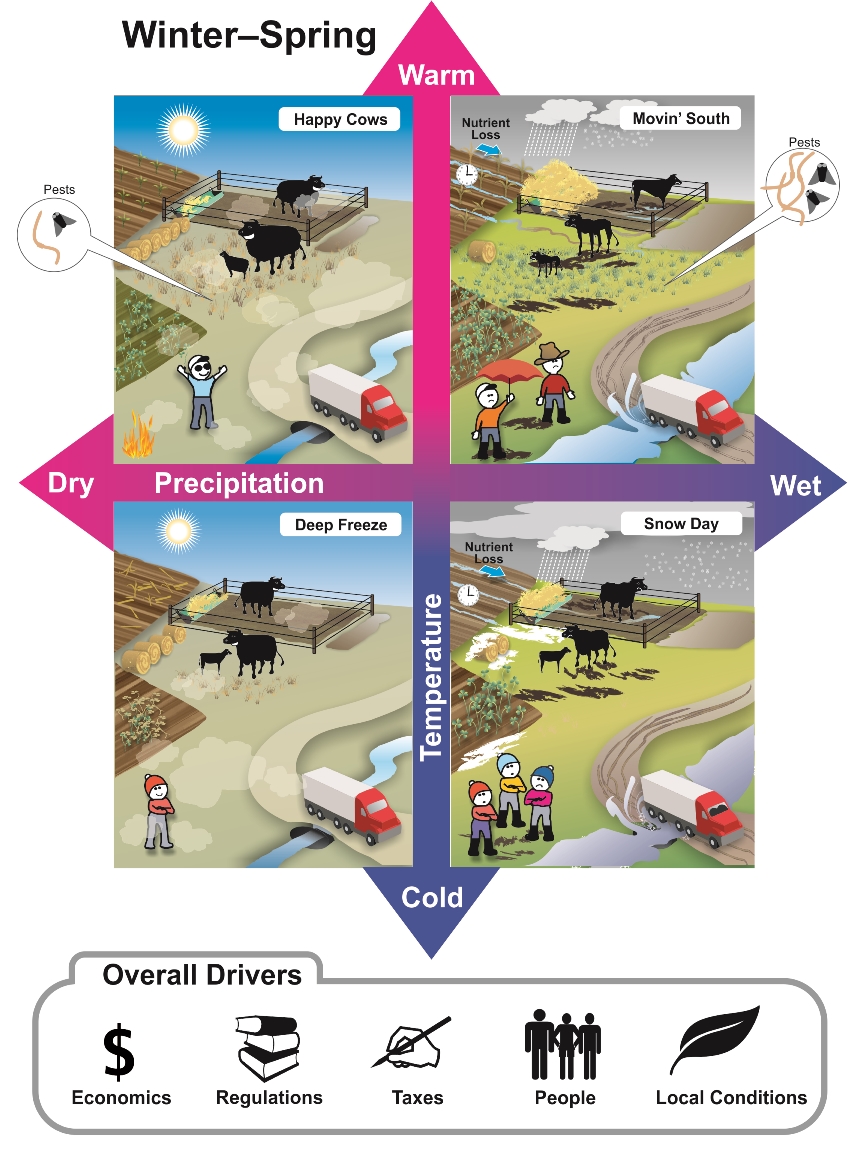
Three locations were selected to host two half day focus groups, representing the major production regions. A diverse group representing the beef industry of each region including feedlot managers, cow calf ranchers, diversified producers, veterinarians, bankers, NRCS personnel, and other allied industries. The first focus group started with a discussion of the participants past experiences with weather impacts. The team then provided short presentations starting with historic climate trends and projection, anticipated impacts, and uncertainties. The participants then combined critical climate drivers as axis in a 2×2 grids, each generating a set of four scenarios. They then listed impacts for each combination. The impacts boundaries were feed production through transporting finished cattle off-farm.
Project personnel then combined the results of all three locations to prioritize the top scenarios, which were turned into a series of graphics and narratives. The participants were then brought together for a second focus group to brainstorm management and technology options that producers were already implementing or might consider implementing. These were then sorted based on their effectiveness across multiple climate scenarios, or robustness. The options where also sorted by the readiness of the known information: Extension materials already available, research data available but few Extension materials, and research needed.

What have we learned?
The key climate drivers were consistent across all focus groups: temperature and precipitation, ranging from below average to above average. In order to best capture the impacts, the participants separated winter/spring and summer/fall.
This method of using focus groups as our initial interaction with producers on climate change was well received. Most all farmers love to talk about the weather, so discussing historical trends and their experiences with it as well as being upfront with the uncertainties in future projections, while emphasizing the need for proactive planning seemed to resonate.
With so many competing interests for producers’ time, as well as a new programming area, it was critical to have trusted local educators to invite participants. Getting participants to the second round of focus groups was also more difficult, so future efforts should considering hosting a single, full day focus group, or allowing the participants to set the date for the second focus group, providing more motivation to attend.
Future Plans
The scenarios and related management options will be used to develop and enhance Extension programming and resources as well as inform new research efforts. The goal is to provide a suite of robust management options and tools to help producers make better decisions for their operation.
Corresponding author, title, and affiliation
Crystal Powers, Extension Engineer, University of Nebraska – Lincoln
Corresponding author email
Other authors
Rick Stowell, Associate Professor at University of Nebraska – Lincoln
Additional information
Crystal Powers
402-472-0888
155 Chase Hall, East Campus
Lincoln, NE 68583
Acknowledgements
Thank you to the project team:
University of Nebraska – Lincoln: Troy Walz, Daren Redfearn, Tyler Williams, Al Dutcher, Larry Howard, Steve Hu, Matthew Luebbe, Galen Erickson, Tonya Haigh
South Dakota State University: Erin Cortus, Joseph Darrington,
This project was supported by the USDA Northern Plains Regional Climate Hub and Agricultural and Food Research Initiative Competitive Grant No. 2011-67003-30206 from the USDA National Institute of Food and Agriculture.
The authors are solely responsible for the content of these proceedings. The technical information does not necessarily reflect the official position of the sponsoring agencies or institutions represented by planning committee members, and inclusion and distribution herein does not constitute an endorsement of views expressed by the same. Printed materials included herein are not refereed publications. Citations should appear as follows. EXAMPLE: Authors. 2017. Title of presentation. Waste to Worth: Spreading Science and Solutions. Cary, NC. April 18-21, 2017. URL of this page. Accessed on: today’s date.
How Well Do We Understand Nitrous Oxide Emissions from Open-lot Cattle Systems?
Proceedings Home | W2W Home
Purpose
Nitrous oxide (N2O) emissions from concentrated animal feeding operations, including cattle feedyards, have become an important research topic. However, there are limitations to current measurement techniques, uncertainty in the magnitude of feedyard N2O fluxes, and a lack of effective mitigation methods. There are uncertainties in the pathway of feedyard N2O production, the dynamics of nitrogen transformations in these manure-based systems, and how N2O emissions differ with changes in climate and feedyard management.
What Did We Do?
A literature review was conducted to assess the state-of-the-science of N2O production and emission from open-lot beef cattle feedyards and dairies. The objective was to assess N2O emission from cattle feedyards, including comparison of measured and modeled emission rates, discussion of measurement methods, and evaluation of mitigation options. In addition, laboratory, pilot-scale, and field-scale chamber studies were conducted to quantify and characterize N2O emissions from beef cattle manure. These studies led to new empirical model to predict feedyard N2O fluxes as a function of temperature and manure nitrate and water contents. Organic matter stability/availability was important in predicting manure-derived N2O emissions: inclusion of data for dissolved organic carbon content and Ultraviolet-visible (UV-vis) spectroscopic indices of molecular weight, complexity and degree humification improved model performance against measured data.
What Have We Learned?
Published annual per capita flux rates for beef cattle feedyards and open-lot dairies in arid climates were highly variable and ranged from 0.002 to 4.3 kg N2O animal-1 yr-1. On an area basis, published emission rates ranged from 0 to 41 mg N2O m-2 h-1. From these studies and the Intergovernmental Panel on Climate Change emission factors, calculated daily per capita N2O fluxes averaged 18 ± 10 g N2O animal-1 d-1 (range, 0.04–67 g N2O animal-1 d-1). Some of this variability is inherently derived from differences in manure management practices and animal diets among open-lot cattle systems. However, it was proposed that other major causes of variation were inconsistency in measurement techniques, and irregularity in N2O production due to environmental conditions.
For modeling studies, N2O emissions were measured during 15 chamber studies (10 chambers per study) on commercial Texas feedyards, where N2O emissions ranged from below detection to 101 mg N2O m-2 h-1. Numerous feedyard and manure data were collected and regression analyses were used to determine key variables involved in feedyard N2O losses. Based on these data, two models were developed: (1) a simple model that included temperature, manure water content, and manure nitrate concentration, and (2) a more complex model that included UV-vis spectral data that provided an estimate of organic matter stability. Overall, predictions with both models were not significantly different from measured emissions (P < 0.05) and were within 52 to 61% agreement with observations. Inclusion of data for organic matter characteristics improved model predictions of high (>30 mg m-2 h-1) N2O emissions, but tended to overestimate low emission rates (<20 mg N2O m-2 h-1). This work represents one of the first attempts to model feedyard N2O. Further refinement is needed to be useful for predicting spatial and temporal variations in feedyard N2O fluxes.
Future Plans
This work clearly identified that neither the magnitude nor the dynamics of N2O emissions from open-lot cattle systems were well understood. Five primary knowledge gaps/problem areas were identified, where current understanding is weak and further research is required. These include: (i) the need for accurate measurement of N2O emissions with appropriate and more standardized methods; (ii) improved understanding of the microbiology, chemistry, and physical structure of manure within feedyard pens that lead to N2O emissions; (iii) improved understanding of factors that influence feedyard N2O emissions, including manure H2O content, porosity, density, available nitrogen and carbon contents, environmental temperatures, and use of veterinary pharmaceuticals; (iv) development of cost-effective and practical mitigation strategies to decrease N2O emissions from pen surfaces, manure stockpiles, composting windrows, and retention ponds; and (v) improved process-based models that can accurately predict feedyard N2O emissions, evaluate mitigation strategies, and forecast future N2O emission trends.
Given the potential for future regulation of N2O emissions, feedyard managers, nutritionists, and researchers may play increasingly important roles in on-farm nitrogen management. Current management practices may need modification or refinement to balance production efficiency with environmental concerns. There is a need for data derived from both large-scale micrometerological measurement campaigns and small-scale chamber studies to assess the overall magnitude of feedyard N2O emissions and to determine key factors driving its production and emission. Refined empirical and process-based models based on manure physicochemical properties and weather could provide a dynamic approach to predict N2O losses from open-lot cattle systems.
Corresponding author (name, title, affiliation):
Heidi Waldrip, Research Chemist, USDA-ARS Conservation and Production Laboratory, Bushland, TX
Corresponding author email address
Other Authors
Rick Todd, Research Soil Scientist, USDA-ARS Conservation and Production Laboratory, Bushland, TX
David Parker, Agricultural Engineer, USDA-ARS Conservation and Production Research Laboratory, Bushland, TX
Al Rotz, Agricultural Engineer, USDA-ARS Pasture Systems and Watershed Management Research Unit, University Park, PA
Andy Cole, Animal Scientist, USDA-ARS Conservation and Production Research Laboratory (retired), Bushland, TX.
Ken Casey, Associate Professor, Texas A&M AgriLife Research, Amarillo, TX
Additional Information
“Nitrous Oxide Emissions from Open-Lot Cattle Feedyards: A Review”. Waldrip, H. M., Todd, R. W., Parker, D. B., Cole, N. A., Rotz, C. A., and Casey, K. D. 2016. J. Environ. Qual. 45:1797-1811. Open-access article available at: https://dl.sciencesocieties.org/publications/jeq/pdfs/45/6/1797?search-r…
USDA-ARS Research on Feedyard Nitrogen Sustainability: http://www.beefresearch.org/CMDocs/BeefResearch/Sustainability_FactSheet…
Acknowledgements
This research was partially funded by the Beef Checkoff: http://www.beefboard.org/
The authors are solely responsible for the content of these proceedings. The technical information does not necessarily reflect the official position of the sponsoring agencies or institutions represented by planning committee members, and inclusion and distribution herein does not constitute an endorsement of views expressed by the same. Printed materials included herein are not refereed publications. Citations should appear as follows. EXAMPLE: Authors. 2017. Title of presentation. Waste to Worth: Spreading Science and Solutions. Cary, NC. April 18-21, 2017. URL of this page. Accessed on: today’s date.
Talking Climate with Animal Agriculture Advisers
Proceedings Home | W2W Home
Purpose
The Animal Agriculture in a Changing Climate (AACC) project was established to leverage limited Extension expertise across the country in climate change mitigation and adaptation, with the goal of building capacity among Extension professionals and other livestock advisers to address climate change issues.
What did we do?
The Animal Agriculture in a Changing Climate project team created a suite of educational programs and products to build capacity across the United States. Key products of the project:
- Online courses: 363 participants registered with a 35% completion rate (Whitefield et al., JOE, 2016)
- National and regional symposia and workshops: 11 face-to-face conferences with approximately 1,350 attendees.
- Website: Over 5,900 users with over 21,100 total views. Project videos have received nearly 8,900 views.
- Social media: AACC weekly blog (990 subscribers); daily Southeast Climate Blog (38,506 site visits); regional newsletters (627 subscribers); Facebook & Twitter (280 followers)
- Ready-to-use videos, slide sets, and fact sheets
- Educational programming: 390 presentations at local, regional, and international meetings
- Collaboration with 14 related research and education projects
What have we learned?
A survey was sent out to participants in any of the project efforts, in the third year of the project and again in year five. Overall, participants found the project resources valuable, particularly the project website, the online course, and regional meetings. We surveyed two key measures: abilities and motivations. Overall, 60% or more of respondents report being able or very able to address all eight capabilities after their participation in the AACC program. A sizeable increase in respondent motivation (motivated or very motivated) existed after participation in the program, particularly for helping producers take steps to address climate change, informing others about greenhouse gases emitted by agriculture, answering client questions, and adding new information to programs or curriculum.
The first challenge in building capacity in Extension professionals was finding key communication methods to engage them. Two key strategies identified were to: 1) start programming with a discussion of historical trends and agricultural impacts, as locally relevant as available, and 2) start the discussion around adaptation rather than mitigation. Seeing the changes that are already apparent in the climatic record and how agriculture has adapted in the past and is adapting to more recent weather variability and climatic changes often were excellent discussion starters.
Another challenge was that many were comfortable with the science, but were unsure how to effectively communicate that science with the sometimes controversial discussions that surround climate change. This prompted us to include climate science communication in most of the professional development opportunities, which were then consistently rated as one of the most valuable topics.
Future Plans
The project funding ended on March 31, 2017. All project materials will continue to be available on the LPELC webpage.
Corresponding author, title, and affiliation
Crystal Powers, Extension Engineer, University of Nebraska – Lincoln
Corresponding author email
Other authors
Rick Stowell, University of Nebraska – Lincoln
Additional information
lpelc.org/animal-agriculture-and-climate-change
Acknowledgements
Thank you to the project team:
Rick Stowell, Crystal Powers, and Jill Heemstra, University of Nebraska – Lincoln
Mark Risse, Pam Knox, and Gary Hawkins, University of Georgia
Larry Jacobson and David Schmidt, University of Minnesota
Saqib Mukhtar, University of Florida
David Smith, Texas A&M University
Joe Harrison and Liz Whitefield, Washington State University
Curt Gooch and Jennifer Pronto, Cornell University
This project was supported by Agricultural and Food Research Initiative Competitive Grant No. 2011-67003-30206 from the USDA National Institute of Food and Agriculture.
The authors are solely responsible for the content of these proceedings. The technical information does not necessarily reflect the official position of the sponsoring agencies or institutions represented by planning committee members, and inclusion and distribution herein does not constitute an endorsement of views expressed by the same. Printed materials included herein are not refereed publications. Citations should appear as follows. EXAMPLE: Authors. 2017. Title of presentation. Waste to Worth: Spreading Science and Solutions. Cary, NC. April 18-21, 2017. URL of this page. Accessed on: today’s date.
Environmental Sustainability of Beef
Proceedings Home | W2W Home
Purpose
In recent years, there has been negative publicity in the media related to the sustainability of beef. In response, there has been a demand from within and outside of the industry for a scientific study to quantify the sustainability of beef over its full life cycle. This type of request has been given to many of the major food commodities, so a number of sustainability studies are underway or complete. Beef is one of the most complex systems though for this type of analysis. This beef industry life cycle assessment (LCA) is being conducted to establish benchmarks in various measures of sustainability and to identify opportunities for improvement. These types of analyses are important to promote consumer confidence in our food products.
What did we do?
A national assessment of the sustainability of beef is being conducted in collaboration with the National Cattlemen’s Beef Association through the support of the Beef Checkoff. This includes surveys and visits to cattle operations throughout the U.S. to gather production information. With this information, representative production systems are being modeled and evaluated through a cradle-to-farm gate LCA. So far, the environmental impacts of representative production systems have been evaluated for 5 of 7 geographic regions including the Southern Plains, Northern Plains, Midwest, Northwest and Southwest. To complete the full LCA, post-farm gate data were obtained from harvesting and case-ready facilities, retailers, and restaurants while consumer data were obtained from literature and public databases. These data were combined to quantify sustainability through a full cradle – to – grave life cycle assessment.
What have we learned?
Preliminary LCA results have been obtained using the farm gate and post farm gate information obtained thus far. The environmental impacts of cattle production systems vary widely, with more variation within regions than among regions. For individual production systems, total greenhouse gas emissions (carbon footprint) ranges from 17 to 36 kg CO2e/kg carcass weight (CW) with regional means around 20 kg CO2e/kg CW. Regional values for fossil energy use, non-precipitation water use and reactive nitrogen loss are 40-50 MJ/kg CW, 400-6500 l/kg CW and 120-180 g N/kg CW, respectively. To assess the full life cycle of beef, the BASF eco-efficiency analysis methodology is used with the functional unit or consumer benefit being 0.45 kg (1 lb) of consumed boneless edible beef. The full life cycle carbon footprint of beef is 43-50 kg CO2e/kg of consumed beef with about 85% of this footprint related to cattle production, 10% related to the consumer and l! ess than 5% related to processing, packaging, transport and retail. Other impact metrics include water emissions, cumulative energy demand, land use, acidification potential, photochemical ozone creation potential, ozone depletion potential, abiotic depletion potential, consumptive water use, and solid waste disposal. An initial assessment indicates that feed and cattle production phases are the largest contributors to most of these environmental impact categories. Eco-efficiency improvements are being made in cattle production through increased crop yields and more efficient use of resource inputs such as fertilizer and feed. Beneficial improvements among processors include increased use of natural gas in lieu of fuel oil, biogas capture and use from wastewater lagoons at harvesting plants, packaging optimizations, and improvements in water use efficiency. This LCA is the first of its kind for beef and has been third party verified in accordance with ISO 14040:2006 and 14044:2006 a! nd 14045: 2012 standards.
Future Plans
Surveys, visits and farm gate analyses will be completed this year for the Southeast and Northeast regions. All of the regional data will then be used along with expanded data from post farm gate processes to form the full national LCA. The national LCA will be completed in collaboration with the University of Arkansas using the SimaPro LCA software.
Corresponding author, title, and affiliation
C. Alan Rotz, Agricultural Engineer, USDA/Agricultural Research Service
Corresponding author email
Other authors
Senorpe Asem-Hiablie, Agricultural Engineer, USDA/ARS;Tom Batttagliese, Global Sustainability Metrics Manager, BASF Corporation; Kim Stackhouse-Lawson, Director of Sustainability, JBS USA (Formerly with the National Cattlemen’s Association)
Additional information
Asem-Hiablie, S., C.A. Rotz, J. Dillon, R. Stout and K. Stackhouse-Lawson. 2015. Management characteristics of cow-calf, stocker, and finishing operations in Kansas, Oklahoma and Texas. Prof. Anim. Scientist 31:1-10.
Asem-Hiablie, S., C.A. Rotz, R. Stout and K. Stackhouse-Lawson. 2016. Management characteristics of beef cattle production in the Northern Plains and Midwest regions of the United States. Prof. Anim. Scientist 32(6):736-749.
Asem-Hiablie, S., C.A. Rotz and R. Stout. 2016. Characteristics of beef cattle operations in the Midwest. Beefacts, National Cattlemen’s Beef Association, Centennial, CO.
Asem-Hiablie, S., C.A. Rotz and R. Stout. 2016. Characteristics of beef cattle operations in the Northern Plains. Beefacts, National Cattlemen’s Beef Association, Centennial, CO.
Rotz, C.A., S. Asem-Hiablie, J. Dillon and H. Bonifacio. 2015. Cradle-to-farm gate environmental footprints of beef cattle production in Kansas, Oklahoma, and Texas. J. Anim. Sci. 93:2509-2519.
Rotz, C.A., B.J. Isenberg, K.R. Stackhouse-Lawson, and J. Pollak. 2013. A simulation-based approach for evaluating and comparing the environmental footprints of beef production systems. J. Animal Sci. 91:5427-5437. 2013.
Acknowledgements
Funded in part by The Beef Checkoff and the USDA’s Agricultural Research Service. The authors thank Kathleen Fisher and others of the National Cattlemen’s Beef Association for their help in obtaining information supporting this analysis.
The authors are solely responsible for the content of these proceedings. The technical information does not necessarily reflect the official position of the sponsoring agencies or institutions represented by planning committee members, and inclusion and distribution herein does not constitute an endorsement of views expressed by the same. Printed materials included herein are not refereed publications. Citations should appear as follows. EXAMPLE: Authors. 2017. Title of presentation. Waste to Worth: Spreading Science and Solutions. Cary, NC. April 18-21, 2017. URL of this page. Accessed on: today’s date.