Field Technology & Water Quality Outreach

Proceedings Home | W2W Home waste to worth 2017 logo

Purpose

In 2015, Washington State Department of Agriculture (WSDA) partnered with local and state agencies to help identify potential sources of fecal coliform bacteria that were impacting shellfish beds in northwest Washington.  WSDA and Pollution Identification and Correction (PIC) program partners began collecting ambient, as well as rain-driven, source identification water samples. Large watersheds with multiple sub-basins, changing weather and field conditions, and recent nutrient applications, meant new sites were added almost daily. The increased sampling created an avalanche of new data. With this data, we needed to figure out how to share it in a way that was timely, clear and could motivate change. Picture of water quality data via spreadsheet, graphs, and maps.

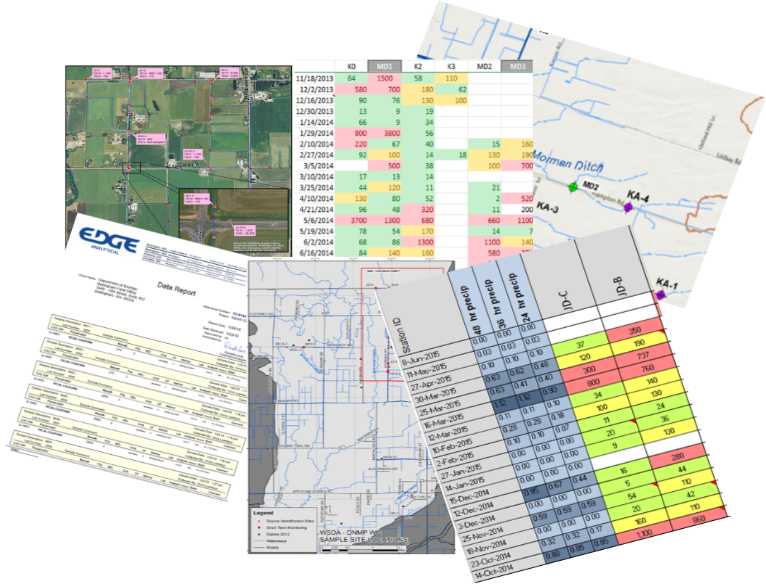
Conveying complex water quality results to a broad audience can be challenging. Previously, water quality data would be shared with the public and partners through spreadsheets or graphs via email, meetings or quarterly updates. However, the data that was being shared was often too late or too overwhelming to link locations, weather or field conditions to water quality. Even though plenty of data was available, it was difficult for it to have meaningful context to the general public.

Ease of access to results can help inform landowners of hot spots near their home, it can link recent weather and their own land management practices with water quality, as well as inform and influence decision-making.

What Did We Do?

Using basic GIS tools we created an interactive map, to share recent water quality results. The map is available on smartphones, tablets and personal computers, displaying near-real-time results from multiple agencies.  Viewers can access the map 24 hours a day, 7 days a week.

We have noticed increPicture of basic GIS tool.ased engagement from our dairy producers, with many checking the results map regularly for updates. The map is symbolized with graduated stop light symbology, with poor water quality shown in red and good in green. If they see a red dot or “hot spot” in their neighborhood they may stop us on the street, send an email, or call with ideas or observations of what they believe may have influenced water quality. It has opened the door to conversations and partnerships in identifying and correcting possible influences from their farm.

The map also contains historic results data for each site, which can show changes in water quality. It allows the viewer to evaluate if the results are the norm or an anomaly. “Are high results after a rainfall event or when my animals are on that pasture?”

The online map has also increased engagement with our Canadian neighbors to the north. By collecting samples at the US/Canadian border we have been able to map streams where elevated bacteria levels come across the border. This has created an opportunity to partner with our Canadian counterparts to continue to identify and correct sources.

What Have We Learned?

You do not need to be a GIS professional to create an app like this for your organization. Learning the system and fine-tuning the web application can take some time, but it is well worth the investment. GIS skills derived from this project have proven invaluable as the app transfers to other areas of non-point work.  The web application has created great efficiencies in collaboration, allowing field staff to quickly evaluate water quality trends in order to spend their time where it is most needed. The application has also provided transparency to the public regarding our field work, demonstrating why we are sampling particular areas.

From producer surveys, we have learned that viewers prefer a one-stop portal for information. Viewers are less concerned about what agency collected the data as they are interested in what the data says. This includes recent, as well as historical water quality data, field observations; such as wildlife or livestock presence or other potential sources. Also, a brief weekly overview of conditions, observations and/or trends has been requested to provide additional context.

Future Plans

The ease and efficiency of the mobile mapping and data sharing has opened the door to other collaborative projects. Currently we are developing a “Nutrient Tracker” application that allows all PIC partners to easily update a map from the field. The map allows the user to log recent field applications of manure. Using polygons to draw the area on the field, staff can note the date nutrients were identified, type of application, proximity to surface water, if it was a low-, medium- or high-risk application, if follow-up is warranted, and what agency would be the lead contact. This is a helpful tool in learning how producers utilize nutrients, to refer properties of concern to the appropriate agency, and to evaluate recent water quality results against known applications.

Developing another outreach tool, WSDA is collecting 5 years of fall soil nitrate tests from all dairy fields in Washington State. The goal is to create a visual representation of soil data, to demonstrate to producers how nitrate levels on fields have changed from year to year, and to easily identify areas that need to be re-evaluated when making nutrient application decisions.

As part of a collaborative Pollution Identification and Correction (PIC) group, we would like to create a “Story Map” that details the current situation, why it is a concern, explain potential sources and what steps can be taken at an individual level to make a difference. A map that visually demonstrates where the watersheds are and how local neighborhoods really do connect to people 7 miles downstream.  An interactive map that not only shows sampling locations, but allows the viewer to drill down deeper for more information about the focus areas, such as pop-ups that explain what fecal coliform bacteria are and what factors can increase bacteria levels. We envision a multi-layer map that includes 24-hour rainfall, river rise, and shellfish bed closures. This interactive map will also share success stories as well as on-going efforts.

Author

Kerri Love, Dairy Nutrient Inspector, Dairy Nutrient Management Program, Washington State Department of Agriculture

klove@agr.wa.gov

Additional Information

Results Map Link: http://arcg.is/1Q9tF48

Washington Shellfish Initiative: http://www.governor.wa.gov/issues/issues/energy-environment/shellfish

Mobile Mapping Technology presentation by Michael Isensee, 2016 National CAFO Roundtable

Sharing the Data: Interactive Maps Provide Rapid Feedback on Recent Water Quality and Incite Change by Educating the Public, Kyrre Flege, Washington State Department of Agriculture and Jessica Kirkpatrick, Washington State Department of Ecology,  2016 National Non-Point Source Monitoring Workshop

Whatcom County PIC Program: http://www.whatcomcounty.us/1072/Water-Quality

Skagit County, Clean Samish Initiative: https://www.skagitcounty.net/Departments/PublicWorksCleanWater/cleansamish.htm

Lower Stillguamish PIC Program: http://snohomishcountywa.gov/3344/Lower-Stilly-PIC-Program

GIS Web Applications: http://doc.arcgis.com/en/web-appbuilder/

Acknowledgements

The web application was a collaborative project developed by Kyrre Flege, Washington State Department of Agriculture and Jessica Kirkpatrick, Washington State Department of Ecology.

The authors are solely responsible for the content of these proceedings. The technical information does not necessarily reflect the official position of the sponsoring agencies or institutions represented by planning committee members, and inclusion and distribution herein does not constitute an endorsement of views expressed by the same. Printed materials included herein are not refereed publications. Citations should appear as follows. EXAMPLE: Authors. 2017. Title of presentation. Waste to Worth: Spreading Science and Solutions. Cary, NC. April 18-21, 2017. URL of this page. Accessed on: today’s date.

Livestock Methane Emissions Estimated and Mapped at a County-level Scale for the Contiguous United States


Proceedings Home W2W Home w2w17 logo

Purpose         

This analysis of methane emissions used a “bottom-up” approach based on animal inventories, feed dry matter intake, and emission factors to estimate county-level enteric (cattle) and manure (cattle, swine, and poultry) methane emissions for the contiguous United States.

What did we do? 

Methane emissions from enteric and manure sources were estimated on a county-level and placed on a map for the lower 48 states of the US. Enteric emissions were estimated as the product of animal population, feed dry matter intake (DMI), and emissions per unit of DMI. Manure emission estimates were calculated using published US EPA protocols and factors. National Agricultural Statistic Services (NASS) data was utilized to provide animal populations. Cattle values were estimated for every county in the 48 contiguous states of the United States. Swine and poultry estimates were conducted on a county basis for states with the highest populations of each species and on a state-level for less populated states. Estimates were placed on county-level maps to help visual identification of methane emission ‘hot spots’. Estimates from this project were compared with those published by the EPA, and to the European Environmental Agency’s Emission Database for Global Atmospheric Research (EDGAR).

What have we learned? 

Overall, the bottom-up approach used in this analysis yielded total livestock methane emissions (8,888 Gg/yr) that are comparable to current USEPA estimates (9,117 Gg/yr) and to estimates from the global gridded
EDGAR inventory (8,657 Gg/yr), used previously in a number of top-down studies. However, the
spatial distribution of emissions developed in this analysis differed significantly from that of
EDGAR.

Methane emissions from manure sources vary widely and research on this subject is needed. US EPA maximum methane generation potential estimation values are based on research published from 1976 to 1984, and may not accurately reflect modern rations and management standards. While some current research provides methane emission data, a literature review was unable to provide emission generation estimators that could replace EPA values across species, animal categories within species, and variations in manure handling practices.

Future Plans    

This work provides tabular data as well as a visual distribution map of methane emission estimates from enteric (cattle) and manure (cattle, swine, poultry) sources. Future improvement of products from this project is possible with improved manure methane emission data and refinements of factors used within the calculations of the project.

Corresponding author, title, and affiliation        

Robert Meinen, Senior Extension Associate, Penn State University Department of Animal Science

Corresponding author email    

rjm134@psu.edu

Other authors   

Alexander Hristov (Principal Investigator), Professor of Dairy Nutrition, Penn State University Department of Animal Science Michael Harper, Graduate Assistant, Penn State University Department of Animal Science Richard Day, Associate Professor of Soil

Additional information                

None.

Acknowledgements       

Funding for this project was provided by ExxonMobil Research and Engineering.

The authors are solely responsible for the content of these proceedings. The technical information does not necessarily reflect the official position of the sponsoring agencies or institutions represented by planning committee members, and inclusion and distribution herein does not constitute an endorsement of views expressed by the same. Printed materials included herein are not refereed publications. Citations should appear as follows. EXAMPLE: Authors. 2017. Title of presentation. Waste to Worth: Spreading Science and Solutions. Cary, NC. April 18-21, 2017. URL of this page. Accessed on: today’s date.

Biofuels and Bioproducts from Wet and Gaseous Waste Streams: Challenges and Opportunities

Proceedings Home W2W Home w2w17 logo

Purpose

To provide an initial characterization of the wet and gaseous organic feedstocks available in the continental U.S., and to explore technological possibilities for converting these streams into biofuels and bioproducts.

What did we do?

The Bioenergy Technologies Office (BETO) of the U.S. Department of Energy commissioned an in depth resource assessment by teams at the the National Renewable Energy Lab (NREL) and the Pacific Northwest National Lab (PNNL). Concurrently, BETO conducted a series of workshops, informed by an extended literature review and several rounds of peer review to ascertain the states of technologies for making biofuels and bioproducts from these resources. These efforts resulted in a January 2017 report that is available here:

https://energy.gov/eere/bioenergy/articles/beto-publishes-analysis-biofu…

What have we learned?

Terrestrial feedstocks are currently the largest resource generated for the bioeconomy, estimated at 572 million dry tons for 2017 (Billion Ton 2016), and have traditionally constituted the primary focus of the Bioenergy Technologies Office (BETO). However, the resource assessment conducted by the National Renewable Energy Lab and Pacific Northwest National Lab indicates that wet waste feedstocks (Summarized in Table ES-1) could also make significant contributions to the bioeconomy and domestic energy security goals.

Summary of Annual Wet and Gaseous Feedstock Availability

Table 1. Annual Resource Generation

1 116,090 Btu/gal. This does not account for conversion efficiency.

2 The moisture content of food waste varies seasonally, ranging from 76% in the summer to 72% in the winter.

3 Methane potential. This does not include currently operational landfill digesters (>1,000 billion cubic feet [Bcf] annually) and may double count potential from wastewater residuals, food waste, and animal waste.

4 DDGS = Dried Distillers Grains with Solubles

BCF- Billion cubic feet

When combining the primary waste streams of interest: sludge/biosolids, animal manure, food waste, and fats, oils, and greases, a supplemental 77 million dry tons per year are generated. Of this total, 27 million dry tons is currently being beneficially used (e.g. fertilizer, biodiesel, compost), leaving 50 million dry tons available for conversion to biofuels, bioproducts or biopower. Gaseous waste streams (biogas and associated natural gas) contribute an additional 734 trillion Btu (TBtu), bringing the total energy potential of these feedstocks to over 2.3 quadrillion Btu. Additionally, these streams contain methane, the second most prevalent greenhouse gas, which constituted 12% of net U.S. emissions in 2014 according to the U.S. Environmental Protection Agency’s (EPA) greenhouse gas inventory. Thus, there is significant potential to valorize these energy dense streams while simultaneously reducing harmful emissions.

As illustrated by example in Figure ES-1, wet and gaseous waste streams are widely geographically distributed, frequently in areas of high population density, affording them unique current and emerging market opportunities. The size of publicly owned treatment works, landfills, rendering operations, and grease collectors overlay with the largest population centers nationwide. Therefore, when compared to terrestrial feedstocks, these waste streams are largely aggregated and any derivative biofuels, bioproducts, or biopower are close to end markets.

Figure ES-1. Spatial distribution and influent range of 14,581 US EPA 2012 Clean Water Needs Survey (CWNS) catalogued treatment plants

At the same time, however, this close proximity to populations markets often correlates with more stringent regulatory landscapes for disposal. Therefore, the value proposition presented by these waste streams commonly includes avoiding disposal costs as opposed to an independent biorefinery that requires stand-alone profitability. Aided by these and related factors, public and private entities are actively exploring and deploying novel solutions for waste stream valorization. Potential competition between biofuels, bioproducts, and other beneficial uses will likely be a key element of future markets, and clearly merits further analytical and modeling investigation.

Future Plans

This report concludes that wet and gaseous organic waste streams represent a significant and underutilized set of feedstocks for biofuels and bioproducts. They are available now, in many cases represent a disposal problem that constitutes an avoided cost opportunity, and are unlikely to diminish in volume in the near future. As a result, at least in the short and medium term, they may represent a low-cost set of feedstocks that could help jump start the Bioeconomy of the Future via niche markets. While much modeling, analysis, and technological de-risking remains to be done in order to bring these feedstocks to market at significant scales, the possible contributions to the overall mission of the Bioenergy Technologies Office merit further attention.

Corresponding author, title, and affiliation

Mark Philbrick, Waste-to-Energy Coordinator, Bioenergy Technologies Office, U.S. Department of Energy

Corresponding author email

mark.philbrick@hq.doe.gov

Other authors

see report

Additional information

Future activities are contingent upon Congressional appropriations.

Acknowledgements

see report

The authors are solely responsible for the content of these proceedings. The technical information does not necessarily reflect the official position of the sponsoring agencies or institutions represented by planning committee members, and inclusion and distribution herein does not constitute an endorsement of views expressed by the same. Printed materials included herein are not refereed publications. Citations should appear as follows. EXAMPLE: Authors. 2017. Title of presentation. Waste to Worth: Spreading Science and Solutions. Cary, NC. April 18-21, 2017. URL of this page. Accessed on: today’s date.

Manure Management Technology Selection Guidance

Proceedings Home W2W Home w2w17 logo

Purpose

Manure is an inevitable by-product of livestock production. Traditionally, manure has been land applied for the nutrient value in crop production and improved soil quality.With livestock operations getting larger and, in many cases, concentrating in certain areas of the country, it is becoming more difficult to balance manure applications to plant uptake needs. In many places, this imbalance has led to over-application of nutrients with increased potential for surface water, ground water and air quality impairments. No two livestock operations are identical and manure management technologies are generally quite expensive, so it is important to choose the right technology for a specific livestock operation. Information is provided to assist planners and landowners in selecting the right technology to appropriately address the associated manure management concerns.

What did we do?

As with developing a good conservation plan, knowledge of manure management technologies can help landowners and operators best address resource concerns related to animal manure management. There are so many things to consider when looking at selecting various manure treatment technologies to make sure that it will function properly within an operation. From a technology standpoint, users must understand the different applications related to physical, chemical, and biological unit processes which can greatly assist an operator in choosing the most appropriate technology. By having a good understanding of the advantages and disadvantages of these technologies, better decisions can be made to address the manure-related resource concerns and help landowners:

• Install conservation practices to address and avoid soil erosion, water and air quality issues.

• In the use of innovative technologies that will reduce excess manure volume and nutrients and provide value-added products.

• In the use of cover crops and rotational cropping systems to uptake nutrients at a rate more closely related to those from applied animal manures.

• In the use of local manure to provide nutrients for locally grown crops and, when possible, discourage the importation of externally produced feed products.

• When excess manure can no longer be applied to local land, to select options that make feasible the transport of manure nutrients to regions where nutrients are needed.

• Better understand the benefits and limitations of the various manure management technologies.

Picture of holding tank

Complete-Mix Anaerobic Digester – option to reduce odors and pathogens; potential energy production

Picture of mechanical equipment

Gasification (pyrolysis) system – for reduced odors; pathogen destruction; volume reduction; potential energy production.

Picture of field

Windrow composting – reduce pathogens; volume reduction

Picture of Flottweg separation technology

Centrifuge separation system – multiple material streams; potential nutrient
partitioning.

What have we learned?

• There are several options for addressing manure distribution and application management issues. There is no silver bullet.

• Each livestock operation will need to be evaluated separately, because there is no single alternative which will address all manure management issues and concerns.

• Option selections are dependent on a number of factors such as: landowner objectives, manure consistency, land availability, nutrient loads, and available markets.

• Several alternatives may need to be combined to meet the desired outcome.

• Soil erosion, water and air quality concerns also need to be addressed when dealing with manure management issues.

• Most options require significant financial investment.

Future Plans

Work with technology providers and others to further evaluate technologies and update information as necessary. Incorporate findings into NRCS handbooks and fact sheets for use by staff and landowners in selecting the best technology for particular livestock operations.

Corresponding author, title, and affiliation

Jeffrey P. Porter, P.E.; National Animal Manure and Nutrient Management Team Leader USDA-Natural Resources Conservation Service

Corresponding author email

jeffrey.porter@gnb.usda.gov

Other authors

Darren Hickman, P.E., National Geospatial Center of Excellence Director USDA-Natural Resources Conservation Service; John Davis, National Nutrient Management Specialist USDA-Natural Resources Conservation Service, retired

Additional information

References

USDA-NRCS Handbooks – Title 210, Part 651 – Agricultural Waste Management Field Handbook

USDA-NRCS Handbooks – Title 210, Part 637 – Environmental Engineering, Chapter 4 – Solid-liquid Separation Alternatives for Manure Handling and Treatment (soon to be published)

Webinars

Evaluation of Manure Management Systems – http://www.conservationwebinars.net/webinars/evaluation-of-manure-management-systems/?searchterm=animal waste

Use of Solid-Liquid Separation Alternatives for Manure Handling and Treatment – http://www.conservationwebinars.net/webinars/use-of-solid-liquid-separation-alternatives-for-manure-handling-and-treatment/?searchterm=animal waste

The authors are solely responsible for the content of these proceedings. The technical information does not necessarily reflect the official position of the sponsoring agencies or institutions represented by planning committee members, and inclusion and distribution herein does not constitute an endorsement of views expressed by the same. Printed materials included herein are not refereed publications. Citations should appear as follows. EXAMPLE: Authors. 2017. Title of presentation. Waste to Worth: Spreading Science and Solutions. Cary, NC. April 18-21, 2017. URL of this page. Accessed on: today’s date.

Composting of Dairy Manure with the Addition of Zeolites to Reduce Ammonia Emissions

Proceedings Home W2W Home w2w17 logo

Purpose

The purpose of this project was to demonstrate the effects of adding natural clinoptilolite zeolites to a dairy manure compost mix at the moment of initiating the composting process on ammonia emissions, nitrogen retention, composting performance, and characteristics of the final compost product. A typical dairy cow in the U.S. produces approximately 148 lb of manure daily (feces and urine, not counting bedding; Lorimor et al., 2000). This amounts to millions of tons of monthly manure production. On-farm composting of manure is one of the most-used practices to manage dairy manure in Idaho. Composting reduces manure volume between 35 and 50%, which allows the material to be significantly more affordable to transport than fresh, wet manure. Composting converts the nitrogen (N) present in the raw manure into a more stable form, which is released slowly over a period of years and thereby not totally lost to the environment. Composting contributes to alleviating problems associated with ground and surface water contamination and also reduces odor complaints (Rink et al., 1992; Fabian et al., 1993). During the manure handling and composting process, between 50 and 70% of the nitrogen can be lost as ammonia if additional techniques are not used to increase nitrogen retention. In most cases, manures from dairies and other livestock operations don’t have the proper carbon to nitrogen (C:N) ratio to be composted efficiently without added carbon (usual straw bedding has a C:N of 60 to 90). Dairy cow manure is rich in nitrogen (C:N ratios below 18:1), causing a great proportion of the available nitrogen to be lost as ammonia due to the lack of carbon to balance the composting process. The loss of nitrogen from manures as ammonia reduces the nutrient value of the manure, produces an inefficient composting process, and generates local and regional pollution. Lack of carbon also results in a lower-grade compost that can carry elevated concentrations of salts, potassium and phosphorous. In many arid zones there are not enough sources of carbon to balance the nitrogen present in the manure.

Zeolite is a mineral defined as a crystalline, hydrated aluminosilicate of alkali and alkaline earth cations having an infinite, open, three-dimensional structure. Zeolites are able to further lose or gain water reversibly and to exchange cations with and without crystal structure (Mumpton, 1999). Zeolites are mined in several western U.S. states where dairy production also is concentrated. This paper showcases a project that explored the effects of adding natural zeolites to dairy manure at the time of composting as a tool to reduce ammonia emissions and retain nitrogen in the final composted product.

What did we do?

This on-farm research and demonstration study was conducted at an open-lot dairy in southern Idaho with 100 milking Jersey cows. Manure stockpiled during the winter and piled after the corral’s cleaning was mixed with freshly collected manure from daily operations and straw from bedding and old straw bales, in similar proportions for each windrow. The compost mixture was calculated using a compost spreadsheet calculator (WSU-Puyallup Compost Mixture Calculator, version 1.1.; Puyallup, WA). Moisture was adjusted by adding well water to reach approximately 50% to 60% moisture on the initial mix. Windrows were mixed and mechanically turned using a tractor bucket. Three replications were made on control and treatment. The control consisted of the manure and straw mix as described. The treatment consisted of the same mix as the control, plus the addition of 8% of clinoptilolite zeolite by weight during the initial mix. Windrows were actively composted for four months or more. Ammonia emissions were measured using passive samplers (Ogawa & Co., Kobe, Japan) for the first five to seven days after building each windrow (called turn 1 in Figure 1) and after the two subsequent turns. Ammonia emissions per measurement period and per turn were obtained. Three periods of one to three days at the time of building each windrow and after the first turn were measured. After the second turn, two measurement periods of three to four days were made. Values of mg NH3-N/m3 are time-corrected by minutes of sampling (Figure 1). Complete initial manure (compost feedstock mix) and final screened compost nutrient lab analyses were performed for each windrow. Analyses of variance (ANOVA) on lab data and on ammonia samples were performed using SAS 9.4 (SAS Institute, Cary, NC).

Figure 1. Ammonia emissions per period and turn

What have we learned?

The addition of 8% w/w natural zeolites to the dairy manure compost mix on a mechanically turned system using a tractor bucket reduced cumulative ammonia emissions by 11% during the first three turns (Figure 2) and showed a significant reduction trend in ammonia emissions. Figure 1 shows the differences and trend line in ammonia emissions per monitoring period and per turn. Treated windrows’ cumulative emissions were significantly lower (P<0.05) at 2.76 mg NH3-N/m3 from control windrows at 3.09 mg NH3-N/m3. Nitrates (NO3) on the composted treatment (702 ppm) were 3 times greater (p=0.05) than the control (223 ppm) (Figure 3). These results demonstrate that the addition of natural zeolites has a positive effect on reducing ammonia emissions during the composting process and increasing the conversion to nitrates, retaining nitrogen in the compost in a form that is more available to crops.

Figure 2. Cumulative ammonia emissions

Figure 3. Nitrate, ppm before and after composting

Future Plans

Field days and journal publications about this project are expected to occur within the next year.

Corresponding author, title, and affiliation

M. E. de Haro-Martí. Extension Educator. University of Idaho Extension, Gooding County, Gooding, Idaho.

Corresponding author email

mdeharo@uidaho.edu

Other authors

M. Chahine. Extension Dairy Specialist. University of Idaho Extension, Twin Falls R&E Center, Twin Falls, Idaho. H. Neibling. Extension Irrigation Engineer. University of Idaho Extension, Kimberly R&E Center, Kimberly, Idaho. L. Chen. Extension Waste Management Specialist,

Additional information

References:

Fabian, E. F., T. L. Richard, D. Kay, D. Allee, and J. Regenstein. 1993. Agricultural composting: a feasibility study for New York farms. Available at: http://compost.css.cornell.edu/feas.study.html . Accessed 04/28/2011.

Lorimor, J., W. Powers, A. Sutton. 2000. Manure Characteristics. Manure Management System Series. Midwest Plan Service. MPWS-18 Section 1. Iowa State University.

Mumpton, F.A. 1999. La roca magica: Uses of Natural Zeolites in Agriculture and Industry. Proceedings of the National Academy of Sciences of the United States of America, Vol. 96, No. 7 (Mar. 30, 1999), pp. 3463-3470

Rink, R., M. van de Kamp, G.B. Willson, M.E. Singley, T.L. Richard, J.J. Kolega, F.R. Gouin, L.L. Laliberty Jr., D.K. Dennis. W.M. Harry, A.J. Hoitink, W.F.Brinton. 1992. On-Farm Composting Handbook. NRAES-54. Natural Resource, Agriculture, and Engineering Service. Cooperative Extension. Ithaca, New York.

Acknowledgements

This project was made possible through a USDA- ID NRCS Conservation Innovation Grants (CIG) # 68-0211-11-047. The authors also want to thank the involved dairy farmer and colleagues that helped during this Extension and research project. Thanks to Dr. April Leytem and her technicians at USDA-ARS in Kimberly, ID, for the loan of the Ogawa passive samplers and for sample analysis.

Evaluation of a Model to Predict Enteric Methane Production from Feedlot Cattle


Proceedings Home W2W Home w2w17 logo

Purpose

Continual refinement of methods estimating enteric methane production in beef finishing cattle provides a more accurate assessment of the environmental impact of the beef industry.  The USDA-OCE publication “Quantifying Greenhouse Gas Fluxes in Agriculture and Forestry: Methods for Entity-Scale Inventory” identified conservation practices and management strategies for reducing greenhouse gas emissions while improving agriculture production (Eve et al., 2014).  In Chapter 5 a new method to estimate effects of nutrition and management on enteric methane production of feedlot cattle is provided.  The system recommends using adjustment factors to correct the IPCC (2006) tier 2 Methane Conversion Factor (Ym) of 3.0% of gross energy intake to an adjusted Ym.  Adjustment factors are used for dietary grain and fat concentrations, grain type and processing method, and ionophore use.  These adjustment factors let beef producers more accurately determine the enteric methane production associated with their individual finishing operation.

What Did We Do?

To evaluate this new model, we developed a database consisting of 36 refereed publications, with 75 treatment means.  The focus of this database was to identify published research relating to high concentration beef finishing that provided methane as a percent of gross energy, or provided enough information for calculation.  Treatments containing greater than 20% forage were excluded, as they are not representative of a high concentration finishing diet.  Additionally, treatment diets utilizing a methane mitigation agent were excluded from the database. 

What Have We Learned?

This database encompassed 75 treatment means containing a wide range in weight, intake and protein of the diets.  Body weight, dry matter intake, and dietary crude protein concentrations for the database ranged from 150 to 723 kg, 4.78 to 12.9 kg, and 9.4 to 23%, respectively.  Predicted Ym had a significant but relatively low correlation (r = 0.31, P = 0.0077) to actual Ym.  However, when one experiment (4 treatments) with very high methane values (likely a result of manure CH4) was removed, the correlation improved (r = 0.62, P < 0.0001), resulting in the following relationship:  Predicted Ym = 2.23 + (0.41 * actual YM) (r2 = 0.39, RMSE = 0.58).  Predicted g of CHproduced daily were highly correlated to actual g of CH4/d (r2 = 0.63, RMSE = 22.61), and predicted CH4 produced, as a percentage of digestible energy intake, was highly correlated to actual CHper kcal of digestible energy intake, DEI (r2 = 0.46, RMSE = 0.61).  Under the conditions of this investigation, the new model moderately predicted enteric methane production from feedlot cattle fed high-concentrate diets.

Future Plans

The database will be expanded as refereed publications suitable to the selection criteria are identified.  Trials with greater forage inclusion will be evaluated to test the robustness of the model and evaluate the correlation to IPPC (2006) estimations. 

Corresponding author (name, title, affiliation) 

Tracy D. Jennings, Associate Research Scientist, Texas A&M AgriLife Research

Corresponding author email address  

Tracy.Jennings@ag.tamu.edu

Other Authors 

Kristen Johnson, Professor, Washington State University; Luis Tedeschi, Professor, Texas A&M University; Michael Galyean, Provost, Texas Tech University, Richard Todd, Soil Scientist, USDA-ARS; N. Andy Cole, Retired Animal Scientist, USDA-ARS

The authors are solely responsible for the content of these proceedings. The technical information does not necessarily reflect the official position of the sponsoring agencies or institutions represented by planning committee members, and inclusion and distribution herein does not constitute an endorsement of views expressed by the same. Printed materials included herein are not refereed publications. Citations should appear as follows. EXAMPLE: Authors. 2017. Title of presentation. Waste to Worth: Spreading Science and Solutions. Cary, NC. April 18-21, 2017. URL of this page. Accessed on: today’s date.

Partnerships in the Manure Nutrient Management Field

Proceedings Home W2W Homew2w17 logo

Purpose

Responsible manure nutrient management improves environmental quality while maintaining agricultural productivity. Multiple organizations and individuals play a part in improving the understanding and practice of responsible management. But how does manure nutrient management information flow? The “Pathways” project’s goals were to understand and delineate pathways for effective information dissemination and use among various agricultural professional audiences that facilitate successful integrated (research/outreach/education) projects and programs. This presentation examines the relevance of partnerships within the manure nutrient management network and barriers to these partnerships.

What did we do?

We disseminated the “Pathways” survey online utilizing the mailing lists of several professional and producer organizations and listservs associated with manure management. There were 964 surveys started and 608 completed. The six types of organizations with more than 10% of the total survey population’s responses were university/Extension; government non-regulatory agencies; government regulatory agencies; producers; special government agencies; and sale or private enterprises.

The South Dakota State University Institutional Review Board deemed the survey exempt under federal regulation 45 CFR 46.101 (b) (IRB-1402010-EXM and IRB-1502001-EXM).

What have we learned?

The survey posed “How important is collaboration with each of the following groups related to manure nutrient management?” Figure 1 shows the mean relevance among all survey participants, evaluated on a scale of 1 (Not important/somewhat unimportant) to 4 (Highly important). On average, all potential partner groups were recognized as important (>2). Partnerships with producers were deemed most important (3.68) by all survey respondents.

After assessing relevance, we asked survey participants to indicate what barriers, if any, deter them from collaboration with each of the following groups related to manure nutrient management (select all that apply). For all potential partners listed, with the exception of tribal governments, “No Barriers to Use” was the most selected option. “Do Not Have a Relationship” was a common and stronger barrier for commodity, sales and service partners, compared to government agencies, for example.

The barriers “Discouraged or Not Allowed” and “No Incentive to Collaborate” were relatively small selections. The barrier “Do Not Have a Relationship” is possible to overcome at both individual and organizational levels, where needed.

Figure 1. The average relevance and the distribution of barriers to collaborating or partnering with the types of organizations specified, for purposes of manure nutrient management

Future Plans

In the future, assessing the reasons for specific partnerships can further aid improving communication and collaboration in the manure nutrient management network.

Corresponding author, title, and affiliation

Erin Cortus, Associate Professor and Environmental Quality Specialist at South Dakota State University

Corresponding author email

erin.cortus@sdstate.edu

Additional information

lpelc.org/the-pathways-project

Acknowledgements

The Pathways Project greatly appreciates the support of the North Central Region Water Network Seed Grant, South Dakota Sustainable Agriculture Research and Education, and the collaborative groups of educators, researchers and agency personnel, for improving and advocating the survey.

The authors are solely responsible for the content of these proceedings. The technical information does not necessarily reflect the official position of the sponsoring agencies or institutions represented by planning committee members, and inclusion and distribution herein does not constitute an endorsement of views expressed by the same. Printed materials included herein are not refereed publications. Citations should appear as follows. EXAMPLE: Authors. 2017. Title of presentation. Waste to Worth: Spreading Science and Solutions. Cary, NC. April 18-21, 2017. URL of this page. Accessed on: today’s date.

Recommendations of the Chesapeake Bay Program Expert Panel on Manure Treatment Technologies

Proceedings Home W2W Home w2w17 logo

Purpose

The US EPA Chesapeake Bay Program assesses nutrient loading to the Chesapeake Bay. There is a need to determine the impact of manure treatment technologies on reducing the nitrogen and phosphorus loading from agriculture. Furthermore, many states within the Chesapeake Bay Watershed control nutrient discharges through watershed nutrient trading programs. Tables of standard nutrient removal efficiencies of various technologies will allow states to implement these programs.

What did we do?

The panel standing on the dock of the Chesapeake Bay

An expert panel was convened by the EPA Chesapeake Bay Program to determine nutrient removal potential of manure treatment technologies. The following seven technology categories were reviewed: thermochemical processing, anaerobic digestion, composting, settling, mechanical solid-liquid separation, and wet chemical treatment. Within these categories, the panel defined 24 named technologies for detailed review. The scientific literature was reviewed to determine the ability of each technology to transfer volatile nitrogen to the atmosphere and transfer nutrients to a waste stream more likely to be used off-farm (or transported out of the Chesapeake Bay Watershed).

What have we learned?

Manure treatment technologies are used reduce to odors, solids, and organic matter from the manure stream, with only minor reductions in nutrient loading. The panel determined that Thermo-Chemical Processing and Composting have the potential to volatilize nitrogen, and all of the technologies have the ability to transfer nutrients into a more useful waste stream. The greatest effect of treatment technologies is the transformation of nutrients to more stable forms – such as precipitation of insoluble phosphorus from dissolved phosphorus.

Future Plans

The panel’s report is undergoing final authorization from the Chesapeake Bay Program for release to the public. Future panels may choose to revisit the issue of nutrient reduction from manure treatment technologies. The current panel recommends future panels expand the categories of technologies to include liquid aerobic treatment, and examine more named technologies as they become available within the Chesapeake Bay Watershed.

Corresponding author, title, and affiliation

Douglas W. Hamilton, Associate Professor Oklahoma State University

Corresponding author email

dhamilt@okstate.edu

Other authors

Keri Cantrell, KBC Consulting;John Chastain, Clemson University; Andrea Ludwig, University of Tennessee; Robert Meinen, Penn State University; Jactone Ogejo, Virginia Tech; Jeff Porter, USDA Natural Resource Conservation Service, Eastern Technology Suppor

Additional information

https://www.chesapeakebay.net/

http://osuwastemanage.bae.okstate.edu/

Two related presentations given at the same session at Waste to Worth 2017

Acknowledgements

Funding for this panel was provided by the US EPA Chesapeake Bay Program and Virginia Tech University through EPA Grant No. CB96326201

The authors are solely responsible for the content of these proceedings. The technical information does not necessarily reflect the official position of the sponsoring agencies or institutions represented by planning committee members, and inclusion and distribution herein does not constitute an endorsement of views expressed by the same. Printed materials included herein are not refereed publications. Citations should appear as follows. EXAMPLE: Authors. 2017. Title of presentation. Waste to Worth: Spreading Science and Solutions. Cary, NC. April 18-21, 2017. URL of this page. Accessed on: today’s date.

PA Finishing Swine Barn Experience: Changing from Mortality Burial to a Michigan Style Composting Barn

Proceedings Home W2W Home w2w17 logo

Purpose

In the spring of 2014, the farmer with a 2020 finishing pig barn, wanted to change from burial of mortality to composting the mortality. We will document the change and the use of the composting barn from July 2014 to Dec 2016.

What did we do?

This 2020 finish pig barn space has about 3% mortality and expects about 250 deaths per year to compost. We discussed building a PA Michigan single wall compost barn design. The farmer built a 24×40 compost barn, with a 3 feet center dividing wall. The barn was completed in the summer of 2014 and we will track the pig barn turns and compost barn mortality loadings from July 2014 to December 2016. The barn has used about 56 cubic yards of woodchips/ bark mulch the first year and then replaced with about 40 cubic yards of sawdust for the second year.

The compost temperatures have reached 130 Degrees F and the farmer is very pleased with how the barn works and how he can mix and turn the compost. The presentation will cover barn costs, barn design and sawdust mortality loading and turning.

Field with windmills and barn
PA Michigan compost barn built at the end of the hog barn

Compost heap under shelter
Excellent example of free flowing air into the compost piles while
having a center push up wall to help turn the piles

What have we learned?

We have documented the farmers use of the barn, the mortality rates, compost sawdust and woodchip use, and mixing schedules. We have also documented the mortality cost rates for this farm.

Future Plans

We will highlight this PA Michigan compost barn type to other pig barns and document the use of them in Pennsylvania.

Corresponding author, title, and affiliation

J Craig Williams

Corresponding author email

Jcw17@psu.edu

Additional information

http://extension.psu.edu/animals/health/composting

http://msue.anr.msu.edu/program/info/managing_animal_mortalities

The authors are solely responsible for the content of these proceedings. The technical information does not necessarily reflect the official position of the sponsoring agencies or institutions represented by planning committee members, and inclusion and distribution herein does not constitute an endorsement of views expressed by the same. Printed materials included herein are not refereed publications. Citations should appear as follows. EXAMPLE: Authors. 2017. Title of presentation. Waste to Worth: Spreading Science and Solutions. Cary, NC. April 18-21, 2017. URL of this page. Accessed on: today’s date.

Organizing demonstrations and tours for Government officials and Extension on Animal Mortality Management

Proceedings Home W2W Home w2w17 logo

Purpose

Provide some discussion on putting together Tour and Demonstration educational events. To Provide real life demonstrations and educational opportunities dealing with Mortality management.

What did we do?

The agent participated on a multi-state and multi country steering committee to organize and host an international symposium on Animal Mortality and Disposal Management. This was the 5th symposium and had 179 registered attendees from 11 different countries: Australia, Canada, China, Georgia, Korea, New Zealand, Nigeria, the UK, the US, Tunisia, and Vietnam.

The agent served as the host state coordinator (Penn), the 3 bus tour coordinator and the demonstration’s chairperson. Demonstrations included high density foaming, compost pile building and turning, environmental grinder processors, Clean Harbor Industries,  truck wash stations, and proper euthanasia with cap and bolt guns. The agent will list the success and challenges of these types of demonstrations and educational events. Results are from the 5th International Symposium on Managing Animal Mortality, Products, and By-products, and Associated Health Risk: Connecting Research, Regulations and Response at the Southeast Agricultural Research and Extension Center on Wednesday, September 30, 2015.

Moving horse for mortality composting
Examples of demonstrations during the field day

What have we learned?

Excellent industry tours and Farm tours and Demonstrations are an excellent learning opportunity. All Parties including Extension, Farmers, Industry and government personnel can benefit from hands on education.  Those in attendance gained skills and knowledge to be able to host their own training sessions and to be better prepared to handle animal mortality outbreaks and events in their own state.  They gained a first hand experience on pile building and related technologies for this type of event.

Demo with tractor covering mortality composting pile
Turning of a 60 day compost pile

Future Plans

The International Committee on Animal Mortality and Waste Products is a collection of University researchers and educators, State Department of Agriculture, Federal Homeland Security and Environmental Protection Agency personnel. The committee plans to meet for future International Symposiums as needed.

http://animalmortmgmt.org/symposium/contributors/

Corresponding author, title, and affiliation

J Craig Williams, County Agent, Penn State Extension

Corresponding author email

jcw17@psu.edu

Additional information

Conference website

http://animalmortmgmt.org/

The authors are solely responsible for the content of these proceedings. The technical information does not necessarily reflect the official position of the sponsoring agencies or institutions represented by planning committee members, and inclusion and distribution herein does not constitute an endorsement of views expressed by the same. Printed materials included herein are not refereed publications. Citations should appear as follows. EXAMPLE: Authors. 2017. Title of presentation. Waste to Worth: Spreading Science and Solutions. Cary, NC. April 18-21, 2017. URL of this page. Accessed on: today’s date.