Dairy farmers in Washington state have been under significant pressure to reduce their carbon footprint in recent years. Dairy cooperative sustainability initiatives such as achieving carbon neutrality by 2050 have left many producers wondering what will be required of them to help their cooperatives meet this goal. Coupled with regulatory pressures to report on their greenhouse gas emissions and the threat of regulation to reduce them, uncertainty remains for producers around the types of climate-smart practices that will enable them to reduce their carbon footprint while remaining economically viable.
Without a thorough understanding of the costs and risks, pressures, or requirements to implement climate-smart practices may inadvertently drive consolidation and the accelerated loss of small to medium sized farms.
What Did We Do?
Utilizing Washington state dairy facility data, I conducted an economic cost benefit analysis of two climate-smart practices that capture GHGs from anaerobic storage: anaerobic digestors and the covered lagoon and flare system and the size of operation needed to implement both practices based on current and historic market conditions and technology costs. Private and public investment in climate-smart practices can have a substantial impact on whether they are economically feasible for producers to implement. I considered the impacts of various levels of cost-share on the size of farm able to adopt the technology based on several economic indicators.
What Have We Learned?
Most dairy farms cannot simply raise their prices to offset the costs of climate-smart practices, therefore it is critical to understand the broad economic impacts of imposing emissions reductions mandates. With consolidation being a well-documented trend across dairy farms in the United States, it is possible that climate regulations will only further exacerbate this trend due to the high capital costs and market risk associated with climate-smart farming that only facilities of scale can take on.
Future Plans
I am actively assisting research right now in Washington state with university and private researchers into dairy farm carbon intensities, across various farm sizes and facility types. An overview of this research may be available by Summer of 2025. Once this work is completed, we will have a better understanding of overall farm emissions and what climate-smart practices may be necessary for farms to implement to help achieve cooperative net zero targets.
Authors
Presenting & corresponding author
Nina Gibson, Agricultural Economist and Policy Specialist, Washington State Department of Agriculture, KGibson@agr.wa.gov
The authors are solely responsible for the content of these proceedings. The technical information does not necessarily reflect the official position of the sponsoring agencies or institutions represented by planning committee members, and inclusion and distribution herein does not constitute an endorsement of views expressed by the same. Printed materials included herein are not refereed publications. Citations should appear as follows. EXAMPLE: Authors. 2025. Title of presentation. Waste to Worth. Boise, ID. April 7–11, 2025. URL of this page. Accessed on: today’s date.
Manure is a tremendously valuable nutrient source. Not all the nitrogen (N) in manure is plant-available at land application. Organic N is released into plant-available forms over multiple years. Inorganic N availability depends on the application method and timing, with more plant-available N from manure when injected in the spring than when surface applied in fall. A manure N crediting system was developed in New York in the late 90s that credits N from manure based on manure’s composition and application timing and method. With advances in farm management, the manure that dairy farms are land-applying now may be very different from the manure sources used to develop that crediting system. The Value of Manure project was initiated by the New York On-Farm Research Partnership in 2022 to update New York’s manure crediting system. Over multiple years, the project evaluates different manure sources, application methods, and timings that commercial farms now use. Additionally, we are documenting the impact of manure on yield beyond what can be obtained with inorganic fertilizer only.
What Did We Do?
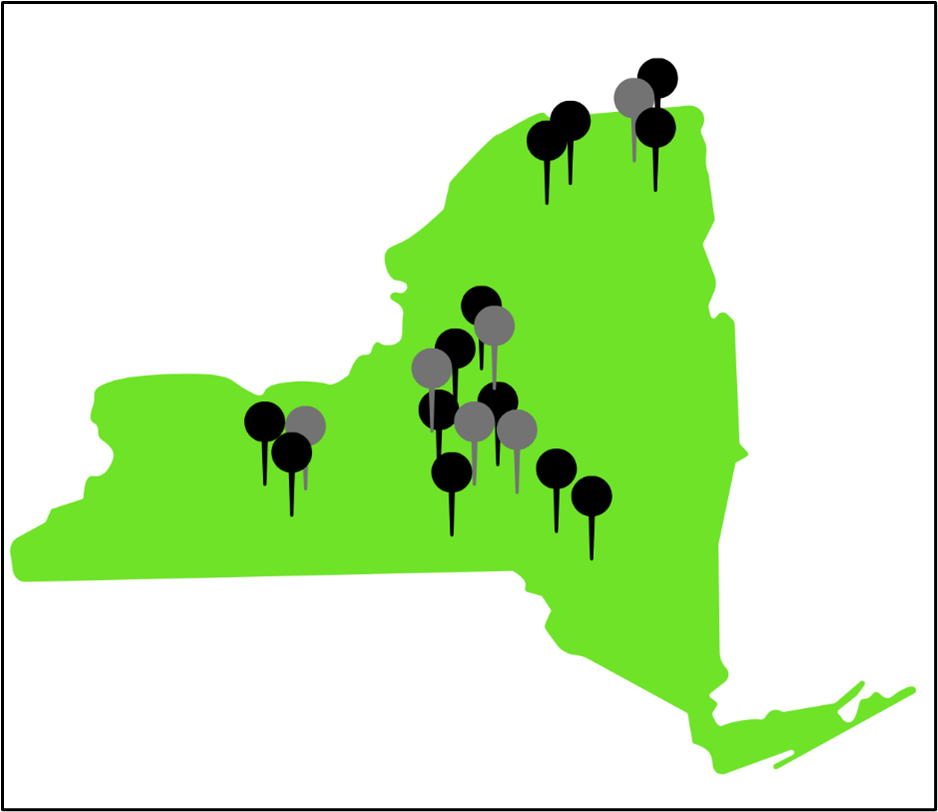
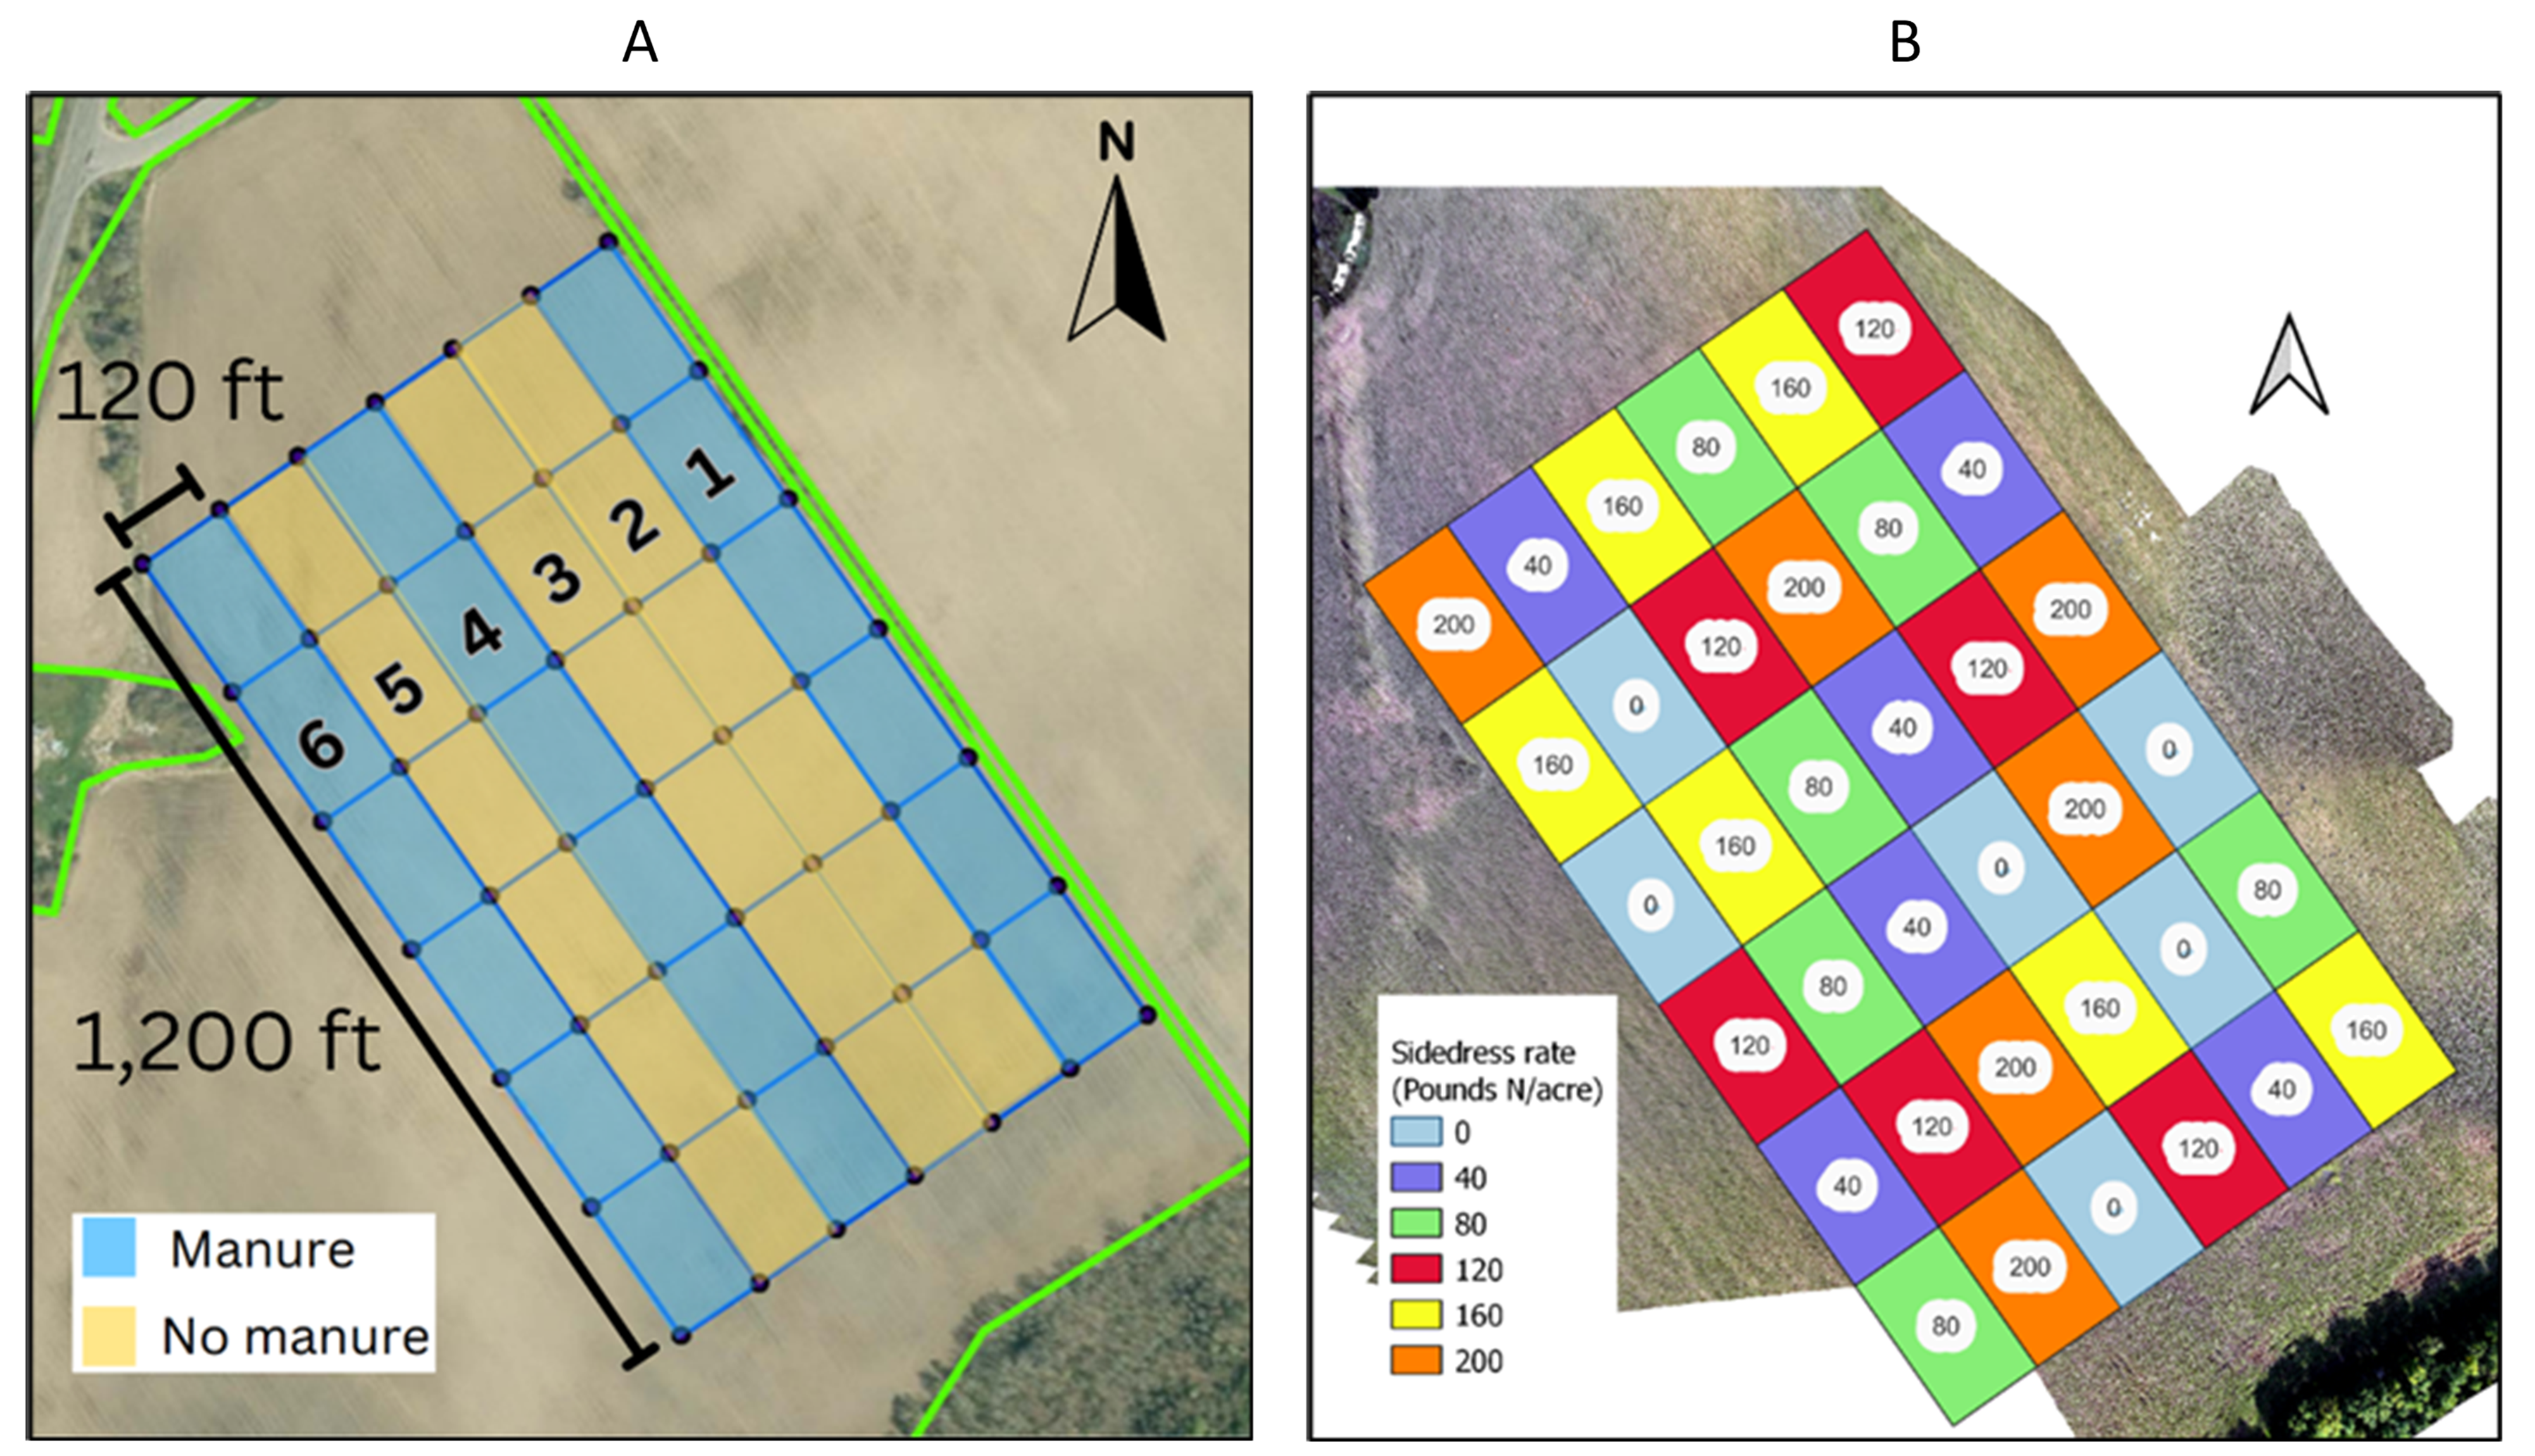
Nineteen trials were implemented on commercially farmed corn fields across New York between 2022 and 2024 (Figure 1). Each trial had three strips that received manure and three that did not, for a total of six strips per trial (Figure 2a). Five “carryover” trials received manure in the spring of year 1, and we tested manure N and yield benefits in the second year after application. Manure was applied and tested in the same year in all the other trials. Soil type, dairy manure type (digestate, separated liquids, untreated, etc.), application rate, and application methods (broadcasted, injected, etc.) varied across trials (see our “What’s Cropping Up?” extension articles in the Additional Information section for more details).
When corn was at the V4-V6 stage each strip was divided into six sub-strips (Figure 2b), and subplots were sidedressed at a rate usually ranging from 0 to 200 pounds N/acre. Sidedress rates were trial-specific, based on the expected N requirement of each field according to the Nitrogen Guidelines for Field Crops in New York. In each trial, we measured manure nutrient composition, general soil fertility, Pre-Sidedress Nitrate Test (PSNT), Corn Stalk Nitrate Test (CSNT), yield, and forage quality.
Figure 1. Nineteen Value of Manure trials have been implemented across New York between 2023 and 2024.Figure 2. Layout of a Value of Manure study plot. Three strips received manure before planting corn (1a). At the V4-V6 stage each of the six strips received six different inorganic N sidedress rates (1b).
What Have We Learned?
In the three years of the project, we have documented how manure offsets fertilizer needs and “bumps” yields. Yield responses to manure and fertilizer N vary by location and year, influenced by field past management (manure history, crop rotation, etc.) and weather.
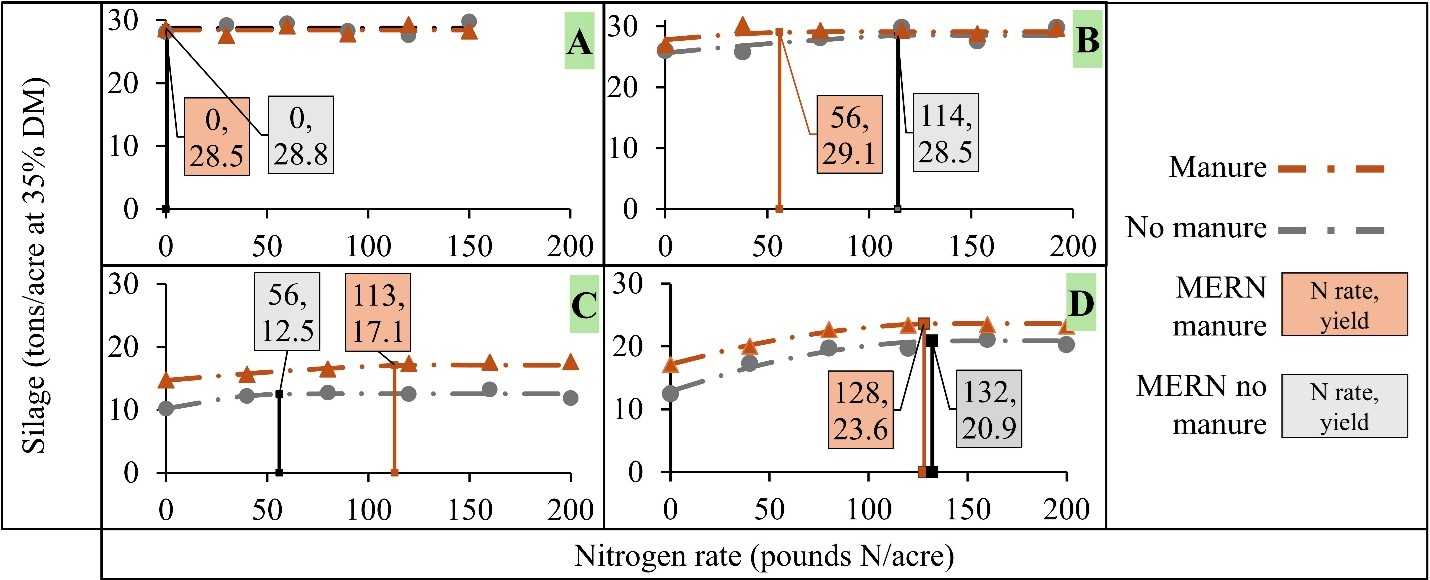
We observed no yield response to manure or sidedress N application in three trials (Figure 3A, Table 1 trial A). That was likely due to high N credits from past manure applications. Yet those trials were among the highest-yielding ones and had excessive CSNT results.
At the Most Economical Rate of N (MERN, the N rate that maximizes economic return), manure replaced inorganic N fertilizer in six trials by lowering sidedress fertilizer needs (Figure 3B, Table 1 trial B). In the manure strips for these trials, yields at MERN were higher than the yields at the MERN of the no-manure plots.
In three trials manure applications increased yields to such elevated levels (2.3 to 4.6 tons/acre), that it also increased the crop’s need for fertilizer N (Figure 3C, Table 1 trial C).
Significant yield bumps due to manure application were documented in fourteen trials. These yield bumps were also present in all five “carry-over” trials, where we saw that manure applied in year 1 benefited yields in the second year after application (Figure 3D, the carryover study of Figure 3C trial, Table 1 trial D).
Figure 3. Four examples of crop response to manure and sidedresss N as part of the statewide Value of Manure trials conducted between 2022 and 2024. Orange text boxes are the MERN and yield at MERN for manured plots; gray text boxes are MERN and yield at the MERN for no-manure plots. Yields are in tons/acre at 35% dry matter (DM).
Table 1. Most economic rates of N (MERN) for no-manure and manure plots and manure-induced yield increase (tons/acre at 35% dry matter) for four examples of crop response to manure and sidedress N as part of the statewide Value of Manure trials conducted between 2022 and 2024.
Trial
No manure MERN
Manure MERN
Manure-induced yield increase
————- pounds N/acre ————-
tons/acre
A
0
0
0
B
114
56
0.6
C
56
113
4.6
D *
132
128
2.7
*Note: Trial D was a carryover study where manure was applied in the spring of 2023 and we tested its value for 2024 corn.
Future Plans
To re-evaluate the current N crediting system and learn how to predict and take into account yield bumps, the Value of Manure project requires the addition of more trials beyond the nineteen trials completed so far. Thus, the Value of Manure Project will continue in 2025. We will be testing additional manure types and application methods in various soil types and weather conditions and follow up with several sites to determine carryover benefits into the third year after application.
Authors
Presenting author
Juan Carlos Ramos Tanchez, On-Farm Research Coordinator, Nutrient Management Spear Program, Cornell University
Corresponding author (name, title, affiliation)
Quirine M. Ketterings, Professor, Cornell University, qmk2@cornell.edu
Additional authors
Kirsten Workman, Nutrient Management and Environmental Sustainability Specialist, PRO-DAIRY and Nutrient Management Spear Program, Cornell University; Carlos Irias, Master Student, Nutrient Management Spear Program, Cornell University.
We thank the farms participating in the project and their collaborators for their help in establishing and maintaining each trial location, and for providing valuable feedback on the findings. This project has been funded by Northern New York Agricultural Development Program, New York Farm Viability Institute, New York Department of Environmental Conservation, New York Department of Agriculture and Markets, Dairy Management Inc., and the Foundation for Food & Agricultural Research.
The authors are solely responsible for the content of these proceedings. The technical information does not necessarily reflect the official position of the sponsoring agencies or institutions represented by planning committee members, and inclusion and distribution herein does not constitute an endorsement of views expressed by the same. Printed materials included herein are not refereed publications. Citations should appear as follows. EXAMPLE: Authors. 2025. Title of presentation. Waste to Worth. Boise, ID. April 7–11, 2025. URL of this page. Accessed on: today’s date.
Growers often use total nitrogen (N) concentration of dairy manure to estimate plant available N for crop production. This estimate often does not take into account the role soil properties may have on N mineralization (Nmin) rates. This study aims to determine how soil properties impact Nmin rates of dairy manure and composted dairy manure by aerobic incubation. The soil properties investigated, including soil texture, percent organic matter, pH, EC, buffer pH, NO3-N, NH4-N, Olsen P, K, Ca, Mg, Na, CEC, S, Zn, Fe, Mn, Cu, B, and CaCO3 equivalent, which are all accessible to producers sending soil samples to a commercial soil laboratory. The goal of this project is to incorporate soil properties into N availability prediction models for dairy manure to improve N use efficiency of field-applied manure.
What Did We Do?
A total of 16 different soil series were sampled throughout Oregon, Washington, and Idaho in major dairy producing counties at a 12-inch depth. These soils represent over 1.6 million acres in the Pacific Northwest (PNW). One solid dairy manure was sampled in Idaho and one composted dairy manure was sampled in Oregon to be applied to the soils during incubation. All the soils were analyzed for a full suite of soil physiochemical properties at a local soil testing laboratory. The manures similarly received a full analysis at the same laboratory.
We conducted a 12-week incubation of manure-amended soils at 77°F (25°C), sampling periodically for nitrate and ammonium to determine the difference in Nmin rates with changes in soil physiochemical properties. Approximately 1.1 lbs (500 g) of soil was added to 1-gallon Ziplock bags and brought to 80% field capacity. The soils were treated with dairy manure, composted manure, or no manure at a rate of approximately 400 lb N/acre (200 mg N/kg soil) with four replicates for each soil and treatment. Each of the 192 samples were randomly assigned a sample number corresponding to their location inside the incubator. The closed and loosely rolled bags were stored in 12 by 9 by 7-inch cardboard boxes, then placed inside an incubator at 77°F for 12 weeks. Soils were sampled at weeks 0, 2, 4, 8, and 12, where part of the sample was used to monitor soil moisture, and the other was frozen for future analysis. Analysis of the frozen samples for nitrate and ammonium content was conducted using a microplate spectrophotometer using vanadium (III) chloride and sodium salicylate methods, respectively.
What Have We Learned?
The analysis of frozen samples has just begun at the time of submission. Initial results will be available on the poster presented.
Future Plans
The next steps of this project are to conclude the nitrate and ammonium analysis of the soil samples and create Nmin curves with this data for each soil and treatment. These curves will be analyzed to determine if the differences in Nmin rates correlate with any of the tested soil physiochemical properties and which properties are most influential. Finally, we will create a model based on correlation data to express the changes in nitrogen mineralization depending on soil physiochemical properties that can be used by producers to adjust their dairy manure application rates depending on their soil test results.
Authors
Presenting author
Ryan A. Auld, Soil Science Graduate Student, Oregon State University
Jennifer Moore, Research Soil Scientist, Forage Seed and Cereal Research Unit, U.S. Department of Agriculture Agricultural Research Service; Yakun Zhang, Associate Professor, Oregon State University; Christopher Rogers, Research Soil Scientist, Northwest Irrigation and Soils Research, U.S. Department of Agriculture Agricultural Research Service
I’d like to acknowledge the BUILD Dairy program and the Oregon Dairy Farmers Association for their support of this project, as well as the many producers who have allowed me to sample soils from their farms.
The authors are solely responsible for the content of these proceedings. The technical information does not necessarily reflect the official position of the sponsoring agencies or institutions represented by planning committee members, and inclusion and distribution herein does not constitute an endorsement of views expressed by the same. Printed materials included herein are not refereed publications. Citations should appear as follows. EXAMPLE: Authors. 2025. Title of presentation. Waste to Worth. Boise, ID. April 7–11, 2025. URL of this page. Accessed on: today’s date.
Methane (CH4) emissions from manure storage are a substantial contributor to the cradle-to-farmgate climate footprint for many dairy farms, especially for farms storing manure as liquid or slurry (Rotz et al., 2021). Dairy systems handle, treat, and store manure in various ways. In combination with environmental conditions, these differences in manure-related structures and processes potentially cause substantial farm-to-farm variability in CH4 production and intensity. However, few methods are available to estimate CH4 emissions specific to a manure storage or farm system.
To enable estimation of CH4 emission rate per unit of manure (methane emission rate, MER), research by Andersen et al. (2015) tested a laboratory assay on swine manure from deep pits. These authors showed that MER was related to manure chemical composition and varied across the year, with the highest values recorded in late fall. Our research aimed to build on Andersen et al. (2015) by testing dairy rather than swine manure to 1) compare MER across a variety of manure types, storage types, and typical storage durations, 2) examine seasonal differences in MER, and 3) quantify farm-to-farm and storage-to-storage variation in MER. Ultimately, we expected to illustrate how the MER laboratory assay could be used in estimating farm-specific CH4 emission rates from dairy manure storages.
What Did We Do?
We partnered with 27 dairies in the U.S. Upper Midwest with liquid and slurry manure storages. At approximately 2–4-month intervals throughout 2024, we collected composite samples (n = 208) representing various manure types, typical storage durations, and storage types. Most samples were whole manure (n = 165, 79%) or liquid separated manure (n = 34, 16%), with remaining samples representing flush water and digestate. Samples represented areas where manure was stored for short durations (≤1 mo.; n = 120, 58%) and long durations (>1 mo.; n = 88, 42%). Most long-term storage was unroofed, and most short-term storage was roofed. Samples represented transfer pits (n = 84, 40%), unroofed basins or pits (n = 67, 32%), and below-building pits (n = 30, 14%), among other storage types. Samples were distributed evenly across seasons for most farms, except that fewer samples were collected during winter due to outdoor storages freezing over.
For the MER assay, we incubated 75.06 ± 0.02 g (mean ± standard error) of manure at 72°F in triplicate 100 mL serum bottles for 2.99 ± 0.01 days. Then, we measured gas displacement with a syringe and headspace CH4 concentration with gas chromatography (Agilent 490 Micro GC, Agilent Technologies, Inc., Santa Clara, CA). We calculated MER as the average CH4 emission (mL) at 72°F per liter of manure per day. To examine differences due to manure type, typical storage duration, storage type, and season, we fit linear mixed models to log-transformed MER, then back-transformed model-implied means and standard errors. Additionally, we examined variance components attributable to individual storages and farms in relation to the residual variance. Storage-to-storage differences explained a small amount of total variance, so the random effect of storage was removed. Significance was declared at p<0.05.
What Have We Learned?
Across samples, the MER was highly variable and right-skewed (mean = 37, median = 21, standard deviation = 45 mL CH4 L-1 d-1; Figure 1), with a small fraction of extremely high values (maximum = 236 mL CH4 L-1 d-1). In contrast with our expectations, we found no effect of manure type, typical storage duration, and storage type on MER. Season influenced MER (F [3, 183.4] = 11.3, p < 0.001), with Fall samples exhibiting a larger MER compared with other seasons (Table 1). Larger MERs in Fall samples were driven by greater gas volume and CH4 concentrations in headspace; model-implied means of both variables nearly doubled in Fall compared with other seasons. Considering that all samples were incubated at the same temperature during the MER assay, greater MER during Fall may indicate that these samples had more abundant and active methanogen populations. Additionally, differences in chemical and physical properties of manure may have enhanced substrate availability for methanogenesis in Fall samples relative to other seasons.
Table 1. Results of a laboratory assay to estimate methane emission rate from dairy manure samples (n = 208) by incubating at 72°F in serum bottles for 3 days.
Model-Implied Mean (Confidence Interval)
Variable
Spring
Summer
Fall
Winter
Volume displacement, mL
14 (3, 25)
16 (4, 27)
26 (14, 37)
13 (0, 26)
Headspace methane, %
5 (3, 10)
8 (5, 16)
14 (8, 26)
6 (3, 12)
Methane emission rate,
mL CH4 L-1 d-1
13 (7, 25)
22 (11, 43)
41 (21, 79)
15 (7, 33)
Although our results illustrated that the mean MER was generally similar across categories of manure types, storage durations, and storage types, we found that between-farm differences accounted for 18% of the total variance in MER. In other words, samples from the same farm were correlated on average 0.18. This suggests that there are farm-to-farm differences in MER that were not explained by the predictors we considered as fixed effects.
Figure 1. Methane emission rates of samples (n = 208 points) showing the median and first and third quartiles (box) with whiskers 1.5 times the interquartile range.
Future Plans
In future work on this project, we plan to explore if between-farm differences in MER can be explained by other farm meta-data such as bedding type, manure removal frequency, storage volume, and surface area of manure. Additionally, we will explore relationships between manure chemical composition (total solids, volatile solids, total nitrogen) and MER. Similar to Andersen et al. (2015), we are examining the temperature sensitivity of methanogenesis in different sample types. In subsequent work, we may consider relating MER to other chemical constituents in manure samples related to substrate availability (e.g., fiber fractions) or fermentation end-products (e.g., volatile fatty acids).
Authors
Presenting author
MaryGrace Erickson, Postdoctoral Associate, University of Minnesota
Corresponding author
Erin Cortus, Associate Professor and Extension Engineer, University of Minnesota, ecortus@umn.edu
Additional author
Noelle Cielito Soriano, Ph.D. Candidate, University of Minnesota
Additional Information
Andersen, D. S., Van Weelden, M. B., Trabue, S. L., & Pepple, L. M. (2015). Lab-assay for estimating methane emissions from deep-pit swine manure storages. Journal of Environmental Management, 159, 18–26. https://doi.org/10.1016/j.jenvman.2015.05.003
Rotz, A., Stout, R., Leytem, A., Feyereisen, G., Waldrip, H., Thoma, G., Holly, M., Bjorneberg, D., Baker, J., Vadas, P., & Kleinman, P. (2021). Environmental assessment of United States dairy farms. Journal of Cleaner Production, 315, 128153. https://doi.org/10.1016/j.jclepro.2021.128153
Acknowledgements
We thank the farms who participated in this research for providing samples and data. Additionally, we are grateful to Kevin Bourgeault, Seth Heitman, Sabrina Mueller, and Jacob Olson for contributing to sampling and laboratory analysis. This research is supported by USDA NIFA Award 2023-68008-39859, and the Minnesota Rapid Agricultural Response Fund.
The authors are solely responsible for the content of these proceedings. The technical information does not necessarily reflect the official position of the sponsoring agencies or institutions represented by planning committee members, and inclusion and distribution herein does not constitute an endorsement of views expressed by the same. Printed materials included herein are not refereed publications. Citations should appear as follows. EXAMPLE: Authors. 2025. Title of presentation. Waste to Worth. Boise, ID. April 7-11, 2025. URL of this page. Accessed on: today’s date.
Per- and polyfluoroalkyl substances (PFAS) are persistent in the environment and in humans. While agriculture is not the source of PFAS, feed and animal production are potential transfer points. This webinar shares experiences from Maine, where PFAS was detected in soil, feed, milk, and meat and initiated a multi-pronged response and remediation approach from multiple agencies, on multiple farms. Our speakers will share the important distinctions between PFAS chemicals, short- and long-term ramifications for local farms, and remediation techniques – both implementation and research scale. This presentation was originally broadcast on December 13, 2024.Continue reading “Responding to PFAS on Dairy Farms in Maine”
Manure is a valuable source of crop-essential nutrients that, when managed carefully, can help build soil organic matter, enhance nutrient cycling, and improve overall soil health and climate resilience over time. In 2022, a statewide on-farm research project was initiated in New York State to quantify the nitrogen (N) replacement value, corn silage or grain yield, and soil health enhancements of various manure sources. Between 2022 and 2023, eleven on-farm field trials were implemented. Yield data are being used to quantify differences in most economic N rate between manured and non-manured strips, and to quantify the yield impact of the manure applications. In 2024, eight additional trials were added using various manure sources. Results so far indicate that manure can offset N fertilizer needs and increase corn silage yield beyond its nutrient contributions, but impacts are field-specific, reflecting differences in field histories and growing conditions. Assessments of soil microbial biomass for sites in 2023 and 2024 reflected the manure history for trial locations and suggest that mid-season assessments may help identify where nitrogen fertilizer addition is beneficial for the crop and where not. Assessment of variability of different manure sources point to the importance of manure sampling and analyses. Preliminary results will be shared. This presentation was originally broadcast on October 18, 2024.Continue reading “Managing Dairy Manure for Increased Soil Health and Forage Production Sustainability”
Agriculture is the largest source of ammonia emissions and contributes to nitrogen deposition which can impact ecosystem health. This webinar introduces the topic of nitrogen deposition and provides an overview of the role of the National Atmospheric Deposition Program (NADP) in determining nitrogen deposition sources. In addition, the speakers provide an overview of a region being impacted by agriculture related nitrogen deposition and discusses agricultural management practices that may reduce ammonia emissions and nitrogen deposition. This presentation was originally broadcast on September 20, 2024.Continue reading “The Role of Agriculture in Atmospheric Nitrogen Deposition: Sources, Impacts, and Management”
Many changes have occurred in the technology, management, and resulting productivity and environmental impacts of United States dairy farms over the past 50 years. Based on research recently published in the Journal of Dairy Science, Dr. Al Rotz will discuss how changes in production have impacted 13 environmental metrics and where improvements can still be made in the future. This presentation was originally broadcast on August 16, 2024.Continue reading “Fifty Years of Environmental Progress for US Dairy Farms”
This webinar will focus on assisting livestock farmers and veterinarians to better identify, diagnose, and treat sick animals with the goal of improving farm efficiency and antibiotic stewardship. This webinar is brought to you by the iAMResponsibleTM Project, a nationwide team of researchers and extension experts working to develop and deliver effective outreach on antimicrobial resistance for diverse audiences. This presentation was originally broadcast on August 18, 2023. Continue reading “Improving disease identification, treatment, & antibiotic stewardship in livestock production”
Manage Cookie Consent
To provide the best experiences, we use technologies like cookies to store and/or access device information. Consenting to these technologies will allow us to process data such as browsing behavior or unique IDs on this site. Not consenting or withdrawing consent, may adversely affect certain features and functions.
Functional
Always active
The technical storage or access is strictly necessary for the legitimate purpose of enabling the use of a specific service explicitly requested by the subscriber or user, or for the sole purpose of carrying out the transmission of a communication over an electronic communications network.
Preferences
The technical storage or access is necessary for the legitimate purpose of storing preferences that are not requested by the subscriber or user.
Statistics
The technical storage or access that is used exclusively for statistical purposes.The technical storage or access that is used exclusively for anonymous statistical purposes. Without a subpoena, voluntary compliance on the part of your Internet Service Provider, or additional records from a third party, information stored or retrieved for this purpose alone cannot usually be used to identify you.
Marketing
The technical storage or access is required to create user profiles to send advertising, or to track the user on a website or across several websites for similar marketing purposes.