Effects of EcoCalTM on Ammonia Emission from a High-Rise Layer House

Reprinted, with permission, from the proceedings of: Mitigating Air Emissions From Animal Feeding Operations Conference.

This Technology is Applicable To:

Species: Poultry (Layers)
Use Area: Animal Housing
Technology Category: Ration Manipulation
Air Mitigated Pollutants: Ammonia

System Summary

Continuous emission measurements at two mechanically-ventilated, high-rise layer houses were conducted to study the effects of Ecocal, a feed amendment designed to reduce NH3 emissions. Data presented in this paper was collected at a commercial egg production facility in October to January. The hens in house 2 were fed EcoCal for comparison with the standard diet used in house 1. EcoCal utilizes gypsum, an acidogen, and zeolite, an indigestible cation exchanger to lower manure pH, thus reducing NH3 emissions. Feeding a diet comprising 7% EcoCal significantly reduces manure ammonia emissions by effectively sequestering ammonium in the manure. An average difference of 51% was observed between the houses when EcoCal was implemented for about six weeks, after the house 2 emission rates appeared to have stabilized.

The application of EcoCal was expected to further NH3 emissions more than 51%, but the test was hindered by several unexpected incidents such as a major water line break in the house 2 manure pit and disruption of feed delivery due to a major snow storm. The initial feed costs were significantly increased when EcoCal is added to the diet.


Applicability and Mitigating Mechanism

  • Decreasing manure pH reduces NH3 emission
  • EcoCal is a feed supplement for laying hens, including organic egg production.
  • EcoCal consists of natural minerals such as gypsum and zeolite, to reduce manure pH and sequester more manure nitrogen


Limitations

  • Diet should be limited to less than 60% of the dietary calcium supplied by EcoCal, because greater quantities of gypsum can result in thin egg shell and lower layer productivity
  • The cost of EcoCal can be variable, because it is not commercially available and delivery expense depends on geographical location.


Cost

The gross cost of adding EcoCal was about 2.4 cents per hen per month or $28,700/yr per 100,000 hens. The effects of EcoCal on egg production were not evaluated in this test, but any increases in egg production would offset the extra cost.

Authors

Teng Teeh Lim1, Alber J. Heber1, E. Carroll Hale III2, Ji-Qin Ni1, Lingying Zhao3
1Purdue University, 2 Rose Acre Farms, 3Ohio State University
Point of Contact:
limit@purdue.edu

The information provided here was developed for the conference Mitigating Air Emissions From Animal Feeding Operations Conference held in May 2008. To obtain updates, readers are encouraged to contact the author.

Feeding a Combination of Acidogenic Materials and Cation Exchangers Reduces Manure Ammonia Emissions and Improves Laying Hen Performance

Reprinted, with permission, from the proceedings of: Mitigating Air Emissions From Animal Feeding Operations Conference.

The proceedings, “Mitigating Air Emissions from Animal Feeding Operations”, with expanded versions of these summaries can be purchased through the Midwest Plan Service.

This Technology is Applicable To:

Species: Poultry (Layers)
Use Area: Animal Housing
Technology Category: Ration Manipulation
Air Mitigated Pollutants: Ammonia

System Summary

Feeding a combination of acidogens and indigestible cation exchangers reduces manure ammonia emission rates by sequestering ammonium in the manure. Average reductions of up to 68% have been noted in production environments. Reduced levels of ammonia in the production environment improve bird and worker health, reduces bird mortality, and improves productivity.


Applicability and Mitigating Mechanism

  • Ammonia emissions are reduced through the use of alternative feed components.
  • The technology is suitable for use in any layer housing system.
  • Mitigation of manure ammonia emissions is due to a combination of reduced manure pH and cation exchangers present in the manure.

Limitations

  • Overfeeding acidogenic materials can adversely affect performance and productivity.
  • Effective levels of acidogens are typically well below the threshold level at which adverse effects would be noted.
  • No adverse effects due to overfeeding cation exchangers have been noted.
  • Cation exchange capacity, buffering capacity, and selectivity for ammonium are critical to the performance of this system.
  • Acceptable ratios of acidogen to cation exchanger depend on acidogen pKa and cation exchanger buffering capacity.


Cost

Suitable acidogens and cation exchangers are available in the marketplace. Gypsum/zeolite blends are commercially available as a pre-mix. Implementation of gypsum/zeolite blends depends on feed bin availability, while admixing sodium bisulfate and either zeolite or humate can be done through a microbin system.

Per-ton feed costs are increased when the system is utilized, but increased feed costs are more than offset by reduced hen mortality, improved feed conversion and egg production, and reduced per-dozen production costs.


Authors

E. Carroll Hale III
Earth Net LLC Point of Contact:
admin@usedi.com

The information provided here was developed for the conference Mitigating Air Emissions From Animal Feeding Operations Conference held in May 2008. To obtain updates, readers are encouraged to contact the author.

Microbial Additives to Reduce Ammonia Emission from Poultry Houses

Reprinted, with permission, from the proceedings of: Mitigating Air Emissions From Animal Feeding Operations Conference.

The proceedings, “Mitigating Air Emissions from Animal Feeding Operations”, with expanded versions of these summaries can be purchased through the Midwest Plan Service.

This Technology is Applicable To:

Species: Poultry
Use Area: Animal Housing
Technology Category: Ration Manipulation
Air Mitigated Pollutants: Ammonia

System Summary

Use of Bacterial products (Bacillus based) such as Micro Treat P and Provalen has demonstrated to effectively reduce litter ammonia emissions in broiler, layer and turkey production systems. It has been known that gram negative bacteria in the litter and fecal matter break down the nitrogen and convert to ammonia as result of their growth and multiplication. It is also been known that certain bacteria have the property to help in reduce gram negative bacteria in the litter and droppings there by retaining nitrogen in the litter and fecal matter. Micro Treat P is a proprietary product designed and produced by Agtech Products, Inc. This is added to the poultry litter. Provalen is a bacillus based feed additive designed for layers.

Applicability and Mitigating Mechanism

  • Gram negative bacteria are highly prevalent in poultry litter and waste.
  • These Gram negative bacteria convert uric acid in the poultry waste to make harmful ammonia.
  • Application of Micro Treat P and Provalen lowers the gram negative counts in the litter and poultry waste.
  • The reduction in Gram Negative bacterial population helps in nitrogen retention and reduced ammonia production.

Limitations

  • It is a long term ammonia reduction tool.
  • The mode of action of microbial litter amendments are cumulative in nature and do not accomplish a quick ammonia reduction like chemicals.

Cost

MicroTreat P comes foil packs and is concentrated for convenient use. The application rate is based on type of poultry and fecal material produced. Typically the treatment costs are as follows: Broilers $0.005 per bird, Turkeys $0.055 (40 pound tom) and $0.028 (16 pound hen). The cost to treat layers feeds with Provalen is approximately $2.00/ ton.

Authors

Daniel Karunakaran
Agtech Products, INC. Waukesha, WI
Point of Contact:
Dr. Daniel Karunakaran, dkarunakaran@agtechproducts.com

The information provided here was developed for the conference Mitigating Air Emissions From Animal Feeding Operations Conference held in May 2008. To obtain updates, readers are encouraged to contact the author.

Snap-Shot Assessments of Nutrient Use on Dairy Farms

Nutrient Use Efficiency

Escalations in feed and fertilizer cost, and ebbing milk prices are motivating many dairy farmers to find new ways to improve nutrient use efficiency (NUE) on their farms. But how can NUE be determined and monitored easily on dairy farms, and what improvement in NUE can be realistically expected? Over the past several years researchers at the U.S. Dairy Forage Research Center and the University of Wisconsin-Madison have been developing and using rapid assessment methods to provide snap-shot assessments of feed, fertilizer, and manure use on dairy farms in various settings. The most recent work was a survey of 54 Wisconsin dairy farms known as On Farmers’ Ground.

Snap-Shot Assessments of Nutrient Use on Dairy Farms Webcast

This webcast describes and demonstrates the usefulness of using rapid assessment methods to provide snap-shot assessments of feed, fertilizer, and manure use on dairy farms in various settings.

Resources Available Through “On Farmers’ Ground”

  • Fact Sheet which outlines the procedures used to provide ‘snap-shot’ assessments of feed, fertilizer and manure use. Some examples are provided of the information obtained using snap-shot assessment techniques.
  • Survey Questionnaire designed to compile information on herd size and composition, livestock facilities, land use, management practices, and motivations and goals related to feed, fertilizer and manure management.
  • Manure Tracking Book used to systematically tract how, when and where farmers spread manure, and factors that influenced farmer decisions related to manure management.
  • Final Farmer Report which contains analytical results of feed and manure samples taken during the farm visits, including information on how farmers may use these results to improve feed and manure management. The Final Farmer Report also contains estimates of manure collection, as well as a series of farm maps depicting crop rotations, manure spreading practices, nitrogen and phosphorus applications as fertilizer, manure and legume-fixed N, and farm cropland areas that are impacted by USDA-NRCS 590 Nutrient Management Standards.
  • Four scientific journal articles related to the On Farmers’ Ground project

Author

J. Mark Powell
Soil Scientist-Agroecology, USDA-ARS US Dairy Forage Research Center
Professor of Soil Science, University of Wisconsin-Madison
1925 Linden Drive West
Madison, WI 53706
<mark.powell@ars.usda.gov>

Diet Modification to Reduce Odors, Gas Emissions and Nutrient Excretions from Swine Operations

Can Changing Pig Diets Reduce Odor Emissions?

The pork industry has undergone a rapid change in the past two decades, with a decrease in farm numbers and an increase in farm size. These changes magnify the stress of the compatibility of pork production with neighbors in rural America. Concerns of the potential impact of the swine operation on water and air quality and health are also raised due to numerous compounds often produced from anaerobic degradation of animal manures, such as, sulfurous compounds, volatile fatty acids (VFAs), and ammonia (NH3). Since the pig is the point source of excreted nutrients resulting in gas and odor emissions, diet modification has the potential to reduce nutrient output and improve air quality.

Our hypothesis is that by utilizing a low nutrient excretion diet formulation and an alternative manure management strategy, the amount of nutrient output and gas/odor emissions will be reduced over the wean-finish period.

Activities

A total of 1, 920 pigs (initial BW = 5.29 kg) were used in a 2 x 2 factorial, wean-finish experiment to determine the effects of diet (control, CTL vs. low nutrient excretion, LNE) and manure management (6 mo. deep-pit, DP vs. monthly pull plug-recharge, PP) on growth performance, nutrient output, and air quality. Pigs were housed in a 12-room environmental building.

Pigs were split-sex and phase-fed to meet or exceed their nutrient requirements (NRC, 1998) at different stages of growth. The CTL and LNE diets were corn-soybean meal based and formulated to an equal Lysine:calorie. The LNE diet formulation had reduced CP and P, increased synthetic amino acids, phytase, non-sulfur trace mineral premix and added fat. Improvements in pig performance were observed over the wean-finish period.

Did Lysine Affect Performance or Odorous Emissions?

Pigs fed the LNE diets were 4.3 kg heavier (131.2 vs. 126.9 kg) at market, gain was increased by 0.03 kg/d (0.83 vs. 0.80 kg/d), feed intake was reduced by 0.16 kg/d (1.95 vs. 2.11 kg/d), and overall feed efficiency was increased by 11.6% (0.43 vs. 0.38) compared to CTL fed pigs (P<0.01). In addition, manure generation was reduced by 0.39 L/pig/d when the LNE diets were fed vs. the CTL diets (4.05 vs. 4.44 L/pig/d, P<0.008).

Excretion of total N, P, and K was reduced (P<0.001) by 27.5, 42.5, and 20.4%, respectively, from LNE fed pigs. Pigs fed the LNE diets had a 25.5, 23.8, 32.3, 18.5, 35.8, and 26.7% reduction (P<0.05) in manure acetate, iso-butyrate, iso-valerate, valerate, and total VFA production, respectively, compared to CTL fed pigs. Using the PP manure strategy reduced manure ammonium N and VFA production by 10.3 % (16.5 vs. 18.4 g/pig/d; P<0.002) and 20.5% (26.0 vs. 32.7 mM/pig/d; P<0.001), respectively, compared to DP strategy. Pigs fed LNE diets had a 13.6% (P<0.001) reduction in aerial NH3 emissions over the wean-finish period compared to pigs fed CTL diets. Aerial H2S and SO2 emissions and odor were not different (P>0.10) between dietary treatments.

Why is This Important?

Feeding LNE diet formulations are effective in reducing environmental impacts of pork production while maintaining growth performance. In addition, utilizing a monthly pull plug-recharge manure management strategy can improve air quality parameters, however can be more labor intensive.

For More Information

Contact us at jradclif@purdue.edu or (765)496-7718.

By Scott Radcliffe, Brian Richert, Danielle Sholly, Ken Foster, Brandon Hollas, Teng Lim, Jiqin Ni, Al Heber, Alan Sutton – Purdue University

This report was prepared for the 2008 annual meeting of the regional research committee, S-1032 “Animal Manure and Waste Utilization, Treatment and Nuisance Avoidance for a Sustainable Agriculture”. This report is not peer-reviewed and the author has sole responsibility for the content.

Phosphorus Mass Balance on Livestock and Poultry Operations

Introduction

This fact sheet has been developed to support the implementation of the Natural Resources Conservation Service Feed Management 592 Practice Standard. The Feed Management 592 Practice Standard was adopted by NRCS in 2003 as another tool to assist with addressing resource concerns on livestock and poultry operations. Feed management can assist with reducing the import of nutrients to the farm and reduce the excretion of nutrients in manure.

Please check this link first if you are interested in organic or specialty dairy production

The Natural Resources Conservation Service has adopted a practice standard called Feed Management (592) and is defined as “managing the quantity of available nutrients fed to livestock and poultry for their intended purpose”. The national version of the practice standard can be found in a companion fact sheet entitled An Introduction to Natural Resources Conservation Service (NRCS) Feed Management Practice Standard 592. Please check in your own state for a state-specific version of the standard.

Mass balance is calculated as the difference between imported and exported mass across the farm boundary. Estimating mass balance can provide critical information for (comprehensive) nutrient management planning and to manage the movement of nutrients and manure. Estimation of whole-farm P mass balance is used to determine the acres of land needed for crop production to use manure P. Environmental risk to surface and ground waters is increased if the amount of P imported into the farm (e.g., from fertilizers, feeds, and animals) exceeds the amount of P exported from the farm (e.g., crops, animals, manure, milk, meat, eggs, and fibers).

In Table 1 are estimates of P excretion derived by mass balance calculations using standard diets, animal performance, and the acres needed for land application at a crop removal rate of 50 pounds P2O5/acre per year. Mass balance estimates vary among farms, depending upon specific inputs and outputs, and should be calculated specifically for each farm when doing nutrient management planning.

Table 1. Examples of annual phosphate (P2O5) excretion and acreage needed for various livestock enterprises per 1,000 head of production to maintain zero P mass balance (imported P = exported P) annually.
Livestock Enterprise Pounds P2O5 Acres needed
Growing-finishing beef 17,500 350
Horses 22,000 440
Lactating dairy cows 86,000 1,720
Dairy heifers 27,000 540
Laying hens 1,200 24
Cow-calf beef 48,000 960
Sheep 13,500 270
Swine breeding herd with phytase 37,000 740
Swine growing-finishing with phytase 3,600 72
Turkeys with phytase 1,300 26

Ways to affect P mass balance

Farms may consider moving manure off site to reduce P mass balance if not enough acreage is available. Additionally, potential feeding strategies to reduce P balance (and excretion), feed costs, and necessary land base include the following:

  1. Routinely complete laboratory analyses of feeds and re-balance rations as needed to meet animals’ P requirements.
  2. Formulate rations to meet the animal’s P requirements for maintenance, lactation, growth, and pregnancy. In general for a lactating Holstein cow, 1 gram of P for each pound of milk produced is sufficient to meet these combined requirements. Based on this, ration P should equal 0.32 to 0.38% in DM depending on feed intake and milk yield (NRC, 2001). Greater concentrations are not necessary unless feed intake is depressed.
  3. Beef and dairy cattle rations may not need P supplementation at all to meet the animals’ requirements if basal ration ingredients have high P concentrations. Discontinuing P supplementation may reduce land base required by 25 to 50% (depending on the amount of over-supplementation in the original feeding program).
  4. If typical rations (e.g., corn silage, soybean meal, alfalfa, and corn grain) contain more P than needed to meet requirements, and if land base is limiting, alternative feedstuffs should be considered. The cost of using alternative feedstuffs may be less than the cost of using common “least-cost” feeds and managing excess manure P.
  5. Swine and poultry are able to absorb only part of the P in diets, so formulate based on “available P.” Grains for swine and poultry can vary from 14 to 50% in available P. In contrast, over 90% of ration P is available to cattle and sheep due to rumen microbial phytase.
  6. Supplemental phytase in corn-soybean meal based-diets for swine and poultry increases the P availability so that 25 to 35% less total ration P is needed.
  7. Pelleting and reducing the particle size of rations can increase the efficiency of P use by swine and poultry by 5 to 10%.
  8. Formulating rations for specific production phases, genotypes and genders. “Phase- feeding” programs for growing swine, poultry and lactating dairy cows can reduce P imports and excretion at least by 5 to 10%.

References

National Research Council. 2001. Nutrient Requirements of Dairy Cattle. 7th rev. ed. Natl. Acad. Sci., Washington, DC.

“Extension programs and policies are consistent with federal and state laws and regulations on nondiscrimination regarding race, sex, religion, age, color, creed, national or ethnic origin; physical, mental or sensory disability; marital status, sexual orientation, or status as a Vietnam-era or disabled veteran. Evidence of noncompliance may be reported through your local Extension office.”


Disclaimer

This fact sheet reflects the best available information on the topic as of the publication date. Date 5-25-2007

This Feed Management Education Project was funded by the USDA NRCS CIG program. Additional information can be found at Feed Management Publications.

Image:Feed mgt logo4.JPG

This project is affiliated with the LPELC.

Image:usda,nrcs,feed_mgt_logo.JPG

Project Information

Detailed information about training and certification in Feed Management can be obtained from Joe Harrison, Project Leader, jhharrison@wsu.edu, or Becca White, Project Manager, rawhite@wsu.edu.

Author Information

David Beede
C.E. Meadows Professor
beede@msu.edu
Dale Rozeboom
Associate Professor
rozeboom@msu.edu
Department of Animal Science
Michigan State University

Reviewer Information

Brian Perkins – Consulting Nutritionist

Katherine Knowlton – Virginia Tech

Partners

Image:Logos2.JPG

Understanding Nitrogen Utilization in Dairy Cattle

Contents


Introduction

This fact sheet has been developed to support the implementation of the Natural Resources Conservation Service Feed Management 592 Practice Standard. The Feed Management 592 Practice Standard was adopted by NRCS in 2003 as another tool to assist with addressing resource concerns on livestock and poultry operations. Feed management can assist with reducing the import of nutrients to the farm and reduce the excretion of nutrients in manure.

The Natural Resources Conservation Service has adopted a practice standard called Feed Management (592) and is defined as “managing the quantity of available nutrients fed to livestock and poultry for their intended purpose”. The national version of the practice standard can be found in a companion fact sheet entitled “An Introduction to Natural Resources Feed Management Practice Standard 592”. Please check in your own state for a state-specific version of the standard.

Nitrogen (N) is the building block of proteins in feeds and forages. Protein is typically the most expensive component of the purchased feeds used in dairy rations. Nitrogen is also receiving more attention as a component of nutrient management plans on dairy farms and potential ammonia emissions.

Understanding how N is used in dairy cattle is important in improving both profitability and decreasing excretion from the cow into the environment. It is important to remember that dairy cows do not have a protein requirement. They really need amino acids available in the small intestine to support tissue growth and milk production. Basically, N utilization in dairy cattle is composed of two components. The first is providing an adequate supply of N and carbohydrates in the rumen to support the growth of rumen microorganisms and the production of microbial crude protein (MCP). The second part of the system is the utilization of amino acids in the small intestine to provide for the needs of the cow.

Please check this link first if you are interested in organic or specialty dairy production

Definitions

N = nitrogen; CP = crude protein; NPN =nonprotein nitrogen; TDN = total digestible nutrients; MP = metabolizable protein; MCP = microbial crude protein; SP = soluble protein; RDP = rumen degradable protein; RUP = rumen undegradable protein; NRC = National Research Council

Feed Nitrogen Fractions

Even though all feeds contain N, there is variation in the quantity of N in each feed and it’s availability and utilization in the dairy cow. Forage testing laboratories determine the quantity of N in the sample and multiply this value by 6.25 to obtain the crude protein (CP) value printed on the analysis report. This calculation assumes that feeds contain 16% N on a dry matter (DM) basis. An example calculation is:

Alfalfa silage = 3% N * 6.25 = 18.75% CP (both on a DM basis)

The challenge is that feeds could have the same CP value, but have a different feeding value to the dairy cow. Consider the following examples:

Alfalfa hay, alfalfa silage and alfalfa pasture – All 20% CP.

Raw and roasted soybeans – Both with 40% CP

Even though these feeds have the same CP level, we would not expect the same level of N utilization and milk production. If we are feeding 4 pounds/cow/day of raw soybeans to a dairy cow producing 80 pounds of milk, replacing these with 4 pounds of roasted soybeans would increase predicted milk production on a protein basis by 2-3 lbs. What is the reason for this?

One reason is that there are a number of N compounds found in feeds. This means that we need to better define the types of N compounds present in feeds. A simple to start is to classify feed N as either true protein or NPN. These can be defined as:

True protein = The N in feeds found in complex and linked structures as amino acid combinations. Examples are: albumins, globulins and amino acids. These feeds will vary in both the rate and extent of degradation that occurs in the rumen.

NPN = This is the N in simple compounds such as ammonia or urea (not as amino acids). These are considered to be rapidly available in the rumen.

The above breakdown is a start, but the true protein component needs to be better defined for use in ration formulation or evaluation programs. This is most commonly done in the following manner:

RDP = that portion of the total N intake that is degraded in the rumen. The NPN fraction is included in RDP.

RUP = that portion of the total N that is not degraded in the rumen and passes intact to the small intestine. There is a portion of the RUP fraction that is not available or digested in the small intestine and passes out in the feces. This is fraction C in the system described by Van Soest (1994).

Ruminal N Metabolism

A portion of the feed N that enters the rumen will be degraded to compounds such as peptides, amino acids or ammonia. The primary mechanism for this breakdown in the rumen is microbial proteolysis. The solubility, structure, and particle size of the feed will all influence the amount of degradation that takes place. There will always be a portion of the feed N that enters the rumen that is not degraded (RUP).

All RDP does not breakdown and be converted to ammonia at the same rate. Van Soest (1994) provided an overview of a system to define N sub-fractions that would permit better characterization of feed N availability and use in the dairy cow. This system includes the following fractions:

A – This is mainly NPN, amino acids, and peptides that are “instantly” available in the rumen.

B1 – This fraction has a fast rate of degradation in the rumen.

B2 – This fraction has a variable rate of degradation in the rumen.

B3 – This fraction has a slow rate of degradation in the rumen.

The use of this approach assists in doing a better job of describing N utilization in the rumen and improving the efficiency of feed N use. The use of this approach does require additional feed analysis data and computer formulation programs designed to utilize this information.

Microbial Protein

Microbial protein (MCP) is produced in the rumen by the rumen microorganisms. The key factors that determine the quantity of MCP synthesized is the quantity of ammonia available in the rumen and the supply of fermentable carbohydrates to provide an energy source. The availability of peptides may also stimulate the production of MCP by some rumen microorganisms. The NRC (2001) predicts MCP production as 13% of the discounted TDN (total digestible nutrients) available in the rumen.

Microbial protein can provide 50 – 80% of the amino acids required in the intestine by the dairy cow. Optimizing MCP production helps in increasing the efficiency of N use in the cow and controlling feed costs.
The benefits of MCP are related to:

  • MCP averages about 10% N (60-65% CP).
  • MCP is a good source of RUP.
  • MCP has a high digestibility in the intestine.
  • The amino acid profile of MCP is fairly constant.
  • MCP has an excellent ratio of lysine to methionine.

Protein Systems

There are 2 systems used to evaluate and balance rations for dairy cows on a protein basis. These are the CP (crude protein) and MP (metabolizable) protein systems. The CP system has been the most commonly used system.

The CP system is easy to use and has tabular feed composition and animal requirement information. This system assumes that all N in different feeds is similar in use and value to the cow. The Dairy NRC (2001) indicated that CP was a poor predictor of milk production. Nutritionists have modified the CP system to better meet their needs. They have added SP, RDP and RUP as additional factors to consider when using CP as the base for formulating dairy rations on a protein basis.

The Dairy NRC (2001) has suggested moving to a MP system to better define and refine protein formulation and utilization. This system fits with the biology of the cow. The challenge is that this system is not tabular and requires the use of computer programs to calculate both MP requirements and the MP supplied by feeds and MCP. The industry is changing to an MP approach. This system should provide an opportunity to improve the efficiency of protein use in dairy cattle. The use of this system will also decrease N excretion to the environment and lower potential ammonia emissions.

Total N Use in Dairy Cows

It is important to realize that the dairy cow is a dynamic rather than static system. This means that the actual value of a feed N source will vary depending on a number of factors. These include:

  • The proportion of the total N intake used in the rumen versus the small intestine.
  • The length of time the feed remains in the rumen (rate of passage).
  • The rate at which the feed is degraded in the rumen (rate of digestion).
  • The amino acid profile of the RUP fraction.
  • The digestibility of the RUP and MCP fractions in the small intestine.

This situation is similar to the energy value of feeds that occurs due to differences in dry matter intake (DMI) and rate of passage. Dairy cows with higher levels of DMI have a higher rate of passage and lower feed energy values. This is the reason for discounting feed energy values based on level of DMI and milk production (NRC, 2001).

The NRC (2001) computer model was used to determine the RDP and RUP for soybean meal in a ration for dairy cows. The base ration was for a cow producing 80 pounds of milk and contained 5 pounds of DM from soybean meal. This ration was then evaluated for cows producing 60, 100 or 120 lbs. of milk. The ration ingredients were all kept in the same proportion, but total ration DMI was adjusted using the NRC program predicted intakes. This would be similar to cows fed a 1-group TMR. The RDP and RUP values for soybean meal in this ration were:

Milk, lbs/day RDP, % of CP RUP, % of CP
60 60 40
80 59 41
100 56 44
120 54 46

The reason for the higher RUP value in higher producing cows is the decreased amount of time the soybean meal stays in the rumen. Thus, there is less time for N degradation and proteolysis to take place. This example also indicates the challenge with using tabular values to describe the RDP and RUP fractions in feeds. This is the reason that computer programs that can integrate DMI, rate of passage and rate of digestion are needed as we continue to refine formulation and evaluation approaches.

Summary

Nitrogen is the most expensive component of purchased feed costs on most dairy farms. Ration programs that incorporate the concepts of feed fractions and variable feed contributions to the animal provide an opportunity to fine tune nutrition and improve the efficiency of nutrient use. This will also lower nutrient excretion to the environment and usually improves income over feed cost.

References

NRC, 2001. National Research Council. Nutrient Requirements of Dairy Cattle. 7th rev. ed. National Academy of Science, Washington, DC.

Van Soest, P.J. 1994. Nutritional ecology of the ruminant. Cornell University Press, Ithaca, NY.

“Extension programs and policies are consistent with federal and state laws and regulations on nondiscrimination regarding race, sex, religion, age, color, creed, national or ethnic origin; physical, mental or sensory disability; marital status, sexual orientation, or status as a Vietnam-era or disabled veteran. Evidence of noncompliance may be reported through your local Extension office.”

Disclaimer

This fact sheet reflects the best available information on the topic as of the publication date. Date 4-12-2007

This Feed Management Education Project was funded by the USDA NRCS CIG program. Additional information can be found at Feed Management Publications.

Image:Feed mgt logo4.JPG

This project is affiliated with the Livestock and Poultry Environmental Learning Center.

Image:usda,nrcs,feed_mgt_logo.JPG

Project Information

Detailed information about training and certification in Feed Management can be obtained from Joe Harrison, Project Leader, jhharrison@wsu.edu, or Becca White, Project Manager, rawhite@wsu.edu.

Author Information

L.E. Chase
Cornell University
lec7@cornell.edu

Reviewer Information

Mike Hutjens – University of Illinois

Floyd Hoisington – Consulting Nutritionist

Partners

Image:Logos2.JPG

Preparing to take the American Registry of Professional Animal Scientists (ARPAS) Feed Management Dairy Certification Exam

Introduction

This fact sheet has been developed to support the implementation of the Natural Resources Conservation Service Feed Management 592 Practice Standard. The Feed Management 592 Practice Standard was adopted by NRCS in 2003 as another tool to assist with addressing resource concerns on livestock and poultry operations. Feed management can assist with reducing the import of nutrients to the farm and reduce the excretion of nutrients in manure.

During the early 2000’s the USDA Natural Resources Conservation Service (NRCS) and the American Registry of Professional Animal Scientists (ARPAS) developed a memorandum of understanding “that provides an opportunity for qualified ARPAS members to become Technical Service Providers for NRCS programs in the category of Feed Management”. Put simply, this means that consulting nutritionists are the most appropriate advisors to develop and implement a Feed Management Plan.

Please check this link first if you are interested in organic or specialty dairy production

The NRCS Feed Management 592 Practice Standard

The NRCS Feed Management Practice Standard is defined as “managing the quantity of available nutrients fed to livestock and poultry for their intended purpose”. The purposes of the 592 standard are:

  • supply the quantity of available nutrients required by livestock and poultry for maintenance, production, performance, and reproduction; while reducing the quantity of nutrients, especially nitrogen and phosphorus, excreted in manure by minimizing the over-feeding of these and other nutrients, and
  • improve net farm income by feeding nutrients more efficiently.

The ultimate goal of utilizing the Feed Management Practice Standard 592 is to develop a farm specific Feed Management Plan.

Becoming a Certified Nutritionist to Develop a Feed Management Plan

Information about becoming certified can be accessed at ARPAS Technical Service Provider Program. In addition, the process is described in a companion fact sheet entitled “Becoming A Certified Nutritionist to Develop a Feed Management Plan – Natural Resources Conservation Service (NRCS) Feed Management Practice Standard 592”.

Preparing to take the ARPAS Feed Management Exam

The National Feed Management Education project has collaborated with ARPAS to develop a Feed Management certification exam for each species of beef, dairy, poultry and swine.

In the exam consists of 75% of the questions cover the general topic of feed management and 25% are species specific feed management questions.

Feed Management Workshop

The preparation process for taking the ARPAS Dairy Feed Management exam should begin with attending a Feed Management Workshop to gain knowledge in the process of development and implementation of a feed management plan.

Curriculum and Written Resources

The primary source of written material in support of adoption of Feed Management 592 Practice Standard can be found at Feed Management Publications. A series of fact sheets have been developed to assist with an understanding of the intent of Feed Management 592 Standard, assessment and development checklists, and writing of a Feed Management Plan.

In addition to these fact sheets, developed by the National Feed Management project partners, additional information about feed management can be found at the following websites:

  1. Livestock & Poultry Environmental Learning Community, scroll down and click on Feed Management.
  2. Livestock & Poultry Environmental Stewardship Curriculum
  3. Nitrogen Management on Dairy Farms http://www.dairyn.cornell.edu

“Extension programs and policies are consistent with federal and state laws and regulations on nondiscrimination regarding race, sex, religion, age, color, creed, national or ethnic origin; physical, mental or sensory disability; marital status, sexual orientation, or status as a Vietnam-era or disabled veteran. Evidence of noncompliance may be reported through your local Extension office.”

Disclaimer

This fact sheet reflects the best available information on the topic as of the publication date. Date 5-26-2007

This Feed Management Education Project was funded by the USDA NRCS CIG program. Additional information can be found at Feed Management Publications.

Image:Feed mgt logo4.JPG

This project is affiliated with the LPELC.

Image:usda,nrcs,feed_mgt_logo.JPG

Project Information

Detailed information about training and certification in Feed Management can be obtained from Joe Harrison, Project Leader, jhharrison@wsu.edu, or Becca White, Project Manager, rawhite@wsu.edu.

Author Information

J. H. Harrison jhharrison@wsu.eduand R. A. White, Washington State University
R. Shaver, University of Wisconsin
L. Chase, Cornell University
Glenn Carpenter, Natural Resources Conservation Service

Partners

Image:Logos2.JPG

Strategies to Reduce the Crude Protein (Nitrogen) Intake of Dairy Cows for Economic and Environmental Goals

Contents


Introduction

This fact sheet has been developed to support the implementation of the Natural Resources Conservation Service Feed Management 592 Practice Standard. The Feed Management 592 Practice Standard was adopted by NRCS in 2003 as another tool to assist with addressing resource concerns on livestock and poultry operations. Feed management can assist with reducing the import of nutrients to the farm and reduce the excretion of nutrients in manure.

Of the nitrogen (N) fed to dairy cows, only 21 to 38% actually is exported as milk or meat. That means 62 to 79% of the N fed to cows is for the most part excreted via urine and feces of cows. Most N voided in urine is quickly emitted as ammonia whereas the percent of fecal N converted to ammonia is quite variable depending upon storage management and land application method. Because most N consumed in excess of requirement is excreted in urine, to improve efficiency of N use, urinary N needs to be reduced. Changes in diet formulation can improve efficiency of N use on dairies.

Please check this link first if you are interested in organic or specialty dairy production

Definitions

N = nitrogen; CP = crude protein = N X 6.25; NPN = nonprotein N; TDN = total digestible nutrients; RDP = ruminally degraded protein; LYS = lysine; MUN = milk urea N; MCP = microbial crude protein; RUP = ruminally undegraded protein; MET = methionine; FCM = fat-corrected milk; IOFC = income over feed costs

Historical Diet Formulations For Cows

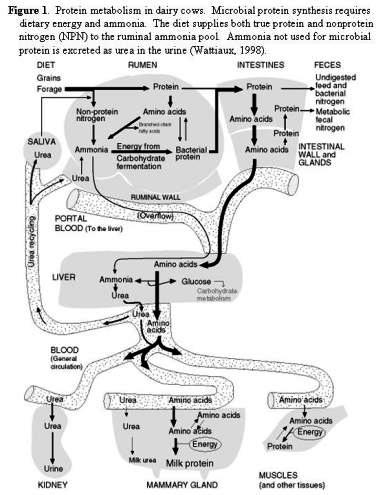
Protein nutrition of dairy cows has evolved over the decades. Initially, the approach was to determine the % or amount of dietary CP that cows needed for milk production. However, any CP consumed in excess of the cows’ requirements is excreted via urine. Thus, by feeding the cow to meet, and not exceed, her CP requirement, N excretion is reduced. The major weakness of formulating diets on a CP basis is that it ignores the type of CP consumed. For example, under this system all N in NPN sources (urea for example) is treated the same as the N in soybean meal, and clearly they are much different. The N in NPN does not include long chains of amino acids in the form of “true” protein whereas most of the N in soybean is amino-acid bound. Therefore, soybean meal contributes amino acids to both the ruminal micro-organisms and to intestinal amino acid absorption whereas NPN contributes only to the latter (Figure 1).

The goal of feeding protein to lactating cows is to support milk protein synthesis while meeting the needs for maintenance, growth and replacement of lost body protein. All proteins synthesized in the body have set amino acid patterns, so if a particular amino acid is lacking during protein synthesis, formation of that protein stops. Thus, we are not really trying to supply dietary protein to cows, we are trying to supply enough of each amino acid such that no single amino acid limits protein synthesis.

Another approach to improve upon balancing diets on a CP basis was the Burrough’s metabolizable protein system (Burroughs et al., 1975). This system considered the amount of dietary N that was solubilized in the rumen and could be used for microbial protein synthesis, a calculation that also involved the amount of TDN available to support microbial growth. To the calculated microbial protein was added the amount of dietary protein that escaped ruminal degradation. Use of ammonia and fermentable carbohydrate for microbial protein synthesis is illustrated in Figure 1. Finally, adjustment factors for digestibility and unavoidable fecal losses were applied to yield a Metabolizable Protein value. This system required knowing the amount of protein in feeds that was converted to ammonia in the rumen, the amount of feed protein that escaped ruminal breakdown, and the TDN value for the feeds. The concept was excellent but the system needed refinement.

The amount of dietary protein that is degraded in the rumen is primarily determined by characteristics of the N-containing compound (e.g., solubility and linkages) and how long it resides in the rumen (Figure 1). Residence time in the rumen, i.e. ruminal passage rate, is determined by total feed intake (the more the cow eats the faster the feed tends to move through the rumen), particle size and specific gravity (smaller, heavier particles move faster than large, light particles through the rumen), and other factors such as how quickly the microbes ferment the feed. Certain feeds are fermented faster than others (barley is fermented faster than sorghum), and feeds can be treated to reduce their rate of protein breakdown (most treatments involve lowering the protein solubility). Obviously the calculations to determine the amount of dietary protein that is degraded, or conversely undegraded, in the rumen get complicated, hence computer models tremendously speed the calculations.

Current approaches to meeting the amino acid needs of cows

First, we try to maximize microbial protein synthesis in the rumen. Microbial protein is high in LYS, and LYS is often the most limiting amino acid for milk production in feeding situations commonly found in the confined operations. Maximizing microbial protein synthesis involves supplying fermentable carbohydrates and soluble N sources to enable rapid bacterial growth. We need ammonia and other forms of soluble N to be available to the bacteria simultaneously with the fermentation of the carbohydrates so the bacteria have everything they need for growth, which includes protein synthesis (Figure 1). If the N is solubilized and degraded too quickly, much is absorbed as ammonia and subsequently excreted as urea N in urine or MUN. If too little N is solubilized in the rumen, the ammonia concentration in the ruminal fluid is too low to maximize microbial protein synthesis (Stokes et al., 1991; Clark et al., 1992). Generally, the amount of fermentable carbohydrate in the rumen is most limiting to microbial protein synthesis. Hence, the NRC (2001) predicts the yield of MCP as 0.13 x TDN (discounted), i.e., 130g MCP/kg of TDN (discounted) when RDP exceeds 1.18 x MCP yield. If the RDP intake is < 1.18 x TDN predicted MCP, then MCP is 0.85 of RDP intake. Thus, if a cow consumes 15 kg of TDN (discounted), MCP flowing to the intestine is estimated as: 15 x 0.13 = 1.95 kg.

Secondly, diets are formulated to supply amino acids for milk production by including dietary proteins that will not be completely degraded in the rumen and have a high content of the amino acids believed to be most limiting for milk production. Some feed proteins have relatively high LYS concentrations (porcine blood meal), some have relatively high MET concentrations (corn gluten meal), and some have a good balance of LYS and MET (fish meal). Thus, diets contain multiple proteins, all of which degrade at different rates in the rumen. In addition, the ruminal degradation rates for the 20 amino acids found in proteins vary substantially. Fortunately, all these data are contained in software programs so the estimated flow of feed amino acids into the small intestine is quickly calculated. Use of computer models allows us to take advantage of complementary protein and other N sources to achieve lower CP diets to achieve comparable milk yields.

Case I.

Using RDP/RUP feed data to achieve diets with a lower % CP.
Reynal and Broderick (2005) fed four diets that varied in RDP. Their diet description and results are given in Table 1. Urinary N excretion decreased about 60 g/cow/day as the % CP and % RDP decreased in the diet, however, the % milk protein also decreased. Their data suggest 11.7% RDP in ration DM as the best compromise between profitability and environmental quality.


Table 1. Effect of Percent Ruminal Degradable Protein on Dietary Components and Cow Responses
Dietary Treatments
A B C D
CP, % 18.8 18.3 17.7 17.2
RDP, % DM1 13.2 12.3 11.7 10.6
RDP, % of CP 70.2 67.2 66.1 61.6
RDP, % DM2 12.5 10.9 9.2 7.7
RUP, % DM1 5.8 6.2 6.0 6.6
RUP, % of CP 30.8 33.9 33.9 38.4
RUP, % DM2 6.3 7.4 8.5 9.5
NEL2, Mcal/lb DM 0.709 0.704 0.704 0.704
3.5% FCM, lb/d 93.1 94.2 93.3 91.3
Milk true protein, % 3.14a 3.14a 3.07b 3.04b
MUN, mg/dL 15.9a 15.6a 13.6b 12.8b
BUN, mg/dL 13.8a 14.0a 11.8b 12.4b
Ruminal NH3-N, mg/dL 12.33a 11.76a 8.68b 5.71c
Urinary N excretion, g/d 295a 293a 237b 239b
Fecal N excretion, g/d 222 220 219 197
N Efficiency
Milk N, % of N intake 29.6 29.5 30.4 30.4
lb of milk/lb of N excreted 84.5a 87.2a 94.3b 99.8b
1Measured in vivo.
2Predicted by NRC (2001) model.
abcMeans within the same row without a common superscript differ P < 0.05.


Case II.

Formulations using RUP/RDP and specific amino acids to reduce CP intake.
This concept applies RDP/RUP in predicting amino acid flows to the small intestinal tract, then adding specific amino acids to meet the cow’s requirements. The advantage is to reduce total N intake and hence, N excretion, while reducing total feed costs. Examples of using amino acid formulation to reduce CP and maintain milk yield are given below.

Example 1. VonKeyserlingk et al. (1999) formulated two diets for cows that were primarily in early lactation. The control diet was formulated according to the 1989 NRC recommendations. A second diet was formulated with the CNCPS system and included a commercial protein source and intestinally available MET source. Using a commercial protein source and “rumen by-pass” MET allowed the CP level in the grain mix to be reduced by 2.9% units and total TMR by 1% unit (Table 2).


Table 2. Diets formulated using NRC (1989) guidelines or CNCPS program.
Item NRC (1989) CNCPS
CP, % DM 18.7 17.7
ADF1, % DM 21.1 21.8
NEL, Mcal/lb 0.82 0.86
1Acid detergent fiber.

No difference was observed in DM intake or milk production between cows fed the diets formulated by the two methods (Table 3). The authors concluded that the CNCPS afforded the opportunity balance rations for reduced CP level without loss in milk production.


Table 3. Performance of dairy cows fed rations formulated by NRC (1989) guidelines or CNCPS formulation program.
Item NRC (1989) CNCPS
All cows
DMI, lb 47.4 46.6
Milk, lb 82.8 81.5
Multiparous Cows
Milk, lb 96.5 94.3
Milk fat, % 2.88 3.12
Milk protein, % 3.12 3.11
Primiparous Cows
Milk, lb 69.0 68.8
Milk fat, % 3.17 3.31
Milk protein, % 3.22 3.20

Example 2. Harrison et al. (2000) used the CPM (Cornell, Penn State, and Miner Institute) model to formulate two diets containing undegraded protein sources in the form of canola derivative or animal-marine blend. Each of these diets was estimated to be slightly deficient in LYS and MET. Two additional diets were formulated that were supplemented with a MET source and free LYS-HCl to improve the dietary supply of MET and LYS. The postpartum levels of MET and LYS in the non-supplemented diets were targeted to be at ~ 100% of the requirements (1.9% MET/MP and 6.4% LYS/MP) and 116% of MET (2.2% MET/MP) and 106% of LYS (6.6% LYS/MP) for supplemented diets. When formulating the diets, it was considered that 20 g of the commercial MET source provided 7 g of ruminal escape MET (Koenig et al.,1998) and 40 g of free LYS-HCl provided 8 g of ruminal escape LYS (Velle et al., 1998). Cows were fed the experimental diets from ~28 days before calving through week 17 postpartum. At 9 weeks post-partum, cows received rBST per label.

There tended to be increased yield of 3.5 FCM for cows fed the diet containing animal-marine bypass protein (Table 4). In early lactation, and at 14 to 17 weeks of lactation, there was an improvement in milk that appeared to be related to supplemental MET and LYS-HCl. In the early weeks of lactation (weeks 1 to 4) the MET supplemented cows fed the animal-marine blend protein source diet produced the most milk. After the beginning of rBST use (week 5), cows fed both un-supplemented diets (canola derivative and the animal-marine blend) produced more milk when supplemented with MET and LYS-HCl. A trend (P<0.14) was observed for increased milk fat percentage when the diets were supplemented with MET and LYS-HCl. These observations support the use of supplemental MET and LYS particularly during the critical need periods of early lactation and post rBST administration.


Table 4. Performance of cows fed diets containing supplemental sources of rumen undegraded amino acids.
P <
Item Treated canola protein Treated canola protein + Lys & Met Animal-marine blend protein Animal-marine blend protein + Lys & Met Pro-
tein
Suppl-
ement
Pro-
tein x Suppl
DMI, lb 48.2 48.0 48.8 47.7 NS NS NS
Milk, lb 85.4 85.6 87.1 87.3 NS NS NS
3.5 FCM, lb 86.9 87.6 89.3 91.1 0.08 NS NS
Milk fat, lb 3.08 3.12 3.19 3.28 0.03 NS NS
Milk fat, % 3.65 3.71 3.68 3.80 NS 0.14 NS
Milk protein, % 3.09 3.13 3.12 3.36 NS NS NS
Milk protein, lb 2.62 2.62 2.68 2.86 0.22 NS NS

Case III.

The importance of formulating for desired ratios of MET to LYS.
In another study (Harrison et al., 2003), researchers employed the CPM formulation model to reduce dietary CP from 18% to 16% by replacing alfalfa silage with corn silage and undegraded protein sources (Tables 5 & 6). Diet #3 was predicted to have the best ratio and supply of MET and LYS, and resulted in the highest milk yield, and ratio of milk true protein to diet protein (Table 7). The reduced milk yield of cows fed diet #2 emphasizes the need to ensure the ratio of LYS to MET is ~ 3.2 to 1. Total N import (as feed N) onto the dairy was reduced by nearly 9% and IOFC was increased 6.5% by diet #3.


Table 5. Chemical Analysis of Total Mixed Rations (% DM).
Item Diet 1 Diet 2 Diet 3 SE
CP 18.6 16.0 16.0 0.35
NDF1 38.9 41.2 44.7 1.88
Soluble CP 7.53 5.1 5.4 0.38
Soluble CP, % of CP 40.5 31.9 33.8
NFC2 31.9 34.4 30.7 2.16
1Neutral detergent fiber
2Nonfiber carbohydrate


Table 6. Diet Formulation Results from CPM
Item Diet 1 Diet 2 Diet 3
Lysine, % required 89 99 116
Methionine, % required 91 116 109
Ratio of Lys/Met 3.32 2.89 3.16
MP1 balance, g -477 -104 -117
1Metabolizable protein


Table 7. Response of cows to diets that differ in crude protein and ratio of lysine to methionine
Item Diet 1 Diet 2 Diet 3 SE P <
DMI, lb 44.9 45.1 45.1 2.97 NS
Milk, lb 78.8 77.9 82.5 5.10 NS
Milk Fat, % 3.80a 3.24b 3.79a 0.151 0.01
Milk Protein, % 3.08 3.08 3.07 0.071 NS
MUN, mg/dL 18.8a 13.0b 14.4b 0.92 0.01
CP Intake, lb/d 8.34 7.22 7.22
Milk True Protein/Feed CP 0.29 0.33 0.34
Reduction in CP imports, % 8.6 8.6
IOFC1, $/d/cow 5.49 4.64 5.85
1Income over feed costs


Case IV.

Impact of reduced dietary % CP on N excretion on a commercial dairy. A field study (Harrison et al., 2002) was conducted with a high producing herd to compare the general herd diet formulated at ~18% CP to a diet that was reformulated at ~17% (Table 8). Milk production was maintained while N imports to the farm (Tables 9 & 10) were decreased. In addition, the reformulated diet increased IOFC (Table 11). These results agree with those of Wattiaux and Karg (2004) who reported a 16% drop in urinary N when a diet with 18% CP was reformulated to 16.5% CP.


Table 8. Chemical compositions of a control diet and a reformulated diet containing supplemental amino acids.
Item Control Reformulated
CP, % DM 17.8 17.0
Soluble Protein, % DM 6.4 6.0
Soluble Protein, % CP 35.7 37.0
NDF<suo>1</sup>, % DM 32.4 32.7
NFC2, % DM 39.0 39.8
1Neutral detergent fiber
2Nonfiber carbohydrate


Table 9. Treatment response to a diet reformulated on the basis of metabolizable methionine and lysine.
Item Control Reformulated SE P <
DMI, lb 56.7 55.2
CP Intake, lb 10.1 9.4
Milk, lb 99.9 101.9 0.53 0.007
3.5 FCM, lb 96.0 96.6 0.46 0.32
Milk fat, % 3.28 3.21 0.014 0.001
Milk protein, % 2.90 2.93 0.006 0.0009
MUN, mg/dL 17.5 14.5
Milk True Protein: Intake Protein Ratio 0.285 0.316


Table 10. Effect on nitrogen excretion when a diet was reformulated on the basis of metabolizable lysine and methionine
Item Control Reformulated % Change
N intake, g/d 734 680 -7.4
Milk total N, g/d1 240 246 +2.5
Predicted Urinary N, g/d2 289 239 -17.3
Calculated Fecal N, g/d3 205 195 -5.0
1(Milk True Protein/6.38) X 1.17
2Urinary N (g/d) = 0.026 x BW (kg) X MUN (mg/dL); J Dairy Sci. 85:227-233.
3Fecal N = Intake N – Milk N – Urine N


Table 11. Economic impact of reformulating a diet on the basis of metabolizable lysine and methionine
Item Control Reformulated
Feed Costs, $/d/cow 4.82 4.88
Milk Income, $/d/cow 11.92 12.10
IOFC1, $/d/cow 7.10 7.22
1IOFC = Income over feed costs


Summary

Reducing CP intake of high-producing cows can be achieved by strategic use of undegraded protein sources and amino acids (LYS and MET) under a variety of diet conditions. Diet reformulations can reduce N excretions by ~10% without negatively affecting milk yield or IOFC. These successes require the use of ration balancing software that estimate the amino acid (MET and LYS especially) needs of the lactating cow. Use of undegraded protein sources that have dependable concentrations of amino acids is critical to achieve consistent production responses.


RUP Fig 1.jpg


Selected References

Burroughs, W., D.K. Nelson, and D.R. Mertens. 1975. Evaluation of protein nutrition by metabolizable protein and urea fermentation potential. J. Dairy Sci. 58:611-619.

Clark, J.H., T.H. Klusmeyer, and M.R. Cameron. 1992. Symposium: Nitrogen metabolism and amino acid nutrition in dairy cattle: Microbial protein synthesis and flows of nitrogen fractions to the duodenum of dairy cows. J. Dairy Sci. 75:2304-2323.

Harrison, J.H., D. Davidson, L. Johnson, M.L. Swift, M. VonKeyserlingk, M. Vazquez-Anon, and W. Chalupa. 2000. Effect of source of bypass protein and supplemental Alimet and lysine-HCl on lactation performance. J. Dairy Sci. 83(suppl 1):268.

Harrison, J.H., D. Davidson, J. Werkhoven, A. Werkhoven, S. Werkhoven, M. Vazquez-Anon, G. Winter, N. Barney, and W. Chalupa. 2002. Effectiveness of strategic ration balancing on efficiency of milk protein production and environmental impact. J. Dairy Sci. 85(suppl.1):205.

Harrison, J.H., R.L. Kincaid, W. Schager, L. Johnson, D. Davidson, L.D. Bunting, and W. Chalupa. 2003. Strategic ration balancing by supplementing lysine, methionine, and Prolak on efficiency of milk protein production and potential environmental impact. J. Dairy Sci. 86(Suppl 1):60.

Koenig, K.M., L.M. Rode, C.D. Knight, and P.R. McCullough. 1999. Ruminal escape, gastrointestinal absorption, and response of serum methionine to supplementation of liquid methionine hydroxyl analog in dairy cows. J. Dairy Sci. 82:355.

NRC. 1989. National Research Council. Nutrient Requirements of Dairy Cattle. Vol. 6th rev. ed. Natl. Acad. Sci., Washington, DC.

NRC. 2001. National Research Council. Nutrient Requirements of Dairy Cattle. Vol. 7th rev. ed. Natl. Acad. Sci., Washington, DC.

Reynal, S.M. and G.A. Broderick. 2005. Effect of dietary level of rumen-degraded protein on production and nitrogen metabolism in lactating dairy cows. J. Dairy Sci. 88:4045-4064.

Stokes, S.R., W.H. Hoover, T.K. Miller, and R. Blauweikel. 1991. Ruminal digestion and microbial utilization of diets varying in type of carbohydrate and protein. J. Dairy Sci. 74:871-881.

Tamminga, S. 1992. Nutrition management of dairy cows as a contribution to pollution control. J. Dairy Sci. 75:345-357.

Velle W., T.I. Kanui, A. Aulie, and O.C. Sjaastad. 1998. Ruminal escape and apparent degradation of amino acids administered intraruminally in mixtures to cows. J. Dairy Sci. 81:3231-3238.

VonKeyserlingk, M.A.G., M.L. Swift, and J.A. Shelford. 1999. Use of the Cornell Net Carbohydrate and Protein System and rumen-protected methionine to maintain milk production in cows receiving reduced protein diets. Can. J. Anim. Sci. 79:397-400.

Wattiaux, M. A. 1998. Protein metabolism in dairy cows. In: Technical Dairy Guide—Nutrition, 2nd edition. The Babcock Institute for International Dairy Research and Development. The University of Wisconsin.

Wattiaux, M.A and K.L. Karg. 2004. Protein level for alfalfa and corn silage-based diets: II. Nitrogen balance and manure characteristics. J. Dairy Sci. 87:3492-3502.

“Extension programs and policies are consistent with federal and state laws and regulations on nondiscrimination regarding race, sex, religion, age, color, creed, national or ethnic origin; physical, mental or sensory disability; marital status, sexual orientation, or status as a Vietnam-era or disabled veteran. Evidence of noncompliance may be reported through your local Extension office.”


Disclaimer

This fact sheet reflects the best available information on the topic as of the publication date. Date 6-20-2006

This Feed Management Education Project was funded by the USDA NRCS CIG program. Additional information can be found at Feed Management Publications.

Image:Feed mgt logo4.JPG

This project is affiliated with the Livestock and Poultry Environmental Learning Center.

Image:usda,nrcs,feed_mgt_logo.JPG

Project Information

Detailed information about training and certification in Feed Management can be obtained from Joe Harrison, Project Leader, jhharrison@wsu.edu, or Becca White, Project Manager, rawhite@wsu.edu.

Author Information

R. L. Kincaid rkincaid@wsu.edu
J. H. Harrison
R. A. White
Washington State University

Reviewer Information

Floyd Hoisington – Consulting Nutritionist

Michael Wattiaux – University of Wisconsin

Partners

Image:Logos2.JPG

An Introduction to Natural Resources Conservation Service (NRCS) Feed Management Practice Standard 592

Printer friendly version

Introduction

This factsheet has been developed to support the implementation of the Natural Resources Conservation Service (NRCS) Feed Management 592 Practice Standard. The Feed Management 592 Practice Standard was adopted by NRCS in 2003 as another tool to assist with addressing resource concerns on livestock and poultry operations. Feed management can assist with reducing the import of nutrients to the farm and reduce the excretion of nutrients in manure.

Please check this link first if you are interested in organic or specialty dairy production

Why Is Feed Management Important?

Feed represents the largest import of nutrients to the farm, followed by commercial fertilizer CAST Issue Paper # 21 – Animal Diet Modification to Decrease the Potential for Nitrogen and Phosphorus Pollution. Feed management practices impact the amount of nutrients that are imported to the farm and excreted in manure. The excreted nutrients are subsequently available for volatile loss (nitrogen) to the atmosphere and are potentially lost via surface runoff (nitrogen and phosphorus) or leached to groundwater (nitrogen and phosphorus).

Feed management opportunities currently exist to reduce imports of nutrients (particularly nitrogen and phosphorus) to most animal livestock and poultry operations. Because consulting nutritionists play such a key role with regard to importation of nutrients to the farm, a systematic approach to evaluate the role that feed management has on whole-farm nutrient management is warranted.

What Is the NRCS Standard 592?

The NRCS Feed Management Practice Standard is defined as “managing the quantity of available nutrients fed to livestock and poultry for their intended purpose.” The purposes of the 592 standard are:

  • To supply the quantity of available nutrients required by livestock and poultry for maintenance, production, performance, and reproduction, while reducing the quantity of nutrients, especially nitrogen and phosphorus, excreted in manure by minimizing the overfeeding of these and other nutrients
  • To improve net farm income by feeding nutrients more efficiently

The ultimate goal of utilizing the Feed Management Practice Standard 592 is to develop a farm-specific Feed Management Plan, or FMP. A five-step process has been adopted for the development and implementation of a FMP.

Implementing a FMP as outlined in NRCS Feed Management Practice Standard 592 can be expected to have the following environmental benefits:

  1. Reduce on-farm import of nutrients
  2. Reduce nutrients in manure for subsequent land application and potential loss to ground and surface water
  3. Reduce nutrients in manure and subsequent volatile losses
Feed mgmt flow.jpg


A complete copy of the national version of NRCS Feed Management 592 Practice Standard can be found at the end of this publication. Please check your state-specific version of the standard.


Ten Reasons to Implement a Systematic Approach to Feed Management

There are a number of reasons for consulting nutritionists and ARPAS members to consider the adoption of a systematic approach to feed management. Following are our Top 10:

  1. Society demands animal agriculture to be environmentally responsible.
  2. Many farms are in a positive import-export balance for nitrogen and phosphorus, even when losses of nitrogen are considered.
  3. Feed is the primary import of nutrients on most livestock and poultry farms.
  4. Adopting feed management practices is proactive toward becoming sustainable.
  5. Feed management is an additional practice that can assist in the mitigation of nutrient buildup.
  6. There is an ethical obligation for nutritionists to consider a systematic feed management program to reduce import of nutrients to the farm.
  7. Agriculture should get credit for practices already implemented. Adoption of NRCS feed management is an option, not mandated.
  8. Adopting Feed Management 592 can likely increase profitability.
  9. Adopting Feed Management 592 can result in incentive payments to the producer and consultant.
  10. Adopting Feed Management 592 provides a nutritionist the opportunity to increase his or her suite of services to producers.


Text of the 592 Standard

Natural Resources Conservation Service Conservation Practice Standard
Feed Management
(No. of Systems and AUs Affected)
CODE 592

Definition

Managing the quantity of available nutrients fed to livestock and poultry for their intended purpose.

Purpose

  • To supply the quantity of available nutrients required by livestock and poultry for maintenance, production, performance, and reproduction, while reducing the quantity of nutrients, especially nitrogen and phosphorus, excreted in manure by minimizing the over-feeding of these and other nutrients
  • To improve net farm income by feeding nutrients more efficiently

Conditions Where Practice Applies

  • Confined livestock and poultry operations with a whole-farm nutrient imbalance, with more nutrients imported to the farm than are exported and/or utilized by cropping programs
  • Confined livestock and poultry operations that have a significant buildup of nutrients in the soil due to land application of manure
  • Confined livestock and poultry operations that land apply manure and do not have a land base large enough to allow nutrients to be applied at rates recommended by soil test and utilized by crops in the rotation
  • Livestock and poultry operations seeking to enhance nutrient efficiencies

Criteria

General Criteria Applicable to All Purposes

The diets for specific species of animals shall be developed in accordance with recommendations from one of the following:

  • Standards outlined in the most current recommendations of the National Research Council (NRC).
  • Recommendations of the land-grant university.
  • Standards developed by the professional nutritionists of livestock and poultry production companies, feed companies, and/or feed suppliers. Laboratory analysis shall be done on the formulated diet or on the feed ingredients used to formulate the diet, to determine its nutrient content.
  • Feed analyses by laboratories whose tests are accepted by the land-grant university in the state in which the feeding strategy will be implemented. Data from analyzed feed ingredients and/or appropriate historic feed analysis. information for the operation will be used for adjustments of ration formulation.
  • Diets and feed management strategies developed by professional animal scientists, independent professional nutritionists, or other comparably qualified individuals. When required by state policy or regulation, animal nutritionists shall be certified through any certification program recognized within the state.
  • Diets shall be formulated to provide the quantities and correct relative ratios of available nutrients required by the animal species to meet species goals for which the plan is being developed.
  • Adjustments to nutrient levels shall be provided to meet specific genetic potential, environmental demands, and/or requirements to insure health, well-being and productivity.

One or more of the following feed management practices and/or diet manipulation technologies shall be used to reduce nitrogen, phosphorus, and other excreted nutrients while maintaining the health, well-being and productivity of the animal:

  • Formulating diets closer to animal requirements
  • Reducing protein and supplementing with amino acids (nonruminants)
  • Manipulating the crude protein and energy (carbohydrate and fat) content of the diet to enhance the availability of amino acids (ruminants)
  • Using highly digestible feeds, as appropriate, in the diet
  • Using phytase and reducing the supplemental phosphorus content of the diet (nonruminants)
  • Reducing the phosphorus content of the diet of ruminants when it is being overfed
  • Using selected enzymes or other products to enhance feed digestibility or feed use efficiency
  • Using growth promotants as allowed by law
  • Implementing phase feeding
  • Implementing split-sex feeding
  • Using other feed management or diet manipulation technologies that have demonstrated the ability to reduce manure nutrient content

When analysis of manure is done to determine manure nutrient content, the analysis shall be performed by laboratories whose results are accepted by the land-grant university in the state in which the feeding strategy was implemented.

Considerations

Consider nutrient requirements for production based upon stage of growth, intended purpose of the animal, and the type of production (e.g., meat, milk, eggs) involved.

  • Use management practices described in the NRCS Nutrient Management (Feed Management) Technical Notes for the specific animal species.
  • Analyze the drinking water consumed by the animals to determine its nutrient content, and adjusting the diet to account for this source of nutrients.
  • Different feed ingredients (e.g. by- products) and their potential impacts on the nutrient content of excreted manure.
  • The potential impact of feed management on the volume of manure excreted and on manure storage requirements.
  • The impact of feed management practices, animal management practices, and diet manipulation on manure odors, pathogens, animal health and well-being.
  • Using concentrates and forages grown on the farm to minimize the quantity of nutrients imported to the farm, and to maximize the recycling of nutrients on the farm.
  • Analyzing excreted manure or manure from storage facilities to determine manure nutrient content and to estimate the impact of the feeding strategy.

Plans and Specifications

Plans and specifications for feed management shall be in keeping with the requirements of this standard. They shall describe the specific feed management practices and/or technologies that are planned for the operation. The following components shall be included in the feed management plan:

  • The type of technology, or technologies, and/or feeding practices that will be used on the operation
  • Feed analyses and ration formulation information prior to and after implementation of feed management on the operation
  • The estimated, or measured, nutrient content of the manure prior to the implementation of feed management on the operation
  • The estimated impact that feed management will have on manure nutrient content
  • Guidance for how often the feed management plan shall be reviewed and potentially revised
  • The quantities and sources of nitrogen and phosphorus that will be fed
  • Identification of the qualified feed management specialist who developed the plan.

Operation and Maintenance

The producer/client is responsible for the operation and maintenance of the feed management plan. Operation and maintenance activities address the following:

  • Periodic plan review to determine if adjustments or modifications are needed
  • Routine feed analysis to document the rates at which nitrogen and phosphorus were actually fed; when actual rates fed differ from or exceed the planned rates, records will indicate the reasons for the differences.
  • Maintaining records to document plan implementation. As applicable, records include:
    • Records of feed analysis and ration formulation, including the record of ration formulation used prior to implementing the feeding strategy
    • Records of the initial estimate of the impact the feeding strategy was expected to have on reducing manure nutrient content
    • Records of any manure analysis that was done after the feeding strategy was implemented to determine manure nutrient content
    • Dates of review and person performing the review and any recommendations that resulted from the review.

Records of plan implementation shall be maintained for five year, or for a period longer than five years if required by other federal, state, or local ordinances, program, or contract requirements.


Disclaimer

This factsheet reflects the best available information on the topic as of the publication date. Date 4-12-2007

This Feed Management Education Project was funded by the USDA NRCS CIG program. Additional information can be found at Feed Management Publications. Image:Feed mgt logo4.JPG

This project is affiliated with the Livestock and Poultry Environmental Learning Center.

Image:usda,nrcs,feed_mgt_logo.JPG

Project Information

Detailed information about training and certification in feed management can be obtained from Joe Harrison, project leader, jhharrison@wsu.edu, or Becca White, project manager, rawhite@wsu.edu.

Author Information

J. H. Harrison, Washington State University, jhharrison@wsu.edu
R. A. White, Washington State University
A. Sutton and Todd Applegate, Purdue University
Galen Erickson, University of Nebraska
R. Burns, Iowa State University

Partners

Logos2.JPG


Acknowledgements

This Feed Management Education Project was funded by the USDA NRCS CIG program. Additional information can be found at Feed Management Publications.
This project is affiliated with the Livestock and Poultry Environmental Learning Center

usda,nrcs,feed_mgt_logo.JPG


“Extension programs and policies are consistent with federal and state laws and regulations on nondiscrimination regarding race, sex, religion, age, color, creed, national or ethnic origin; physical, mental or sensory disability; marital status, sexual orientation, or status as a Vietnam-era or disabled veteran. Evidence of noncompliance may be reported through your local Extension office.”