This paper presents a description of the ABFX (Ammonium Bicarbonate Fiber Explosion) pretreatment process. The ABFX process is an extremely simple and inexpensive process that possesses the attributes of the Ammonia Fiber Explosion Process (AFEX) and CO2 explosion process while eliminating the cost associated with high temperature, high pressure and ammonia recovery. The process uses ammonia bicarbonate (ABC) recovered from anaerobic digestate to pretreat the substrate. The ABC is simply added to the substrate, pumped to a reactor, heated to temperatures less than 100°C, for a short duration. The pressure created by ABC volatilization is then released and the gases (CO2, NH3, H2O) condensed at ambient temperature to produce ABC that is then reused in the process. The process can operate with low temperature waste heat.
This paper presents a description of the process and the results of a National Science Foundation Small Business Innovative Research investigation that compared the methane gas yields from both pretreated and untreated grass silage and pretreated and untreated screened (screw press) dairy manure solids. The ABFX pretreated manure solids produced 38% more methane gas than the untreated while the ABFX pretreated grass silage produced 14% more methane gas than the untreated. The economic benefits of the process will be discussed.
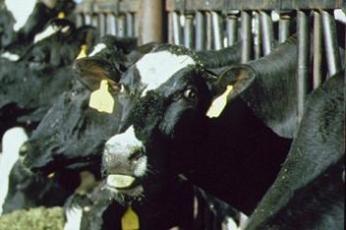
Is There Potential to Improve Methane Yields from Manure?
A large fraction of municipal solid waste (MSW), crop residues, animal manures, forest residues, or dedicated energy crops are composed of lignocellulouse. Lignocellulosic substrates consist of a tightly woven matrix of cellulose, hemicellulose, and lignin polymers. Biological degradation of these polymers are carried out by a variety of enzymes. Pretreatment can enhance the bioconversion of the wastes or cop residues for ethanol or biogas production by increasing the accessibility of the enzymes to the substrate. Thus, pretreatment can increase the energy yield (biogas or ethanol) while decreasing the residual waste to be disposed.
Anaerobic bacteria easily convert the hemicellulose and amorphous cellulose to gas. However, conversion of the crystalline cellulose and lignin is far more difficult. Lignin is not converted to gas by anaerobic organisms. Only a fraction of the crystalline cellulose is converted to gas within the detention times commonly used (20 days) in anaerobic digestion. Pretreatment is required to rupture the crystalline cellulose for enzymatic hydrolysis. A wide variety of pretreatment technologies have been developed. Dilute acid pretreatment solubilizes the hemicellulose. Alkali, lime or sodium hydroxide pretreatment solubilize the lignin thus exposing the hemicellulose and cellulose for enzymatic attack. A variety of explosion processes such as steam, carbon dioxide, and liquid ammonia (AFEX) have also been developed that disrupt the crystalline cellulose and hemicellulose. Ammonia soaking, over prolonged periods of time, has also been used to pretreat straw for animal feed and thereby improve rumen digestibility and animal weight gain. All of the processes use high pressure and temperature, or toxic chemicals. The commonly used, conventional processes are not suitable for on-farm use.
What Did We Do?
Figure 1: ABFX Process
We substantiated the feasibility of a breakthrough pretreatment technology under a National Science Foundation Small Business Innovative Research (SBIR) grant that used the non-toxic Ammonium Bicarbonate (ABC) recovered from the anaerobic digestate. The pretreatment was accomplished with a simple device, shown in Figure 4, composed of a pump, that pumps the solid biomass substrate, mixed with a small amount of ABC, into a reactor. The reactor is closed and heated to temperatures below the boiling point of water. Once heated the ABC breaks down to its water, ammonia, and carbon dioxide components putting the contents under significant pressure. The pressure is then rapidly released causing the explosion or disruption of the lignocellulosic substrate and the breakdown of the crystalline cellulose. The gases (H2O, NH3, and CO2), are then condensed in a separate chamber to produce ABC that is reused in the next cycle. Nothing is wasted. The ABC is recovered and reused. The applied heat and detention time provided is sufficient to pasteurize the biomass and meet the temperature requirements of the downstream anaerobic reactor. It is a simple process composed of a solids pump, heat pump, and two low detention time (10± minutes) reactors.
The SBIR research consisted of pretreating both grass silage and concentrated, screw press, manure solids and digesting both pretreated and untreated silage and manure solids. The pretreated and untreated solids were digested in 10 reactors at a 12.5 day HRT and 35°C.
What Have We Learned?
Pretreatment of the grass silage increased the methane yield 16% over several months of operation. Pretreatment increased the methane yield from the pretreated manure solids by 35% over the same period. The increased gas yield was approximately equal to the methane yield from the crystalline cellulose present in the substrate that is normally not converted to gas. The research demonstrated the feasibility of pretreating lignocellulosic substrates in a simple, short detention time, low temperature process that does not dilute the substrate stream or use toxic chemicals such as liquid or gaseous ammonia, acids, or caustic.
Future Plans
The current plan is to build a prototype facility to pretreat a variety of crop residuals (corn stover, rice straw, wheat straw), dry feedlot manure and poultry litter.
The authors are solely responsible for the content of these proceedings. The technical information does not necessarily reflect the official position of the sponsoring agencies or institutions represented by planning committee members, and inclusion and distribution herein does not constitute an endorsement of views expressed by the same. Printed materials included herein are not refereed publications. Citations should appear as follows. EXAMPLE: Authors. 2013. Title of presentation. Waste to Worth: Spreading Science and Solutions. Denver, CO. April 1-5, 2013. URL of this page. Accessed on: today’s date.
An economical process to capture residual ammonia nitrogen and reduce the production of new ammonia via the Haber process is needed. The CO2, N2O and NOx emissions from nitrification and denitrification of industrially created ammonia will be reduced as a result. The ammonia product should be sold at a profit, but less than $1,700 / ton N.
This paper describes the ABC process and presents the ammonia recovery and biomethane production results of a pilot investigation of the ABC process for the recovery of ammonia nitrogen. The work was supported by the US Department of Agriculture (USDA) under a Small Business Innovative Research project. The ABC process uses no chemicals and very little energy. The process recovers the ammonia as crystalline ammonium bicarbonate (ABC). In the process of producing the ABC, carbon dioxide is removed from the biogas to produce “biomethane”, a transportation quality fuel at little or no cost.
Figure 1 Pilot RPB without Cover.
Is It Possible to Recover Ammonia Economically?
The discharge of ammonia nitrogen is a well recognized adverse consequence of anaerobic waste treatment. As a result, further treatment to remove ammonia is required. A wide variety of processes have been developed to address the “ammonia issue”. The commonly used processes are the many variations of nitrification / denitrification and Anammox processes. The Anammox (anaerobic ammonium oxidation) process is the least expensive and produces significantly less GHG (N2O). The nitrification / denitrification and Anammox processes directly convert ammonia to nitrogen gas (N2) resulting in the loss of the ammonia resource at a treatment cost of approximately $1,600 / ton N for a large facility. The ammonia that is destroyed must be replenished through the Haber-Bosch process that requires 32 GJ of energy per ton of ammonia to produce and similar energy consumption to transport. The production and transport have a cost of $1,200 / ton N while producing substantial GHG emissions. The minimum total cost of destroying and replacing ammonia is greater than $2,800 / ton N. An economical process to capture residual ammonia nitrogen for reuse, while reducing the production of new ammonia via the Haber process, is needed. The CO2, N2O, and NOx emissions from nitrification and denitrification of industrially created ammonia will be reduced as a result.
A number of processes have been developed over the past 50 years to remove and recover ammonia as an ammonium sulfate or nitrate fertilizer. Several facilities were constructed in the EU in the 1970’s. Those facilities were however uneconomical because of the high cost of chemicals (acid, lime, sodium hydroxide) and sludge disposal. Modification of those processes that use ion exchange, as opposed to ammonia stripping, remain uneconomical since they also require caustic, salt, and sulphuric acid to remove ammonia and recover ammonium sulphate. An economical process that can recover ammonia as a solid product without the use of hazardous chemicals is required.
Figure 2 Ammonium Bicarbonate (ABC)
What Did We Do?
E3 developed the Ammonium Bicarbonate Recovery (ABCR) process that recovers the ammonia as a crystalline solid pathogen free, inorganic fertilizer without the use of any chemicals. In the process of producing the Ammonium Bicarbonate (ABC), carbon dioxide is removed from the biogas to produce “biomethane”, a transportation quality fuel at little or no cost. The products of the process are biomethane quality transportation fuel and solid ammonium bicarbonate fertilizer that can be used for the pretreatment of lignocellulosic substrates.
To overcome the ammonia reclamation process deficiencies, E3 developed the Rotating Photo Bioreactor (RPB) shown in Figure 1. The RPB is a horizontal ammonia stripping reactor that removes the ammonia without the use of any chemicals. An operating demonstration can be seen here
The stripped ammonia and water vapor are condensed to form a concentrated aqua ammonia solution. Turbid, ammonia laden, anaerobic digestate flows through a fixed film photo bioreactor, that uses natural and/or artificial light, to culture cyanobacteria that consume the bicarbonate in the digestate thus raising the pH to values exceeding 10. At the higher pH, the ionized ammonia (NH4+) is shifted to the gas form, NH3 that can be stripped by the low pressure gas flowing from the condensation unit over the upper portion of the rotating disks. Very little blower pressure is required. The impact of digestate turbidity is minimized by the thin liquid film flowing over the partially submerged rotating disks supporting the bicarbonate consuming cyanobacteria that require light. The ammonia laden gas is then returned to the condenser where the ammonia gas and water are condensed to recover concentrated aqua ammonia. The system operates at low liquid and gas pressures through the use of a heat pump and low pressure gas blower.
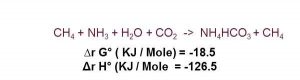
The aqua ammonia condensate is recovered when the effluent is being discharged from the digester. The condensate is stored in a tank for use throughout the day to clean the biogas by removing the carbon dioxide and hydrogen sulfide in the digester’s gas. The ammonia condensate is sprayed into the biogas stream where the ammonia and water react with the carbon dioxide to produce a solid ammonium bicarbonate precipitate that is removed, bagged, and stored as a renewable, low carbon footprint fertilizer to be applied to the fields when needed for crop growth or blended with the solid residuals to produce a balanced fertilizer.
What Have We Learned?
The pilot investigation substantiated that high BTU (990±) biomethane could be produced from biogas while recovering 85%± of the ammonia present in the digestate at less capital and O&M cost of producing electricity.
Future Plans
The current plan is to build a full scale operating facility treating high nitrogen content manure such as poultry manure.
The authors are solely responsible for the content of these proceedings. The technical information does not necessarily reflect the official position of the sponsoring agencies or institutions represented by planning committee members, and inclusion and distribution herein does not constitute an endorsement of views expressed by the same. Printed materials included herein are not refereed publications. Citations should appear as follows. EXAMPLE: Authors. 2013. Title of presentation. Waste to Worth: Spreading Science and Solutions. Denver, CO. April 1-5, 2013. URL of this page. Accessed on: today’s date.
Dr. Charles Maxwell, Dr. Jennie Popp, and Dr. Richard Ulrich – University of Arkansas; Dr. Scott Radcliffe – Purdue University, and Dr. Mark Hanigan – Virginia Tech
Why study crude protein and carbon footprint?
Maximizing feed grade amino acid (FGAA) use and reducing dietary crude protein in swine diets has been shown to dramatically reduce nitrogen excretion in both nursery and growing/finishing swine which could substantially reduce nitrous oxide (N2O) emissions associated with manure management in swine production. The global warming potential of N2O is about 298 times that of CO2 (carbon dioxide). Reducing the crude protein (CP) content of grower and finisher diets has also been repeatedly shown to enhance carcass quality by elevating intramuscular fat. While some crystalline amino acids are already commonly used in pork production the maximum level of CP reduction, in conjunction with the optimum amino acid inclusion rate, has not been sufficiently determined for widespread acceptance by the swine industry.
Project Objectives:
Hypothesis: Reducing dietary CP while maintaining amino acids (AA) at equivalent Standardized Ileal Digestibility (SID) ratios by supplementing feed grade AA will reduce nitrogen (N) excretion and greenhouse gas (GHG) emissions (N2O from manure) without impacting swine performance or carcass yield.
Determine the practical limits of reducing CP in diets of nursery and finishing pigs.
Validate the effectiveness of reduced dietary nitrogen as a mitigation strategy for greenhouse gases.
Provide data for validation of animal physiology model capable of predicting swine performance and relevant manure characteristics (quantity and composition for Manure DNDC).
Compare ME vs. NE formulation strategies on lean tissue deposition and fat accretion.
Determine the impact of dietary amino acid levels on signaling in regulation of tissue growth.
[2014 & 2015 annual reports indicated another objective was added] Estimate manure reductions in N excretion via a N balance trial.
Studies were conducted at multiple sites. One was the University of Arkansas wean-to-finish facilities and the second at the Purdue Swine Environmental Research Building (SERB). See the videos above for more on these facilities). The data generated was utilized in modelling work at Virginia Tech. The model was ultimately incorporated into the Swine Environmental Footprint Calculator.
Nursery Studies
What Did We Do? (Methods or Experimental Design)
Experiment 1
To evaluate maximum replacement of CP with FGAA, 320 weaned pigs were allotted to gender-balanced pens in a wean-to-finish facility (8 pigs/pen). Within blocks, pens were randomly assigned to 1 of 5 dietary treatments. Diets were formulated to maintain constant ME and SID Lys across treatments with SID Lys set at 95% requirement (PIC Nutrient Specification Manual, 2011). Diets were formulated to meet the SID AA ratio recommendations for other indispensable AA (SID) for nursery pigs through the 6th limiting AA (PIC Nutrient Specifications Manual, 2011). For each phase, Ctrl diets were devoid of FGAA, whereas Lys HCl was added in equal increments at the expense of CP (SBM, fish meal [FM], and poultry meal [PM] in phase 1, FM and PM in phase 2, and SBM in phase 3). This formulation procedure resulted in diets that were below the His and Phe/Tyr SID requirement for the highest level of CP reduction. CP and Lys inclusion levels were analyzed. Experiment 2
A second three phase nursery study was conducted with pigs weaned at 21 d to further evaluate limits of CP reduction in nursery diets and compare performance in pigs fed diets based on formulation on an ME vs. NE basis. The study involved 7 pigs/pen and 7 replicates/treatment. Dietary ingredients were similar to those used in experiment 1, except soy protein concentrate was used to replace fish meal. Dietary treatments were: 1), Control diet formulated on an ME basis and with FGAA used to meet the “Trp Set Point” without adding feed grade Trp in phase 1 and 2 and 0.02 % added Trp in phase 3; 2) Diet formulated on an ME basis and to meet the “His Set Point” without added feed grade His; 3) As 2 with diets formulated on a NE basis.
Nursery What Did We Learn (Results)?
Experiment 1
Pigs fed RCP 1, RCP 2, and RCP 3 diets in phase 1, 2 and 3, and for the overall study had similar ADG and BW but growth performance declined for pigs fed RCP 4 diets (Table 5; Quadratic effect, P < 0.01). A similar response was observed in ADFI in all time periods except phase 1 where ADFI was similar among treatments. In phase 1, G:F ratio followed a similar response (Quadratic effect, P < 0.01), but decreased linearly in phase 2 (P < 0.08), 3, and overall (P < 0.01). It should be noted that the RCP 4 diet was below requirement for SID His:Lys and Phe/Tyr:Lys which might explain the decrease in performance. The results of this study establishes that a high inclusion of feed grade Lys at the expense of intact proteins can be fed without decreasing ADG and ADFI except at the highest level of FGAA where the requirement for all IDAA was not met. However, G:F was generally reduced at the higher inclusion rates of FGAA, particularly in phase 3. Experiment 2
No differences were observed in ADG, ADFI, or G:F (Table 6) in any phase or overall in pigs fed diets formulated on an aggressive FGAA inclusion (His Set Point) based on ME (Trt.2) or NE (Trt. 3) compared to pigs fed AA inclusion levels currently used in swine industry (Trt. 1). These results indicate that in nursery pigs, one should be able to use a His Set Point in formulating AA based diets without concern for pig performance.
The previous nursery experiment (Experiment 1; Bass et al., 2013) conducted to evaluate feeding reduced CP diet with the highest levels of FGAA to nursery pigs resulted in poor growth performance, especially G:F ratio in phase 3 and the overall nursery period. In the previous study, experimental diets were formulated to meet the 95% of SID Lys requirement for nursery pigs. Also, RCP 4, which was formulated with the highest level of FGAA, did not meet the His and Phe requirement Lys/NE.
Conclusion
In conclusion, unlike the previous study, growth performance of nursery pigs was not affected by the higher level of FGAA and lower dietary CP. This may be due to different SID His:Lys and SID Phe+Tyr:Lys ratios used in diet formulation or different protein source used in each study. In the second nursery study, all diets were formulated based on 100 % or excess of SID Lys requirement for nursery pigs, and were formulated to meet the His and Phe+Tyr requirement. In addition, soy protein concentrate (SPC) was used in the second study during phase 1 and 2, replacing menhaden fish meal used in nursery study one.
Publications
2013 Midwest American Society of Animal Science (ASAS) meeting (Experiment 1) Abstract P042, page 102
Grow-Finish Studies
What Did We Do? (Methods)
Each experiment was conducted following a five phase grow-finish protocol. Pigs were fed 1 of 4 or 5 diets and 10 ppm of Paylean was fed during the final 3-week finishing phase-Phase 5. During phase 1 through 5, individual pig BW, and pen feed disappearance were measured over each phase to allow calculation of ADG, ADFI and G:F by phase. Tenth rib, ¾ midline back fat measurements and loin muscle area were estimated at study initiation and at the end of each phase via ultrasound to allow estimation of carcass lean gain. When the average of all blocks was 129-134 kg all pigs were individually weighed, tattooed, transported to, and harvested at a commercial pork packing plant according to industry accepted procedures. Longissimus muscle (LM) and fat depths at the 10th rib were measured on-line with a Fat-O-Meater probe and individual hot carcass weight was recorded. Experiment 1
A total of 420 pigs were blocked within gender and randomly allotted to pens with 6 pigs/pen. Within blocks, pens of pigs were randomly assigned to 1 of 5 dietary treatments (7 reps/treatment/gender). Diets were formulated by incrementally increasing levels of Lys with corresponding reductions in CP. Pigs were randomly allotted to the following diets:
Ctrl: Corn-SBM-DDGS diets devoid of FGAA,
RCP 1 (reduced crude protein 1)
RCP 2
RCP3
RCP 4 – was balanced on the requirement of the 7th limiting AA, His (PIC Nutrient Specifications Manual, 2011) which was considered the practical limit of the highest level of RCP because of availability constraints.
RCP 1 to 4 were then formulated to have stepwise and equally spaced increased Lys with corresponding reductions in CP between RCP 1 and 4. Diets 2-4 were supplemented with FGAA as needed to meet AA needs based on AA minimum ratios. Dietary CP and Lys inclusion levels were analyzed.
Diets were formulated to 95% of the average SID Lys requirement for barrows and gilts (PIC Nutrient Specifications Manual, 2011), and exceeded the SID AA/Lys ratio recommendations for other IDAA by 2 percentage points.
Distillers dried grains with solubles (DDGS) were included in all diets at the 20% level, with the exception of phase-5 finishing diets which was devoid of DDGS. Experiment 2
In experiment 1, diets were formulated on an ME basis and as soybean meal was reduced in diets, the calculated Lys/NE decreased which may explain some of the increase in fat deposition in pigs fed ME based diets formulated by decreasing soybean meal and including high levels of FGAA. Therefore, experiment 2 was conducted to establish the efficacy of using a “Set Point SID requirement” of sequentially reducing CP by adding FGAA to meet the SID IDAA/Lys ratio as a means of establishing the practical limits of CP reduction and AA replacement without impacting growth performance, carcass composition or quality in growing and finishing pigs fed NE based RCP diets. Diets were formulated starting with a Ctrl diet that approximates acceptable inclusion levels of FGAA currently used in industry, followed by sequentially formulating three additional dietary treatments, each based on the next limiting AA. Diets in this study were formulated on a constant NE basis within phase. DDGS was included in all diets. The SID His requirement in the highest RCP diet was met in each phase without added feed grade His.
There were a total of 9 replicates/treatment with pigs housed 6 pigs/pen. Sex within pen was balanced. Diets were formulated as in experiment 1 which were:
Treatment 1, Ctrl: Conventional phase 1 through 5 diets that approximates acceptable levels of FGAA currently used in industry. The assumption is that most in the industry are comfortable utilizing feed grade Thr and Met to meet the suggested SID Thr/Lys and Met/Lys ratio in diets formulated to meet the SID Trp/Lys requirement without added feed grade Trp. This is referred to as the Trp Set Point.
Treatment 2, RCP 1: Diets were formulated to meet the next limiting AA. In phase 1 and 5, the next limiting AA was Val while Ile was next limiting in phases 2, 3 and 4. This is referred to as the “Val or Ile Set Point”. Note that neither feed grade Val nor Ile were added in any phase.
Treatment 3, RCP 2: Diets were formulated to meet the next limiting AA. In phase 1 and 5, the next limiting AA was Ile while Val was next limiting in phases 2, 3 and 4. This is referred to as the “Val and Ile Set Point”. Note that feed grade Val but not Ile was added in phases 1 and 5, and Ile but not Val was added in phase 2, 3, and 4.
Treatment 4, RCP 3: Diets were formulated to meet the next (7th) limiting AA, His. This is referred to as the “His Set Point”.
All diets were supplemented with FGAA to meet IDAA recommended levels. Note that feed grade His was not added to any diet.
Grow-Finish Studies – What Did We Learn?
Experiment 1
Body weights of pigs decreased linearly with decreasing dietary CP during phase 1, 2, and 3 (P < 0.01; Table 7). Additionally, BW increased and then decreased quadratically during phase 3 (P = 0.09), 4 (P < 0.04), and 5 (P < 0.01) with BW decreasing significantly in pigs fed RCP 4. When Paylean was included in the Phase 5 diets, barrows fed the Ctrl diet had greater ADG than Ctrl-fed gilts, but RCP 1-, RCP 2-, and RCP 3-fed gilts had greater ADG than their castrated male counterparts (Quadratic gender × reduced CP diet, P = 0.08; Figure 1A) Both ADG and G:F decreased linearly (P ≤ 0.06) during phase 1 and 2. Furthermore, gain efficiency increased 4.6 % in gilts between Ctrl and RCP 2 before decreasing to similar G:F values between Ctrl and RCP 4; however, G:F remained relatively unchanged in barrows across the 5 dietary treatments (Quadratic gender × reduced CP diet, P = 0.04; Figure 1B).
Across the entire feeding trial, ADG increased only 2 % between Ctrl and RCP3, but dropped 6 % between RCP3 and RCP4 (Quadratic, P < 0.01). On the other hand, ADFI tended to decreased linearly (P = 0.09) as CP was reduced in swine diets. Gain efficiency increased 4.6 % in gilts between Ctrl and RCP2 before decreasing to similar values between Ctrl and RCP4; however, G:F remained relatively unchanged in barrows across the 5 dietary treatments (Quadratic gender × reduced CP diet, P = 0.04; Figure 1C).
Reducing dietary CP and optimizing the use of FGAA had limited (P ≥ 0.21) effects on HCW, dressing percentage, or LM depth; however, 10th rib fat depth increased linearly (P < 0.01), and fat free lean percentage at study termination decreased linearly as CP was reduced in swine diets (P < 0.02; Figure 1D). Experiment 2
Effects of dietary treatment (Trt.) indicated that ADG decreased linearly with increasing dietary FGAA in phase 3 (Table 8, P < 0.05), 4 (P < 0.10), 5 (P < 0.01) and overall (P < 0.01). Similarly, ADFI decreased linearly in phase 4 (P < 0.05), 5 (P < 0.01) and overall (P < 0.01) with increasing FGAA. Compared to pigs fed the control diet (Trt. 1), G:F in phase 1 increased in pigs fed increasing levels of FGAA at the lower inclusion rates (Trt. 2 and 3) before decreasing to the control level at the highest level of inclusion (Trt. 4, Quadratic effect, P < 0.05). During phase 3, a small, but significant, decrease in G:F was observed with increasing levels of FGAA (Linear effect, P < 0.05). For the overall study, however, a trend for increased G:F was observed (Linear effect, P < 0.06). BW increased at the end of phase 2 with increasing level of FGAA (Quadratic effect, P < 0.06). However, consistent with ADG, BW decreased with increasing dietary FGAA at the end of phase 3, 4 and 5 (Linear effect, P < 0.05, P < 0.01 and P < 0.01, respectively).
As might be expected based on BW, HCW decreased with increasing inclusion of dietary FGAA (Linear effect, P < 0.01). Tenth rib backfat was lower in pigs fed diets formulated to the Val or Ile Set Point (Trt. 2) or the His Set Point (Trt. 4) when compared to those fed diets formulated to the Val and Ile Set Point (Trt. 3).
Publications – G/F (Trial 1)
2013 Midwest American Society of Animal Science (ASAS) meeting Abstract 0224, page 73 (performance and carcass composition)
2013 Midwest American Society of Animal Science (ASAS) meeting Abstract P027, page 97 (LM – longissimus muscle quality)
Significance. This information is timely since the cost of soybean meal is approaching record levels which make substitution of synthetic amino acids for intact protein more economically feasible.
Nitrogen (N) Balance Study
What Did We Do? (Methods)
Thirty-two barrows were used to evaluate the effect of feeding reduced CP, AA supplemented diets, on nutrient and VFA excretion. Pigs were randomly allotted to the following diets:
Control: Corn-SBM-DDGS diets with no FGAA,
1X reduction in CP,
2X reduction in CP, and
3X reduction in CP. This diet was balanced on the 7th limiting AA in each phase.
Diets 2 and 3 were formulated to have stepwise and equally spaced reductions in CP between diets 1 and 4. Diets 2-4 were supplemented with FGAA as needed to meet AA needs based on NRC 2012 AA minimum ratios. Four nursery phases and 5 grow-finish phases (21d phases) were fed. Pigs were housed in stainless-steel metabolism pens equipped with a nipple waterer and stainless steel feeder. Collections started with nursery phase 3 and during nursery phases pigs were allowed an eight day adjustment period to the diets followed by a 3 d total collection of feces, urine, and orts. During the grow-finish phases, pigs were acclimated to diets for the first 10 d of each phase, and then feces, urine, and orts were collected for 3 days.
Nitrogen Balance – What Did We Learn? (Results)
Overall, from d 14-147 post-weaning ADFI was linearly increased as dietary CP was reduced, but no effect of dietary CP concentration on ADG or G:F (Table 9) was observed. Fecal excretion (DM) tended to respond in a quadratic (P = 0.08) fashion with decreasing fecal excretion (DM) up to 2X reduction in CP, but then increasing in 3X fed pigs. Both DE and ME (kcal/kg) were linearly (P < 0.01) reduced as dietary CP was reduced. The linear (P < 0.01) decrease in N intake for pigs fed reduced CP diets was accompanied by linear (P < 0.01) decreases in both urinary and total N excreted. Nitrogen digestibility (%) linearly decreased (P < 0.01) and N retention linearly (%) increased (P < 0.01) with reductions in dietary CP. Overall, there was a linear (P < 0.03) reduction in fecal ammonium as dietary CP was reduced. Total carbon (C) intake and total fecal C excreted tended (P = 0.06) to respond quadratically with an increase in both C intake and C excretion up to the 1X reduced CP diets, followed by a decrease in C intake and increasing C excretion to the 3X diet creating a linear (P < 0.05) decrease in C digestibility as dietary CP was reduced.
Significance. The ability to add total fecal and urine collections of the nitrogen manipulation diets across all body weights tested at the University of Arkansas before the diets were tested for greenhouse gas emissions at Purdue University improved the estimation of compounds excreted in fresh manure and then the conversion of these excreted nutrients and compounds during storage in typical deep pit manure structures under the swine facilities (as were measured during the Purdue 12 room study). This research project provided data for a critical link between excretion, storage, and land application.
Validating the Nursery, Grow-Finish, and GHG Measurement Studies
Large-scale trials are in progress to validate the nursery and grow-finish trials done at Arkansas. The Purdue facility is scaled more similarly to a commercial production system. Gas measurement and monitoring, and separate manure handling systems for each room allowed direct measurements with which to compare previous estimations.
Treatment structure for the experiment was:
Conventional diet containing ~ 0.15% Lys-HCl
1X reduction in CP with additional synthetic amino acids
2X reduction in CP with additional synthetic amino acids
All diets were supplemented with Ractopamine during the final 3-4 weeks of the trial, and amino acid concentrations were increased based on estimated increases in lean tissue accretion. However, the overall treatment structure will remain the same. The Experiment involved 24 pens of 10 pigs each per treatment, with 8 manure pits/trt, and 4 rooms per trt. Pen was the experimental unit for all growth performance, feed intake, and carcass data. Pit was the experimental unit for manure excretion data and room is the experimental unit for emission data.
Real-time monitoring of air temperatures included relative humidity, carbon dioxide (CO2), methane (CH4), nitrous oxide (N2O), ammonia (NH3), and hydrogen sulfide (H2S). Total suspended particulates were monitored using gravimetric samplers. The emission and animal performance data were significantly more accurate in this replicated, environmentally-controlled building than is possible commercially, yet still simulate commercial conditions.
Manure from each pit was completely removed to outside storage for volume determination, thorough agitation and sampling at the end of each trial. In addition, core manure samples based on a grid system were obtained at the end of each growth phase. Manure volume in each pit was determined at diet phase changes by taking 6 gridded depth measurements between the slatted floor. Manure samples were analyzed for pH, dry matter, ash, total nitrogen (N), ammonium N, phosphorus (P), carbon (C), and sulfur (S). Data defining the relationship between the reduction in dietary CP with a reduction in manure N and other changes in manure characteristics are essential to model development of the impact of this mitigation strategy on GHG emissions. An additional benefit will be defining the limits of this strategy without impacting animal growth performance under conditions where industry stakeholders have input.
Validation study – What did we learn (results)?
Coming Soon! (first half 2016)
Modeling the Data
[See also: Virginia Tech modeling efforts] Current nutritional requirement models for swine are focused on partitioning of dietary energy and amino acids to maintenance, growth, gestation, and lactation. Little focus is placed on predicting nutrient excretion, and thus these models cannot be used to provide inputs to an emissions model. Models that predict excretion of energy, protein, and phosphorus have been developed, but have not been evaluated for the accuracy of predictions; and evaluations that have been undertaken focus on predictions of growth and body composition, not nutrient excretion.
GHG emissions from manure storage facilities can be predicted from manure composition, underscoring the need for a robust animal model capable of predicting both animal performance and nutrient excretion. Prediction of GHG emissions from swine manure requires knowledge of N and volatile solids content, neither of which are provided by current NRC predictions.
Data from the nitrogen mitigation growth and nitrogen excretion studies were utilized in enhancement of an animal model capable of predicting swine performance and excretion of nitrogen, carbon, and volatile solids (inputs required by the DNDC model). The growth model developed by the workers at UC-Davis and the recently released Nutrient Requirements of Swine (NRC) eleventh revised edition will be used as a starting point for model development. Equations describing the response to dietary protein and amino acid additions will be evaluated for accuracy, and the effects of Paylean on animal performance and manure nutrient output will be encoded and tested for accuracy. This work is scheduled to precede and utilize data from the UA trial and literature sources. The model will be further evaluated in the 5th year using the Purdue data set.
Air emissions from animal agriculture operations and manure storage include gases and particulate matter (dust). The amounts and types of gases can be affected by many different factors, including animal diet. Altering animal diets to reduce the levels of air emissions can be done by finding ways to more closely match animal needs with nutrients available in their diet.
The materials on this page were developed to assist educators and professors who include animal diet, feed management and air emissions topics in their classrooms or educational programs.
This archive includes embedded videos 10 to 14 minutes in length. Topics include: beef cattle, reducing nitrogen excretion, dairy cattle, and swine. Links are included to download the individual videos and PDF versions of the presentation slides.
Additional Information
You may also be interested in visiting the LPELC Feed Management section for short articles (use the printer-friendly link to create handouts), archived webinars, and a series of dairy fact sheets. Most of these resources are focused on nutrient management with less emphasis on air emissions.
Acknowledgements
These materials were developed by the Air Quality Education in Animal Agriculture (AQEAA) project with financial support from the National Research Initiative Competitive Grant 2007-55112-17856 from the USDA National Institute of Food and Agriculture.
For questions about the materials on this page contact Dr. Kevin Janni, University of Minnesota (kjanni@umn.edu). For questions about the AQEAA project, contact Dr. Rick Stowell, Unviersity of Nebraska (rstowell2@unl.edu).
If you have presentations, photos, video, publications, or other instructional materials that could be added to the curricula on this page, please contact Dr. Janni or Jill Heemstra (jheemstra@unl.edu).
What Is the Connection between Phosphorus and Water Quality?
“Phosphorus (P) is an essential element for plant and animal growth and its input has long been recognized as necessary to maintain profitable crop and animal production. Phosphorus inputs can also increase the biological productivity of surface waters by accelerating eutrophication. Eutrophication is the natural aging of lakes or streams brought on by nutrient enrichment. This process can be greatly accelerated by human activities that increase nutrient loading rates to water. Eutrophication has been identified as the main cause of impaired surface water quality (U.S. Environmental Protection Agency 1996). Eutrophication restricts water use for fisheries, recreation, industry, and drinking because of increased growth of undesirable algae and aquatic weeds and the oxygen shortages caused by their death and decomposition.” Reprinted with permission from the author: Sharpley et al., 2003)
The association of P with eutrophication of surface waters has resulted in a significant focus on the role of P in animal agriculture. P-related research in recent years has concentrated on two main areas: reducing P excretion from livestock and application and transport of P on agricultural fields. Lowering dietary P concentration has been a means of reducing P inputs to dairy operations. In 2003, a report indicated that, on average, dietary P concentrations were 34% above recommended levels. Reducing the dietary P concentrations in dairy cattle diets to recommended concentrations has not negatively impacted milk production, health, or reproductive parameters. The economic advantages of reducing P imports to the farm have helped to improve industry acceptance of this management practice and have led dairy producers and nutritionists to reduce the P concentrations in dairy diets. (Reprinted with permission from the author: Harrison et al., 2007).
References
Harrison, J. H., T. D. Nennich, and R. White. 2007. Review: Nutrient management and dairy cattle production. CABI Publishing 2007 (Online ISSN 1749-8848). Available online at https://www.cabi.org/cabreviews/review/20073124579 (Verified 14 December, 2010).
Sharpley, A.N., T. Daniel, T. Sims, J. Lemunyon, R. Stevens, and R. Parry. 2003. Agricultural Phosphorus and Eutrophication, 2nd ed. U.S. Department of Agriculture, Agricultural Research Service, ARS–149, 44 pp.
Research Project on Phosphorus Feed Management
A project started in February 2009 to enhance feed management practices to reduce manure phosphorus excretion in dairy cattle. This project takes an “integrated approach” to increase the adoption of reduced phosphorus feeding on dairy farms.
Overall Goal
Improve our accuracy of meeting the phosphorus requirement of the dairy cow without oversupplying phosphorus in the ration by better understanding the availability of phoshorus in feedstuffs (reduce current practices of overfeeding phosphorus to ensure that the animal requirements of phosphorus are met).
Project Funding
This project has been funded by the USDA National Research Initiative Program from 2009 through 2012.
Project Team
Project Director: Katharine Knowlton Virginia Tech Department of Dairy Science
Email: knowlton@vt.edu
Charlie Stallings Virginia Tech Department of Dairy Science
Email: cstallin@vt.edu
Bob James Virginia Tech Department of Dairy Science
Email: jamesre@vt.edu
Mark Hanigan Virginia Tech Department of Dairy Science
Email: mhanigan@vt.edu
Joe Harrison Washington State University, Puyallup
Email: jhharrison@wsu.edu
Evaluate the variation in digestion and excretion of phosphorus-containing compounds in lactating cows using the newly developed analytical techniques.
Tzu-Hsuan Yang, Virginia Tech grad student, analyzing samples with nuclear magnetic resonance. cc2.5 Katharine Knowlton
Develop and test a model that will more accurately estimate phosphorus digestion and metabolism in lactating cows. The model will be used in dairy cattle ration formulation.
Develop, implement, and assess an effective information transfer process to encourage adoption of research findings via educational tools and on-farm assessment.
Dr. Bob James, Virginia Tech dairy science professor, is leading a project where nine Virginia dairy farms have implemented feed management software to improve feed management through ration formulation and more accurate mixing and delivery of rations. cc2.5 Bob James and Lynn VanWieringen.
Outreach Opportunities:
Our team is ready and willing to serve as speaker for nutrition conferences on the following topics:
Using feed management software to improve farm profitability and whole farm nutrient balance – Dr. Bob James Email: jamesre@vt.edu
Incentive payments to reduce overfeeding of phosphorus – Dr. Charlie Stallings Email: cstallin@vt.edu
Next generation of precision feeding – Where are we going from here? – Dr. Katharine Knowlton and Dr. Mark Hanigan Emails: knowlton@vt.edu, mhanigan@vt.edu
Modeling Phosphorus Digestion to Improve Predictions in Ration Balancing Software – Dr. Mark Hanigan Email: mhanigan@vt.edu
Presentations:
Impact of feed management software on feeding management and whole farm nutrient balance of Virginia dairy farms
Robert James, B. E. Cox, C. S. Stallings, K. F. Knowlton, M. Hanigan
The impact of precision feeding utilizing feed management software on whole farm nutrient balance (WFNB), dietary phosphorus, and feeding management was studied on nine treatment and six control farms selected in four regions of the Chesapeake Bay Watershed of Virginia from 2006 through 2008. Herd sizes averaged 271 and 390 lactating cows, and milk yield averaged 30 and 27 kg/cow/d for treatment and control farms. Crop hectares averaged 309 and 310 for treatment and control farms. Treatment farms installed feed management software between May and October 2006. Data were collected for calendar year 2005 and each calendar year through 2008 to compute WFNB. On treatment farms, up to five feed samples were obtained monthly including each total mixed ration (TMR) fed to lactating cows. Control farms submitted TMR samples every two months. Standard wet chemistry analysis of samples was performed. Feed management data stored in the software were collected monthly from each treatment farm concurrent with feed sampling. Daily overfeeding of all dietary ingredients across treatment farms averaged 1.25% ± 5.86, ranging from -67.28% to +54.57% during the first year of the trial. This corresponded to average daily overfeeding of CP and P of 2.26% ± 6.88 and 1.91% ± 6.39, respectively for 2006. Whole farm nutrient balance did not differ between treatment and control farms for 2006. However, eight of nine treatment herds qualified for incentive payments for limiting P intake to less than 120% of NRC requirements in 2006. Data from 2007 and 2008 indicated that herds utilizing feed management software formulated and fed rations that were within 116% of NRC requirements for P. Data from feed management software revealed that extensive use of by-product feeds and the high nutrient variability of forages contributed to overfeeding of both CP and P. Category: Agricultural BMPs
View slide show
This presentation was presented at the 2011 American Dairy Science Meetings in New Orleans by Partha Ray, M D Hanigan, and K F Knowlton.
Quantification of phytate in dairy digesta and feces using alkaline extraction and HPIC
Publications:
Using Incentive Payments to Reduce Overfeeding of Phosphorus
This poster was presented at the 2010 Land Grant and Sea Grant National Water Conference by Charles C. Stallings, K. F. Knowlton, R. E. James, and M. D. Hanigan.
View Dairy Incentive Poster
Total and inorganic phosphorus content of an array of feedstuffs
This poster was presented at the 2011 American Dairy Science Meetings in New Orleans by Jamie Jarrett, M D Hanigan, R Ward, P Sirois, and K F Knowlton.
Total and inorganic phosphorus content of an array of feedstuffs
Fate of phosphorus in large intestine of dairy heifers
This poster was presented at the 2011 American Dairy Science Meetings in New Orleans by Partha Ray, M D Hanigan, and K F Knowlton.
Fate of phosphorus in large intestine of dairy heifers
Webcasts:
Precision Phosphorus Feeding for Dairy Cows
This presentation was originally broadcast on March 19, 2010. There are four short presentations:
Dietary Nutrient Management: What Goes In Must Come Out – Dr. Mark Hanigan, Department of Dairy Science, Virginia Tech
Precision Phosphorus Feeding Incentive Program – Dr. Charles Stallings, Department of Dairy Science, Virginia Tech
Impact of Feed Management Software on Feeding Management and Whole Farm Nutrient Balance – Dr. Robert James, Department of Dairy Science, Virginia Tech
During this session on February 7, 2011, Katharine Knowlton of Virginia Polytechnic Institute and State University and Jimmy Hufard, a dairy producer in Virginia, discussed regulations pertaining to phosphorus and how these can affect the dairy farm.
Feed is the single largest source of nutrients brought onto swine farms, averaging 79 to 85% of nutrient inputs for the 13 farms in this study. Feed management decisions that impact dietary nutrient concentration and feed use efficiency are the most significant factors in explaining WFNB. Implementing available feeding technologies will reduce nutrient excretion and improve nutrient sustainability on many swine farms.
Feeding swine is the highest economic cost (65 to 70%) for the pork operation. In addition, diet formulation and utilization of the nutrients in the ration by pigs has a major influence on the excretion of nutrients and potentially the balance of the nutrients on a farm. If larger amounts of nitrogen (N) and phosphorus (P) are imported (inputs – animals, feed, and fertilizer purchases, legume fixed N, and N in irrigation water) on the farm compared to the amount of N and P exported off the farm (managed outputs – sale of pigs, crops and/or exported manure) then there is a nutrient imbalance which leads to nutrient accumulation on the farm. A whole farm nutrient balance (WFNB) study was conducted for two years (2006-2007) on 13 pork production operations ranging in size from 2,000 to 16,000-head finisher capacity. For more information about the farms involved in this study go to Overview of Nutrient Management Lessons Learned. Following are some observations from this study related to the feeding programs of the farms and feed management.
Table 1. Average Whole Farm Nutrient Balance for 13 swine farms over 2 years.
Average Inputs, Outputs, or Balance (lbs/year)
Portion of Total Inputs or Outputs (%)
Average Inputs, Outputs, or Balance (lbs/year)
Portion of Total Inputs or Outputs (%)
space
Nitrogen Balance
Phosphorus Balance
Inputs
Animals
7,700
3%
1,700
4%
Feed
175,700
79%
31,900
84%
Fertilizer
24,800
11%
4,200
11%
Legumes
13,300
6%
space
space
Irrigation
1,800
1%
space
space
Total Inputs
223,500
100%
37,800
100%
space
Managed Outputs
Animals
69,600
47%
13,600
54%
Crops
67,100
46%
9,800
39%
Manure1
10,000
7%
1,900
8%
Total Outputs
146,800
100%
24,800
100%
Imbalance
76,600
space
12,400
space
Input/Managed Output Ratio2
1.5 to 1
1.5 to 1
Input of Nutrients
Average N and P inputs on the 13 swine farms from feed purchases made up 79% of the total N inputs and 84% of the P inputs for the two year period (Table 1). The range of N inputs from feed was 20 to 95% and the range of P inputs from feed was 23 to 100% for the farms over the two year period. A majority of purchased feed inputs for the farms ranged from 77 to 95% for N and 71 to 100% for P. Farms with lower N and inputs from purchased feed utilized corn grown on the farm versus the purchase of corn for most or all of rations fed. A more common practice is to sell corn grown on the farm and purchase a complete ration including the corn from a feed mill. The average ratio of N and P inputs to managed outputs2 averaged 1.5 for each. However, the range of ratios of N and P inputs to outputs were 1.1 to 2.5 and 0.8 to 2.9, respectively.
Diet Composition
The average dietary crude protein and P levels were measured for the diets fed during the duration of this study. . Figures 1 and 2 demonstrate the relationship of the dietary crude protein and total dietary P levels to the WFNB ratio of N and P inputs to outputs on the pork operations.
Figure 1. Whole farm N balance for 13 swine farms vs. dietary crude protein level.
Average dietary protein levels ranged from 13.8 to 18.6% across all operations. There was no impact of dietary crude protein level on the ratio of N inputs to outputs which was surprising. Apparently, even though it was anticipated that the increased crude protein in the diet would increase N excretion and an imbalance in the N ratio, there are other circumstances that over-shadowed any direct impact of crude protein level on N ratio. While the reasons are unknown, there may have been significant differences on N losses during manure storage or other farm system components (e.g. direct ammonia emission from animal housing) which may have overshadowed these results.
Figure 2. Whole farm P balance for 13 swine farms vs. dietary phosphorus level.
There was an indication of an increase in the WFNB ratio of P inputs to outputs as affected by increases in total P in the diet. Average dietary total P levels ranged from 0.40 to 0.75%. The highest (0.75%) P diet content of one farm was due to being a gilt development operation which required higher dietary P levels for improved bone development and longevity in the breeding herd. Although other P inputs from purchased fertilizer can have an impact on the ratio of P inputs to outputs, it is clear that total dietary P is a major factor impacting this ratio. Therefore, any means of improving ingredient availability of P by the use of phytase or utilizing more biologically available P ingredient sources would reduce the amount of inorganic P in the diet. The widespread adoption of these feeding technologies has likely produced significant improvement in swine WFNB in recent years.
Feed Efficiency
The comparison of feed efficiency with WFNB further suggests the importance of feed management decisions (Figure 3). Lower feed required per pound of gain was associated with farms with better whole farm nutrient balances. The combination of dietary concentration (Figure 2) and feed efficiency (Figure 3) explains more than half of the variability observed in Whole Farm Nutrient Balance.
Figure 3. Impact of feed utilization efficiency on Whole Farm Nutrient Balance. Farrow to finish and gilt finishing results (5 data points) were removed from data set.
Practical Applications
Comparing the total dietary P levels in a swine farm with the ratio of P inputs to outputs reveals that a reduced total dietary P resulted in lower P ratios. For example, a finisher operation that had an average 0.62% total dietary P level across the feeding period the first year was reduced to 0.55% total dietary P the second year and resulted in a change in the ratio of P inputs to outputs from 1.9 the first year to 1.7 the second year. Another example showed that the reduction of the total dietary P for a gilt development farm was from 0.75% total dietary P the first year to 0.66% total dietary P the second year plus no purchase of P fertilizer resulted in the P ratio dropping from 3.3 to 1.8 in one year.
A spreadsheet calculator can be used to determine the potential benefits of reducing the dietary total P level in the diet. Table 2 summarizes an example exercise for one farm. For example, if a 4000 head capacity feeder pig to finish operation with 440 acres in a corn and soybean rotation (Farm A2) currently has a 0.46% total dietary P level. When comparing a lower (0.40% dietary P if phytase and/or ingredients with high P availability is used) and a higher dietary P level (0.60% dietary P), the WFNB ranges from a low of 0.9 to 1 to a high of 1.3 to 1 for P. When the average crude protein levels changed from 16.9% (current practice) to 15.5% or 14.0% (diets based upon crystalline amino acid inclusion or change in dietary ingredients with more digestible amino acids) with this farm, the N balance was reduced and the N ratio for inputs to outputs were reduced from 1.1 to 1.0 and 0.95, respectively. These changes may result in a need for additional N and P purchased fertilizer to meet the needs of the corn/soybean rotation for this 440 acre swine farm no longer met by the nutrients in excreted manure.
Table 2. Cases of impact of diet change on farm A2 whole farm nutrient balance.
Current Ration
Change 1
Change 2
% Dietary Crude Protein
16.9%
15.5%
14.0%
N Imbalance (lbs/yr)
18,300
5,100
-9,000
N ratio2
1.11 to 1
1.03 to 1
0.95 to 1
space
% Dietary Phosphorus
0.46%
0.40%
0.60%
P Imbalance (lbs/yr)
700
-2,900
8,800
P ratio2
1.02 to 1
0.90 to 1
1.30 to 1
Summary
Altering the diet formulation of swine rations can have a significant impact on the excretion of nutrients and the WFNB of a farm especially P. Choice of feed ingredients and/or the use of additives that enhance availability of dietary nutrients can help reduce nutrient excretion and reduce farm nutrient imbalances.
Ammonia (NH3) generation from poultry production is a result of microbial decomposition of uric acid and undigested nitrogen in bird feces. Ammonia emission is associated with nitrogen (N) content of the feces, which is influenced by feed composition and feed conversion efficiency of the bird. To reduce N content in feces, ration may be formulated with reduced dietary crude protein (CP) and supplemented with limiting amino acids (AA) to match bird dietary requirements, thereby improving digestive conversion efficiency. Utilization of lower CP diets with supplemented essential amino acids is a source reduction method to mitigate ammonia emission from layer hen production facilities. Lower N excretion in the bird feces due to lower total N intake can result in lower NH3 emission from the system. The lower CP diet used in this study had 0.4 to 1.2% less CP than the standard or control diet during various feeding phases. The lower CP diet resulted in about 10% ammonia emission reduction. Formulation based on nutritional requirement at different feeding phases is required to achieve emission reduction without affecting bird performance, i.e. egg production and case weight. The cost of low CP diet is about 1% lower than that of the standard dietary formulation (2008 prices).
Applicability and Mitigating Mechanism
Lower CP diet can have 0.4 to 1.2% lower CP than a standard diet during the various feeding phases.
Soy content is reduced in lower CP diets, and crystalline AA DL-methionine, L-lysine.HCL and L-threonine is supplemented to maintain the same essential AA levels in both diets for a given feeding phase.
Tryptophan and isoleucine in the lower CP diet may be slightly lower (from 0.02% to 0.06%) than those in the standard diets without affecting bird performance.
Limitations
Crude protein in the diet can only be reduced to certain level to avoid negatively impacting bird performance.
Cost
The cost for the lower CP diet with supplemented crystalline AA DL-methionine, L-lysine.HCL and L-threonine is about 1% lower than that for the standard diet. The cost advantage is better now with the current higher grain costs than in year 2003 when the study was conducted.
Authors
Y. Liang1, H. Xin2, R.S. Gates3, E.F. Wheeler4, K.D. Casey5, B.R.Behrends6, D.J.Burnham7 1University of Arkansas, Fayetteville, AR, 2Iowa State University,Ames, IA, 3University of Kentucky, Lexington, KY, 4Pennsylvania State University, University Park, PA, 5Texas AgriLife Research, Amarillo, TX, 6Agri-Tech, a Sparboe Company, Litchfield, MN, 7Aviagen, Huntsville, AL Point of Contact:
Hongwei Xin, hxin@iastate.edu
Dietary manipulation, such as lowering crude protein with amino acid supplementation or fiber addition, is an effective method to decrease ammonia emissions from swine finishing facilities. Lowering crude protein content of the diet with amino acid supplementation markedly reduces nitrogen excretion. In studies conducted for the entire finishing period (Bundy et al., 2008; Lachmann et al., 2007), lowering crude protein content by 3 percentage units with amino acid supplementation decreases total nitrogen excretion by approximately 30% and ammonium nitrogen concentration of the slurry by 37%. The decrease in nitrogen excretion reduces the concentration of ammonium in the slurry which in turn decreases ammonia emission. Results suggest a reduction in ammonia emission of up to 50% with the use of a low protein diet. Additionally, the reduction in ammonium concentration of the slurry also reduces slurry pH which affects ammonia volatilization. Addition of fiber sources to the diet reduces urinary urea excretion which can be degraded enzymatically to ammonia. Fiber addition affects nitrogen excretory patterns and reduces ammonium nitrogen concentration of the slurry which can lead to further reductions in ammonia emissions. The reduction in crude protein content or addition of fiber sources to swine diets can reduce or change nitrogen excretion patterns resulting in marked decreases in ammonia emissions for pigs housed in facilities with shallow pit, pull-plug waste storage systems.
Applicability and Mitigating Mechanism
NH3 emissions from swine housing is dependent on the amount of nitrogen excreted
Swine typically excrete 30 to 50% of the nitrogen consumed
Reducing dietary crude protein with amino acid supplementation can markedly decrease nitrogen excretion
Addition of fiber sources to diets also has potential to influence nitrogen excretion patterns
These dietary manipulations can markedly decrease ammonia emissions from swine finisher facilities
Limitations
Correct estimation of the amino acid requirements of the pig is critical
Accurate supplementation of amino acids is critical to reduce risk on growth performance and carcass traits
Nutrient content of fiber sources is needed for diet formulation
Upper limits to crude protein reduction and fiber addition in diets
Cost of amino acid supplementation and use of nutritionist in formulation
Cost
The costs associated with dietary manipulation are solely dependent upon ingredient cost assuming growth performance and carcass traits are not adversely affected. Formulation of low protein diets involves the partial removal of soybean meal from the diet accompanied by replacement with corn and crystalline amino acids (lysine HCl, DL-methionine, L-threonine). Therefore, evaluation of implementation cost weighs the decrease in soybean meal costs versus the increase in corn and amino acid costs within the diet. Using March 2008 ingredient costs, diet costs for a conventional corn-soybean meal based diet and a low protein (-3%), amino acid supplemented diet are similar. Thus, assuming no difference in growth rate or feed intake, cost of gain and total feed cost for the finishing period are similar. Dietary costs need to be re-evaluated with changing ingredient costs.
Authors
Scott Carter, Mariela Lachmann, Justin Bundy; Oklahoma State University Point of Contact:
Scott Carter, scott.carter@okstate.edu
There are a large number of options that can potentially be used to mitigate methane emissions from dairy cattle. The basic result of using these approaches is an improvement in the efficiency of nutrient use in the animal and increased productivity. Methane emissions per unit of milk produced will decrease as a result of these changes. An important component is continuing to improve forage quality. Higher quality forages have higher digestibility in the cow and less methane emissions than lower quality forages. A second approach is to better balance the diet protein and carbohydrate fractions to improve the efficiency of both rumen fermentation and feed nutrient use. Methane emissions will be reduced as a result. There are also opportunities to provide specific feed additives to decrease methane emissions from the cow. Their use is currently limited due to lack of data to demonstrate their efficacy in lactating dairy cows. Ionophores are one feed additive that does have data indicating improved feed efficiency and decreased methane emissions.
Applicability and Mitigating Mechanism
Potential mitigation options include:
Improved forage quality
Rations balanced to improve efficiency of rumen fermentation
Use of ionophores in rations
Limitations
Many options will require some financial investment
Management changes may be needed
Requires a systems approach
Feed additives that could be helpful in reducing methane emissions have not been tested in animal trials
Cost to benefit ratio cannot be defined for many practices that could be use
Cost
The cost of practices that could be implemented on a dairy farm to reduce methane emissions will be highly farm specific. Each farm will need to evaluate the available mitigation options to determine the best choices for their situation. The costs for implementation will also vary between farms due to differences in their current cost structures. The initial benefits to the farm will be improved efficiency of animal production, efficiency of nutrient use and improved profitability.
Authors
Larry Chase, Cornell University Point of Contact:
Dr. L.E. Chase, lec7@cornell.edu
Dietary manipulation has been shown to lower ammonia emission from laying-hen manure. Dietary amendments include lowering the protein content of the diet, including high-fiber ingredients such as corn distiller’s dried grains with solubles (DDGS), or including EcoCalTM—a proprietary mixture of calcium sulfate and zeolite. Liang et al. (2005) showed that a 1% lower crude protein diet caused a 10% decrease in ammonia emission from laying hens housed in high-rise houses. Roberts et al. (2007) found 40% lower ammonia emission from manure of hens fed 10% DDGS, 38% lower emission when hens were fed 7.3% wheat middlings, and 26% lower emission when hens were fed 4.8% soybean hulls compared to a standard diet. Field research from our group indicates that 3.5% dietary EcoCal lowers ammonia emission by 23%. Research has also evaluated the egg production from hens fed each of the adjusted diets and demonstrated that, when diets are properly formulated, egg production will be similar to that from hens fed a standard control diet.
Applicability and Mitigating Mechanism
Ammonia volatilization from laying-hen manure is affected by manure pH, content and chemical form of nitrogen, moisture content, and physical handling of manure
Low protein diets lower nitrogen content of the manure
High-fiber diets lower manure pH
In EcoCal, calcium sulfate lowers manure pH and zeolite binds ammonia, preventing or reducing volatilization
Limitations
High-fiber ingredients may not be suitable for nutrient-dense diets
Amino acid requirements of hens must be precisely known in order to formulate low-protein diets and maintain egg production
EcoCal adds cost to the diet with little nutrient addition
Diet cost and ammonia reduction must be evaluated for each individual egg production situation
Cost
The cost of diet modifications must be determined for each individual egg production situation. Feed ingredients are often priced according to private contracts and proximity to the supplier. Feed ingredients can only be added to the diet in exchange for other ingredients (mainly corn and soybean meal), making the evaluation of price amongst ingredients difficult. This exchange of one ingredient for another should be analyzed as the total diet cost of a nutritionally balanced diet, considering all ingredients together. Least-cost diet formulations consider the cost of an ingredient with regards to nutrient content. High-fiber ingredients are typically going to have a relatively low energy content and varying contents of digestible amino acids and minerals, which can be valued in the diet formulation. Low-crude protein diets are formulated by adding crystalline amino acids to the diet, replacing soybean meal and increasing corn. These diets may be cost-effective if the price of amino acids is favorable. EcoCal contributes some calcium to the diet, partially replacing limestone, a relatively inexpensive diet component.
Authors
S.A. Roberts1, H.Xin1, H. Li1, R.T. Burns1, K. Bregendahl1, E.C. Hale III3 1Iowa State University, Ames, Iowa, 2 Rose Acre Farms, Seymore, Indiana Point of Contact: hxin@iastate.edu
To provide the best experiences, we use technologies like cookies to store and/or access device information. Consenting to these technologies will allow us to process data such as browsing behavior or unique IDs on this site. Not consenting or withdrawing consent, may adversely affect certain features and functions.
Functional
Always active
The technical storage or access is strictly necessary for the legitimate purpose of enabling the use of a specific service explicitly requested by the subscriber or user, or for the sole purpose of carrying out the transmission of a communication over an electronic communications network.
Preferences
The technical storage or access is necessary for the legitimate purpose of storing preferences that are not requested by the subscriber or user.
Statistics
The technical storage or access that is used exclusively for statistical purposes.The technical storage or access that is used exclusively for anonymous statistical purposes. Without a subpoena, voluntary compliance on the part of your Internet Service Provider, or additional records from a third party, information stored or retrieved for this purpose alone cannot usually be used to identify you.
Marketing
The technical storage or access is required to create user profiles to send advertising, or to track the user on a website or across several websites for similar marketing purposes.


 Maximizing feed grade amino acid (FGAA) use and reducing dietary crude protein in swine diets has been shown to dramatically reduce nitrogen excretion in both nursery and growing/finishing swine which could substantially reduce nitrous oxide (N