
Renewable Natural Gas – Biogas Cleaning and Upgrading 101

With depressed electrical prices for produced biogas, many projects are now moving towards business models predicated on production of renewable natural gas (RNG). In order to produce RNG, projects must first clean and upgrade raw biogas to pipeline and/or transportation fuel quality through the use of various engineering approaches. In this presentation, an overview of available and emerging biogas cleaning and upgrading technologies are discussed, highlighting positives, negatives and costs.  

Who Should Consider Biogas Cleaning?

The aim of this fact sheet is to provide farmers, third party project developers, regulatory agencies, and other stakeholders with a basic understanding of the chemical composition of renewable natural gas, the most appropriate end use options for dairy digesters, and some of the more common techniques used to clean biogas to RNG quality at dairy digesters.

What did we do? 

The authors utilized years of research and industry expertise as well as thorough literature search describe the concept of renewable natural gas and the technologies to clean the biogas. The authors aimed to provide information based on the current literature, but not to favor one technology over another.

What have we learned? 

When CHP is the end-use of biogas, the most common biogas purification approach for dairy digesters in the US is to remove water vapor and hydrogen sulfide. Existing projects use a variety of approaches, ranging from biological processes (both post digestion and via oxygen injection into the digester) to physical-chemical absorption processes such as iron type-sponge or activated carbon.

However, if RNG is the end-use a higher degree of purity is required. Often times a dedicated water vapor removal unit and hydrogen sulfide scrubbing unit is still required for removal of the bulk of the hydrogen sulfide mass. Thereafter, water scrubbing or PSA are often used to remove carbon dioxide from biogas, producing an RNG fuel that can be utilized in a variety of different ways. Other technologies exist, however their application on dairy digesters has been rather limited due to concerns related to maturity, cost, and complexity. The best technique is also situation-specific, and therefore, it is critical to understand the mechanics of each purification process, its limitations, and its economics before making a decision.

As electrical rates continue to drop throughout the PNW and US, current and new AD project developers are strongly considering a shift from CHP towards higher value end-uses for biogas, particularly RNG. Interest is increasing due to a growing CNG industry in the US, the decoupling of CNG and diesel prices, and the potential for competitive pricing and high revenues in comparison to fossil-CNG, given existing government incentives. Projects are presently limited and business models must still be proven before wide-scale adoption of biogas upgrading technologies within a dairy digester platform. In addition, concerns historically plaguing CHP projects, related to power purchase agreement pricing, interconnection fees, and scaling are still potentially present within a pipeline fuel model. Nonetheless, the potential exists for a new business model approach to AD projects on US farms.

Future Plans 

No future plans.

Authors

Craig Frear, Assistant Professor, Washington State University cfrear@wsu.edu

Nick Kennedy, Associate in Research WSU; Georgine Yorgey, Associate in Research WSU; Dan Evans, President Promus Energy; Jim Jensen, Associate in Research, WSU Energy; Chad Kruger, DIrector WSU CSANR

Additional information 

For those seeking additional detail, or information about other technologies, more comprehensive reports and reviews are available (Jensen, 2011; Krich et al., 2005; Ryckebosch et al., 2011). This publication is part of the Anaerobic Digestion Systems Series, which aims to provide information that improves decision-making for anaerobic digestion systems.

Acknowledgements

This research was supported by funding from USDA National Institute of Food and Agriculture, Contract #2012-6800219814; National Resources Conservation Service, Conservation Innovation Grants #69-3A75-10-152; Biomass Research Funds from the WSU Agricultural Research Center; and the Washington State Department of Ecology, Waste 2 Resources Program.

The authors are solely responsible for the content of these proceedings. The technical information does not necessarily reflect the official position of the sponsoring agencies or institutions represented by planning committee members, and inclusion and distribution herein does not constitute an endorsement of views expressed by the same. Printed materials included herein are not refereed publications. Citations should appear as follows. EXAMPLE: Authors. 2015. Title of presentation. Waste to Worth: Spreading Science and Solutions. Seattle, WA. March 31-April 3, 2015. URL of this page. Accessed on: today’s date.
Composting of Dairy Manure and Grape Vine Prunings as a Tool to Better Manage Both Industries Waste and Reduce Their Environmental Impact


Why Look at Grapevine Prunings As a Compost Feedstock?

The objectives of this research and Extension project were:

  • To determine the impact of mixing grape vine prunings with dairy manure in a compost mix on the composting process and final product.
  • In particular, we were interested in determining if nitrogen gets fixated into the compost mix with increased carbon content.
  • To evaluate if composting is a workable alternative to annual grape vine prunings burning. Stopping this annual burning will reduce vineyards environmental footprint.
  • To demonstrate three different on-farm composting techniques. Mechanically turned (MT), passive aerated (PA), and forced aerated composting (FA).

What did we do?

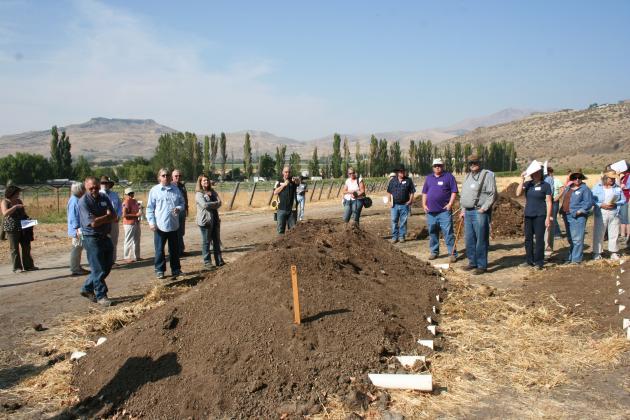
field day at compost pilesWe teamed up with a grape and a dairy producer and we built a series of windrows to showcase the three different composting techniques and to research the effects of mixing both waste streams. Grape vine prunings were grounded and mixed with open lot dairy manure. Carbon content of the mix was adjusted to meet organic production standards since the vineyard hosting the project was certified organic. Since the carbon to nitrogen ratio (C:N) of the grounded grape vine prunings was on the low side (80:1), horse stable sawdust and straw from the local county fairgrounds were also used to help increase the C:N. Three replications of each system (MT, PA, and FA) were built with the enhanced carbon mix. A third set of three replications with dairy manure as received (some straw but no added carbon) were built using the mechanically turned system (MTMA) to serve as a control and comparison for that system. In addition to collecting data to evaluate th e effects of the added carbon, the project included two field days where all the systems, how to construct them, and their advantages and challenges were showcased.
What have we learned?

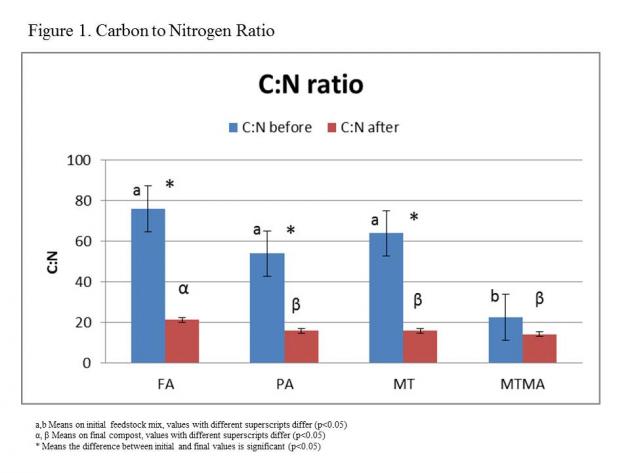
carbon to nitrogen rationThe initial feedstock mix C:N was significantly higher in the carbon enhanced windrows as expected, but the final C:N ratio of the compost was not significantly different among most systems and between the enhanced mix and the just manure mix (Figure 1). The C:N reduction between the initial mix and the final compost was significant in all systems of the carbon enhanced windrows, but not significant in the just manure mix (MTMA).

total nitrogenAs expected, the initial mix total nitrogen (TN) was significantly lower in the carbon (C) enhanced windrows compared to the just manure windrows (Figure 2). TN in the finished compost had no significant difference among all the systems. The difference between the initial mix and final compost TN wasn’t significant among C enhanced windrows, but highly significant in net values (10.08 Lb/T of N on dry weight basis; p<0.0001) on the just manure windrows. This difference in TN, coupled with the no significant difference in C:N, suggests the loss of nitrogen as ammonia during the composting process in the windrows made of just manure. Net nitrogen loss was significantly lower in the C enhanced windrows (1.45 Lb/Ton).
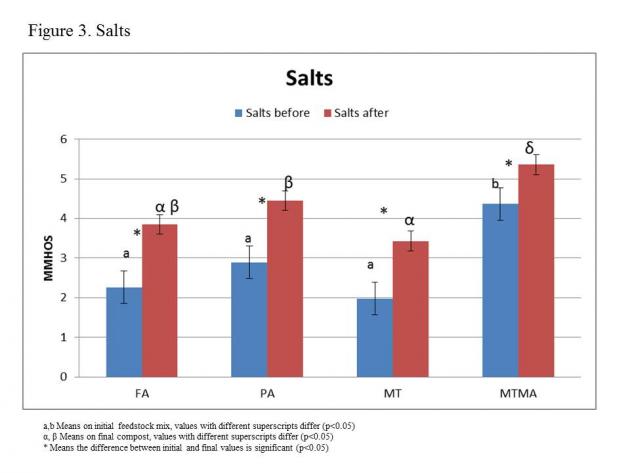
saltsSalts concentrations (mmhos) difference between initial mixes and final compost was significant in all windrows, with higher values in the final compost as expected due to the concentration effect that composting volume reduction has (Figure 3). Salt concentrations in the just manure windrows were significantly higher compared to the carbon enhanced mix. There is a dilution effect when carbon is added in the initial mix (lower manure mass per initial mix unit). Similar dilution trends were observed for phosphorous (P), potassium (K), and micronutrients. Carrying this dilution effect in the final compost can be beneficial when land applying compost since application rates can be increased, increasing the nitrogen and carbon content of the application (desirable conditions) by the time the limiting components in our soils (usually P, K, or salts) are reached.
Screening of the carbon enhanced windrows generated a refuse (bigger size particles) containing pieces of grape prunings that can be used as mulch to control weeds in the vineyard or other production units. When PFRP is achieved, plant pathogens in the mulch can be considered absent or inhibited, and the mulch will be usable on the same or similar plant species.

The PA and MT windrows with enhanced carbon mix reached USEPA-PFRP. FA system didn’t reach PFRP and had an incomplete composting process because of the lack of moisture in the initial mix due to problems with water supply during their construction. Other studies conducted by the authors using FA with similar feedstock had reached PFRP. MTMA windrows didn’t reach PFRP, a common event in the region due to the low carbon content of dairy manure.

Future Plans

This project demonstrated that composting of dairy and potentially other livestock manures mixed with woody wastes from the grape industry or similar agricultural products is not only feasible but beneficial for both industries. Further research is necessary to determine how different carbon and animal manures sources, especially harder woods, will affect the composting process and the final product.

Authors

Mario E. de Haro-Martí. Extension Educator. University of Idaho. mdeharo@uidaho.edu

Mireille Chahine, Extension Dairy Specialist
Tony McCammon, Extension Educator
Ariel Agenbroad, Extension Educator. University of Idaho

Additional information

Unpublished data. Please contact the author, Mario E. de Haro-Martí at mdeharo@uidaho.edu or 208-934-4417.

Acknowledgements

The authors want to thank the participating grape and dairy producers for their collaboration. This project was funded by an Idaho USDA-NRCS Conservation Innovation Grant (CIG).

The authors are solely responsible for the content of these proceedings. The technical information does not necessarily reflect the official position of the sponsoring agencies or institutions represented by planning committee members, and inclusion and distribution herein does not constitute an endorsement of views expressed by the same. Printed materials included herein are not refereed publications. Citations should appear as follows. EXAMPLE: Authors. 2015. Title of presentation. Waste to Worth: Spreading Science and Solutions. Seattle, WA. March 31-April 3, 2015. URL of this page. Accessed on: today’s date.

Effect of protein supplementation of low-quality forage diets on enteric methane production of beef steers


Purpose: 

Cattle are a significant source of agricultural greenhouse gas (GHG) emissions; with enteric methane being the major GHG produced under most management systems.  Decreasing enteric methane production of grazing cattle presents the greatest opportunity to reduce beef cattle GHG emissions because 1) enteric methane release is greater on forage-based than concentrate-based diets; 2) cattle fed high-fiber diets have lower rates of gain and thus require more time to reach market weight than cattle fed concentrate-based diets and 3) the vast majority of feed used to produce beef from conception to plate is forage-based.  Throughout the world cattle frequently graze low-quality forages that are deficient in protein.  While research has studied the effects of protein supplementation of low-quality forages on weight gain, feed intake and digestibility, effects on GHG emissions are lacking.  Therefore, the objective of this study was to identify the effects of protein supplementation to low-quality forage diets on GHG emissions.

What did we do? 

Twenty-three British-cross steers were utilized in a three-period crossover design.  Steers were provided ad libitum access to a low quality grass hay (4.9% crude protein) and assigned to one of three supplemental treatments: 1) no supplement (control), 2) cottonseed meal (CSM 0.29% of body weight), or ) dried distillers grain (DDGS 0.41% of body weight).  Supplemental protein intake was similar for the CSM and DDGS treatments.  Enteric CH4 and metabolic CO2 emissions were measured using a GreenFeed system (C-Lock Inc., Rapid City, SD).  Steers were offered supplement at 0800h each day in Calan headgates and hay was delivered after steers had consumed the supplement.  Data were analyzed using a mixed model (SAS,2013).   

What did we learn?

Supplementation with CSM or DDGS increased hay intake (P < 0.01) by an average of 53% compared to control.  Supplementation also increased (P < 0.01) total CO2 and total CH4 emissions compared to control, but no difference was noted between CSM and DDGS.  The increases in total production of CO2 and CH4 are attributed to the large increase in hay intake.  However, supplementing with CSM or DDGS decreased (P < 0.05) methane loss as a proportion of gross energy (GE) intake, compared to control steers.  Steers supplemented with DDGS tended (P < 0.10) to have a lower methane loss as a percentage of GE intake (Ym) than steers supplemented with CSM; probably because of the higher fat intake in cattle fed the DDGS.  Collectively, these data suggest that protein supplementation decreases the carbon footprint of beef cattle by decreasing methane emissions per unit of energy intake and per unit of production. 

Table 1. Effect of protein supplementation on greenhouse gas emissions and energy losses of steers

Future Plans

Additional studies will attempt to further define the effects of supplement composition and intake level on GHG emissions.

Authors

N. Andy Cole, Supervisory Research Animal Scientist and Lab Director, USDA-ARS-Conservation & Production Research Laboratory, Bushland, TX  Andy.cole@ars.usda.gov

Adam Shreck, ORISE Fellow sponsored by USDA-ARS-CPRL, Bushland, TX;

Jenny Jennings, Animal Nutritionist, Texas A&M AgriLife Research; Amarillo;

Richard Todd, Research Soil Scientist, USDA-ARS-CPRL, Bushland, TX.

Additional Information  

For more information contact Andy Cole, 806-356-5748

Acknowledgements

This research was partially funded by a USDA-NIFA-CAP Grant titled “Resilience and vulnerability of beef cattle production in the Southern Great Plains under changing climate, land use and markets”.

The authors are solely responsible for the content of these proceedings. The technical information does not necessarily reflect the official position of the sponsoring agencies or institutions represented by planning committee members, and inclusion and distribution herein does not constitute an endorsement of views expressed by the same. Printed materials included herein are not refereed publications. Citations should appear as follows. EXAMPLE: Authors. 2015. Title of presentation. Waste to Worth: Spreading Science and Solutions. Seattle, WA. March 31-April 3, 2015. URL of this page. Accessed on: today’s date.

On-Farm Evaluation of Wood bark-Based Biofilters in Terms of Mitigation of Odor, Ammonia, and Hydrogen Sulfide


Purpose

Mitigating odor and gas emissions is a big challenge facing concentrated animal feeding operations. Biofiltrtion has been recognized as one of the most promising technologies for reducing odor and gas emissions from animal facilities. However, the rate of on-farm biofilter adoption continues to be low. The purpose of this research was to demonstrate, evaluate, and encourage the widespread adoption of biofilters for mitigating odor and gas emissions.

What did we do?

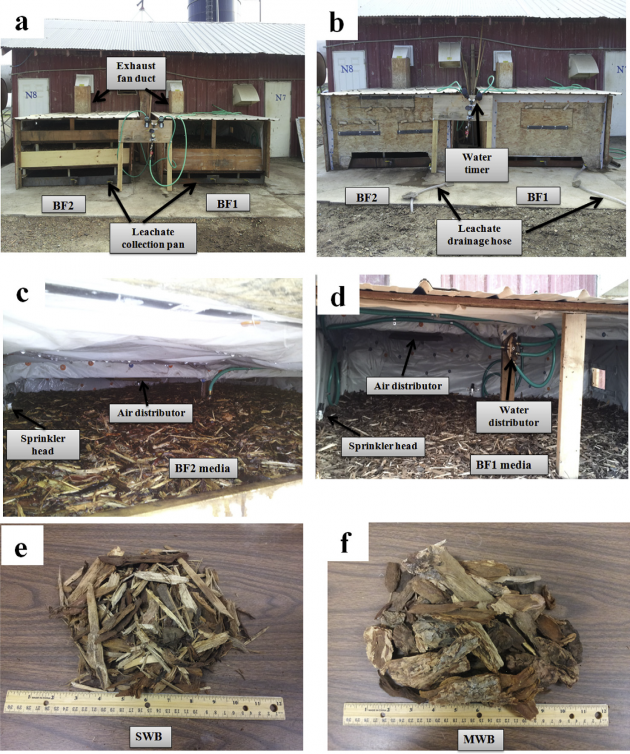
Two vertical down-flow biofilters were constructed on a commercial swine nursery farm. Both biofilter media were shredded wood bark and medium wood bark (1:2 on a volume basis). These biofilters were evaluated under real farm conditions in terms of mitigation of odor and gas emissions. Odor samples were collected using 10 L Tedlar bags and evaluated using a dynamic forced-choice olfactometer. Ammonia and hydrogen sulfide concentrations were monitored on-site by detection tubes. Pressure drop through the biofilter media was also measured on-site using an air velocity meter. A biofilter field day was held on the swine farm to demonstrate their effects and to present biofilter basics. Also, an educational video has been developed to help interested people get familiar with this technology.Picture (a)biofilter 1 (BF1) and biofilter 2(BF2) with front doors open; (b) biofilters with front doors closed; (c) media and water distribution system in BF2; (d) media and water distribution system in BF1; (e) shredded wood bark; (f) medium wood bark.

Figure 1. (a)biofilter 1 (BF1) and biofilter 2(BF2) with front doors open; (b) biofilters with front doors closed; (c) media and water distribution system in BF2; (d) media and water distribution system in BF1; (e) shredded wood bark; (f) medium wood bark.

What have we learned?

(2) Supporting materials showing biofilter basics and its effects on reducing aerosol emissions are needed to encourage biofilter adoption,
(3) Field days are a good platform for both research and demonstrations of new techniques,
(4) Producer’ collaboration and full participation are very important to make the research a success.

Odor and gas (NH3 and H2S) reduction efficiency and moisture distribution at different media depths of (a) biofilter 1 (BF1); (b) biofilter 2 (BF2)

Figure 2. Odor and gas (NH3 and H2S) reduction efficiency and moisture distribution at different media depths of (a) biofilter 1 (BF1); (b) biofilter 2 (BF2).

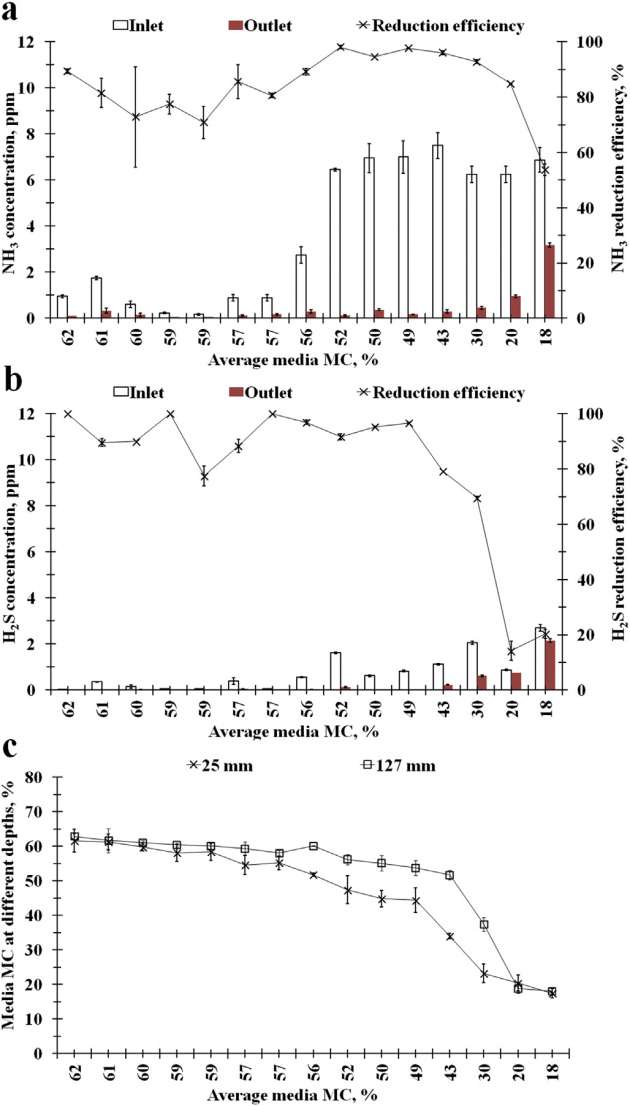
Reduction efficiency for first stage of biofilter 2 (BF2) at different media moisture contents (MC) (a) NH3; (b) H2S; (c) moisture distribution at different media depths. Shredded wood bark (depth of 127 cm) was used and EBRT was 0.9-1.0 s.

Figure 3. Reduction efficiency for first stage of biofilter 2 (BF2) at different media moisture contents (MC) (a) NH3; (b) H2S; (c) moisture distribution at different media depths. Shredded wood bark (depth of 127 cm) was used and EBRT was 0.9-1.0 s.

Reduction efficiency for second stage of biofilter 2 (BF2) at different media moisture contents (MC) (a) NH3; (b) H2S; (c) moisture distribution at different media depths. Medium wood bark (depth of 254 cm) was used and EBRT was 1.8-2.0 s.

Figure 4. Reduction efficiency for second stage of biofilter 2 (BF2) at different media moisture contents (MC) (a) NH3; (b) H2S; (c) moisture distribution at different media depths. Medium wood bark (depth of 254 cm) was used and EBRT was 1.8-2.0 s.

Future Plans

We will refine the developed educational videos and disseminate results from this study to our stakeholders.

Authors

Lide Chen, Waste Management Engineer and Assistant Professor, Biological and Agricultural Engineering Department, University of Idaho lchen@uidaho.edu

Gopi Krishna Kafle, Post-Doctoral Researcher; Howard Neibling, Extension Irrigation and Water Management Specialist and Associate Professor; B. Brian He, Professor, University of Idaho

Additional information

Contact Dr. Lide Chen at lchen@uidaho.edu for more information.

Acknowledgements

This project was partially funded by the USDA Natural Resource Conservation Service through a Conservation Innovation Grant. The authors gratefully thank Mr. Dave Roper for his cooperative efforts during this research.

The authors are solely responsible for the content of these proceedings. The technical information does not necessarily reflect the official position of the sponsoring agencies or institutions represented by planning committee members, and inclusion and distribution herein does not constitute an endorsement of views expressed by the same. Printed materials included herein are not refereed publications. Citations should appear as follows. EXAMPLE: Authors. 2015. Title of presentation. Waste to Worth: Spreading Science and Solutions. Seattle, WA. March 31-April 3, 2015. URL of this page. Accessed on: today’s date.

Lifecycle greenhouse gas (GHG) analysis of an Anaerobic Co-digestion Facility Processing Dairy Manure and Industrial Food Waste in NY State

While the theoretical benefits of anaerobic digestion have been documented, few studies have utilized data from commercial-scale digesters to quantify impacts.  Previous studies have analyzed a range of empirical studies to constuct emission factors for a generic European AD plant processing source separated municipal solid waste.  However, most U.S. studies have applied reporting protocols and have been based upon theoretical assumptions.  Furthermore, GHG analyses of U.S. co-digestion facilities are limited to one scenario in protocol based analysis of community digester options. 

Purpose          

We are not aware of any peer-reviewed studies of US anaerobic co-digestion. Several case studies have presented calculations of impacts using GHG reporting protocols, however significant portions of the lifecycle have been neglected such as the feedstock reference case emissions, digestate storage emissions and fertilizer displacement impacts. Furthermore, they have often been modeled using general theoretical assumptions such as number of cows rather than empirical data on feedstock volume and characteristics and digester operation.

What did we do? 

A lifecycle GHG analysis was performed based upon data reported on a farm-based anaerobic co-digestion system in New York State, resulting in an 71% reduction in GHG impact relative to conventional treatment of manure and food waste.

The objective of this study was to provide a comprehensive analysis of GHG emissions based upon a NYS digester that co-digests manure and industrial-sourced food waste. Empirical data on feedstock (t-km transport, avoided disposal, TS, VS, TKN), digester operation (m3CH4, KWh, exhaust emissions) and effluent properties (TS,VS,TKN) were combined with regional parameters (i.e., climate, soil type and management practices) to represent a state-of-the-art, anaerobic co-digestion facility in NYS. This data was combined with information collected through interviews in order to model a reference case, representing the business-as-usual food waste disposal and manure management practices en lieu of the anaerobic co-digestion system.

What have we learned? 

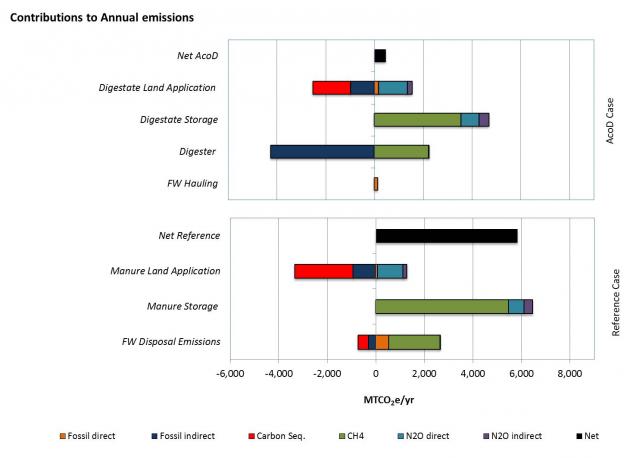
Displacement of grid electricity provided the largest benefit followed by avoidance of food waste landfill emissions and reduced impacts associated with storage of digestate vs. undigested manure. Nominal land application N2O emissions were offset by inorganic fertilizer displacement and carbon sequestration in both cases. The higher volume of digestate increased net land application emissions as did increased transportation distance to the fields and lower carbon sequestration. Digestate is a by-product of the co-digestion process and its treatment must be considered in an LCA. Modeling of land application impacts are highly uncertain and can be significant.

The largest source of direct emissions was CH4 emissions. N2O emissions were larger in the land application phase than during storage. Direct fossil fuel emissions had a minor impact. Emissions were offset by displacement of grid electricity and fossil based fertilizers along with carbon sequestration.

Future Plans    

More empirical research is needed to measure emissions and to provide emission factors that incorporate key variables and characteristics affecting emissions. A whole system, dynamic approach is necessary to incorporate complex interdependencies between stages of farm and manure management.

Authors

Jennifer L. Pronto, Research Assistant, Cornell University jlp67@cornell.edu

Ebner, Jackie      jhe5003@rit.edu              Rochester Institute of Technology

Rodrigo A. Labatut, Matthew J. Rankin, Curt A. Gooch, Anahita A. Williamson, Thomas A. Trabold

Additional information               

www.manuremanagement.cornell.edu

Figure 1: Contributional analysis of GHG impacts for the reference and anaerobic co-digestion cases.

Figure 1: Contributional analysis of GHG impacts for the reference and anaerobic co-digestion cases.


The authors are solely responsible for the content of these proceedings. The technical information does not necessarily reflect the official position of the sponsoring agencies or institutions represented by planning committee members, and inclusion and distribution herein does not constitute an endorsement of views expressed by the same. Printed materials included herein are not refereed publications. Citations should appear as follows. EXAMPLE: Authors. 2015. Title of presentation. Waste to Worth: Spreading Science and Solutions. Seattle, WA. March 31-April 3, 2015. URL of this page. Accessed on: today’s date.

Practical Use and Application of the Poultry Carbon Footprint Calculation Tool


Why Study Carbon Footprint on Poultry Farms?*          

The poultry industry is a major part of the agricultural industry in the United States, and an awareness of the carbon footprint of the industry is important for future growth and development. With carbon footprint estimated to be as high as 18% of total Green House Gas (GHG) emissions, changes in U.S. animal production systems will be a component in mitigating the impacts of the industry on climate change. Changes in GHG emissions from the poultry industry can be achieved only if the industry knows the levels of greenhouse gas emissions contributed as a result of poultry production.

What did we do? 

The Poultry Carbon Footprint Calculation Tool (PCFCT) was developed and designed specifically for poultry production farms. The tool can be used to estimate the greenhouse gas (GHG) emissions from pullet, breeder and broiler grow-out farms. While several life-cycle assessments have been completed for the production of poultry meat, there is no industry specific carbon footprint calculation tool available for the production phase of the poultry industry and since the poultry farmer only has control over the activities that take place on his farm, he can only make reductions of emissions at the farm-gate level. It is therefore important that a tool such as the PCFCT is available to deal with the farm level emissions.

The GHGs that are assessed are carbon dioxide, nitrous oxide and methane which are the gases of major concern in agriculture. The specific objectives of this study was to develop a computer-based, user-friendly calculation tool to assess greenhouse gas emissions from poultry farms and also to identify abatement strategies in on-farm management practices to reduce the footprint on farms. The user friendly PCFCT is an Excel spreadsheet into which the user will enter farm data to calculate the annual carbon footprint (Figure 1). The research included an assessment of the carbon footprint of test farms under industry management standards with focus placed on management practices and farm-expense data, particularly with regard to expenditures for energy-intensive inputs such as electricity and fuel which are the largest contributors to GHG emissions for poultry farms. This was used to identify potential areas of change.

The calculation tool was developed and then used to estimate the emissions from 30 test farms from three poultry companies in three different regions in Georgia.

What have we learned? 

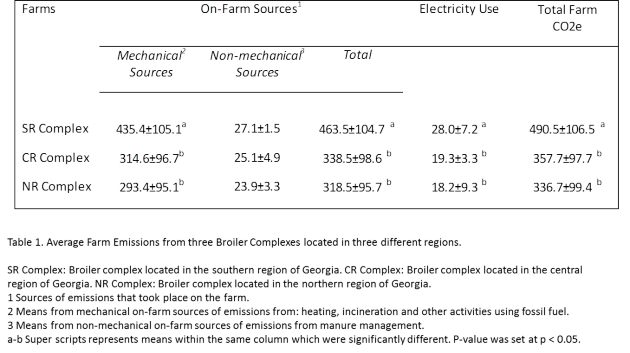
We observed that the major sources of greenhouse gas that are emitted on poultry production farms were from gas use and manure management. Based on these observations, the tool was then equipped to recommend improvements to the farm, which would in turn show the user potential reductions in GHG emissions and cost savings if the recommended improvements were implemented. The results from the study showed that there were significant differences in emissions from mechanical sources and electricity use between the southern region and the northern and central regions of the state (Table 1). The differences observed could be a result of; climatic differences, the dead bird disposal methods and also the duration of time the flock is kept on the farm.

Table 1. Average Farm Emissions from three Broiler Complexes located in three different regions.

The tool is also very useful for record keeping as it is designed with a printable inventory which will allow users to track and compare their emissions from year to year. It is also equipped with bar charts to show the user their current emissions compared to projected emissions if they apply the recommended changes. A second graph shows the percentage of emission from each source.

Future Plans    

The tool will be made available on the departmental website (uga.poultry.edu) for poultry producers, poultry company environmental personnel and extension personnel to utilize. Articles relevant to the subject will also be made available to users of the tool. Other future plans include incorporation of other segments of the industry (layer and turkey) into the tool.

Authors       

Claudia Dunkley, Ext. Poultry Scientist cdunkley@uga.edu

Brian Fairchild, Ext. Poultry Scientist, Casey Ritz, Ext. Poultry Scientist, Brian Kiepper, Ext. Poultry Scientist, John Worley, Ext. Engineer

Additional information                

www.poultry.uga.edu

C. S. Dunkley, University of Georgia, 2360 Rainwater Rd., Tifton, GA 31793-0478

Acknowledgements      

Funded by US Poultry & Egg Association

Figure 1. The PCFCT Interface page showing areas where farm data will be inputted, recommendations can be tried and an inventory showing the emissions and projections based on recommendations can be seen.

The authors are solely responsible for the content of these proceedings. The technical information does not necessarily reflect the official position of the sponsoring agencies or institutions represented by planning committee members, and inclusion and distribution herein does not constitute an endorsement of views expressed by the same. Printed materials included herein are not refereed publications. Citations should appear as follows. EXAMPLE: Authors. 2015. Title of presentation. Waste to Worth: Spreading Science and Solutions. Seattle, WA. March 31-April 3, 2015. URL of this page. Accessed on: today’s date.

Reducing the Costs and Environmental Footprint of Pig Diets with the Experimental Optimum Synthetic Amino Acid Inclusion


Why Look at Reducing Crude Protein in Pig Diets

Nitrogen (N2) compounds from swine feces and urine are oxidized and reduced by soil and air, whereas some N2 is released into the atmosphere as nitrous oxide (N2O). Research has demonstrated that reducing crude protein (CP) and maximizing synthetic amino acids (SAA) in swine diets can reduce N2 excretion. Thus, there is strong push for more sustainable production of soy or replacement with other protein sources.

The preliminary cost and environmental evaluation showed that pig diets with higher amounts of SAAs have higher cost, climate change impact (CCI), and water depletion (WD) than the typical US diet defined. This is due to the increased amounts of corn in a diet. Thus, a list of alternative energy and protein feed ingredients were tested in WUFFDA with the goal to replace corn and further reduce the amount of soybean meal in pig diets.

What did we do? 

Windows-based User Friendly Feed Formulation (WUFFDA) linear models were used to formulate single-objective least cost and least environmental footprint pig. Control diet is a typical soybean-corn formulation which was used as a baseline to evaluate cost and environmental footprint of an alternate diet. The test diet is a reduced crude protein diet with max 0.75% added Lysine-HCL in nursery and max 0.56 % added Lysine-HCL grower-finisher phases. We also added the US pig industry top 80 most used feed ingredients to the WUFFDA. Nutrient characteristics, inclusion limits, environmental footprint, and cost data for feed ingredients were obtained from the US Animal Feed Database and incorporated into WUFFDA models.

What have we learned? 

It was found that reduction in cost of a diet formulation can be achieved by omitting the use of milk whey powder (nursery phase). Replacing corn with wheat middlings could reduce cost and CCI. CCI can be reduced by use of corn gluten meal, and corn gluten feed (grow phases).

Future Plans 

The projected diets will be further investigated for nutrient constraints, validated through PPEC, and Simapro 8.1. life cycle assessment (LCA) model as well as with other experts such as nutritionists and economists. The projected diets will be will be available in the Pig Production Environmental Calculator (PPEC).

Authors

Jasmina Burek, Research Associate, University of Arkansas jburek@uark.edu

Greg Thoma, Jennie Popp, Charles Maxwell, Rick Ulrich

Additional information 

Pig Production Environmental Calculator:

http://www.pork.org/production-topics/environmental-sustainability-effor…

Life-Cycle Assessment Modeling for the Pork Industry:

https://lpelc.org/life-cycle-assessment-modeling-for-the-pork-industry

National Pork Board (2015) Carbon Footprint of Pork Production Calculator – Pork Checkoff.

Pesti G, Thomson E, Bakalli R, et al. (2004) Windows User-Friendly Feed Formulation (WUFFF DA) Version1.02.

PRé Consultants (2014) SimaPro 8.3. 4555022.

Acknowledgements

This research is part of the program “Climate Change Mitigation and Adaptation in Agriculture,” and is supported by Agriculture and Food Research Initiative Competitive Grant no. 2011-68002-30208 from the USDA National Institute of Food and Agriculture.

The authors are solely responsible for the content of these proceedings. The technical information does not necessarily reflect the official position of the sponsoring agencies or institutions represented by planning committee members, and inclusion and distribution herein does not constitute an endorsement of views expressed by the same. Printed materials included herein are not refereed publications. Citations should appear as follows. EXAMPLE: Authors. 2015. Title of presentation. Waste to Worth: Spreading Science and Solutions. Seattle, WA. March 31-April 3, 2015. URL of this page. Accessed on: today’s date.

Overwinter transformation and fate of fall-applied manure nitrogen

There is growing evidence that soil nutrient cycling is sustained during the non-growing season in the northern regions of Canada. However, the extent of the transformations and loss of fall-applied manure N is not well documented. The NH4-N fraction of liquid dairy cattle manure, liquid swine manure, and ammonium sulfate was enriched with 15N radioactive isotope, and all N sources were applied to bare sandy loams in early November at sites located in contrasted climate (mean annual temperature 1 to 10°C; mean annual precipitation 300 to 1300 mm; mean snow cover depth <5 to 70 cm). The experiment was replicated over two years at each site. Soils were sampled on the week of application, in November, and at intervals until next May. The recovery of applied 15N in soil NH4-N, NO3-N and organic N pools was measured in the 0-30 cm depth. Soil temperature was also monitored at the 5, 20 and 50 cm depths. Although the transformation of applied ammonium was delayed in colder areas, the transformation of 15NH4-N was generally completed by April, generally before seeding of the next crop. Both nitrification and immobilization of fall-applied 15NH4-N occurred throughout the non-growing season at all sites. As a result, residual 15N was essentially recovered as NO3-N and organic N in the following spring. In most cases, more than 50% of fall-applied 15N was not recovered in the following spring. In general, more 15NH4-N was immobilized with manures than ammonium sulfate, possibly because of the presence of fresh carbon in the manure. As a result, more 15N was recovered in the spring with the manure, and this was particularly obvious at the warmer sites. We conclude that a significant portion of fall-applied NH4-N may be lost during the non-growing season, even in areas with cold and long winter period.

Purpose

It is now recognized that biological processes involved in nitrogen (N) cycling are sustained in agricultural soils under frozen conditions (Clark et al., 2009; Maljanen et al., 2007; Virkajärvi et al., 2010), and that a significant portion of N present in soils in the fall may be transformed and lost during the non-growing season (Jayasundara et al., 2010; Chantigny et al., 2014). However, the extent to which fall-applied N fertilizer, and especially manure-N, can be lost as a function of local winter conditions (e.g. snow cover depth, frost penetration) is not known. Climate models are currently predicting that global warming will result in reduced snow fall, deeper frost penetration and more freeze-thaw cycles in soils of North America (Henry, 2008). This will have impacts on soil biological processes (Groffman et al., 2001), but it is not possible to predict how it may influence the fate of fall-applied N. Our objective was to use a multi-site approach to determine the extent of transformation and loss of fall-applied N during the non-growing season under contrasted winter conditions.

What did we do?

Pig slurry and dairy cattle slurry were enriched with 15N by adding a small amount of ammonium sulfate (99 atom% 15N). This approach allowed tracing of the readily available fraction of manure N (ammonia-N) in the soil N pools. Ammonium sulfate labelled at 5 atom% 15N was also included in the experiment as a no-carbon control treatment. The three treatments were applied to bare loamy soils (top 10 cm) in late fall (first week of November) at four sites located in different climatic zones of Canada: Pacific Maritimes [Mean annual temperature (MAT), 10.5°C; Mean annual precipitation (MAP), 1755 mm; average snow depth (ASD), < 1cm]; Prairies [MAT, 5.7°C; MAP, 383 mm; ASD, 3 cm]; Mixed Wood Plain [MAT, 6.3°C; MAP, 914 mm; ASD, 13 cm]; Boreal Shield [MAT, 4.2°C; MAP, 1213 mm; ASD, 44 cm]. The experiment was repeated in 2009-10 and 2010-11 at all sites. Soils were sampled to 30 cm depth on the week of application, and at intervals until early May to determine the amount of manure N recovered in the NH4, NO3 and organic (immobilized) N pools, as a function of time since application.

Overwinter transformation and fate of fall-applied manure nitrogen

What have we learned?

Fall-applied N was transformed and lost throughout the non-growing season at all sites (Fig. 1). Losses were rapid at the warmest site (Pacific Maritimes), and more gradual at the other sites where colder soil temperatures were recorded. Yet, six months after application (late April – early May) only 10 to 50% of fall-applied 15N was recovered in the top 30 cm of soil suggesting very significant loss of manure N during this period. Immobilization and nitrification of applied 15NH4 occurred throughout the non-growing season at all sites (data not shown), and 15N recovered in the next spring was essentially present as NO3 and organic N. At two sites, a greater proportion of applied 15N was recovered in the spring with the manures than ammonium sulfate, and more of this residual 15N was in the organic form in the manure treatments. This suggests that carbon present in the manure stimulated immobilization and retention of fall-applied N in soil. Overall, the results indicate that the readily available fraction of fall-applied N is at high risk of loss during winter, and that changes in soil conditions induced by global warming may not have a great influence on this process or on the manure-N transformation during winter.

References

Chantigny M.H., Angers D.A., Rochette P., Pomar C., Pelster D.E. 2014. Evidencing overwinter loss of residual organic and clay-fixed nitrogen from side-dressed, 15N-labelled pig slurry. Can. J. Soil Sci. 94:1-8.

Clark K., Chantigny M.H., Angers D.A., Rochette P., Parent L.E. 2009. Nitrogen transformations in cold and frozen agricultural soils following organic amendments. Soil Biol. Biochem. 41:348-356.

Groffman P.M., Driscoll C.T., Fahey T.J., Hardy J.P., Fitzhugh R.D., Tierney, G.L. 2001. Colder soils in a warmer world: A snow manipulation study in a northern hardwood forest ecosystem. Biogeochemistry 56, 135-150.

Henry, H.A.L. 2008. Climate change and soil freezing dynamics: Historical trends and projected changes. Climatic Change 87, 421-434.

Jayasundara, S., Wagner-Riddle, C., Parkin, G., Lauzon, J., Fan, M.Z. 2010. Transformations and losses of swine manure 15N as affected by aopplication timing at two contrasting sites.

Maljanen M., Kohonen, A.R., Virkajärvi P., Martikainen P.J. 2007. Fluxes and production of N2O, CO2 and CH4 in boreal agricultural soil during winter as affected by snow cover. Tellus, Series B: Chem. Phys. Meteor. 59, 853-859.

Virkajärvi P., Maljanen M., Saarijarvi K., Haapala J., Martikainen P.J. 2010. N2O emissions from boreal grass and grass-clover pasture soils. Agric. Ecosyst. Environ. 137, 59-67.

Future Plans

Now that we evidenced the significance of losses of fall-applied N from soils during the winter period under varied climatic conditions, we are initiating field work to determine best practices for fall application of manure (e.g. early vs. late fall application; use of additives to delay nitrification of manure ammonia) that will mitigate losses and help efficiently transferring applied N to crop in the next spring.

Corresponding author, title, and affiliation

Martin H. Chantigny, Soil Scientist, Agriculture and Agri-Food Canada, Quebec

Corresponding author email

martin.chantigny@agr.gc.ca

Other authors

Frank J. Larney, Agric. and Agri-Food Canada, Lethbridge; Shabtai Bittman, Agric. and Agri-Food Canada, Agassiz; David Lapen, Agric. and Agri-Food Canada, Ottawa; Denis A. Angers, Philippe Rochette, Agric. and Agri-Food Canada, Quebec

Additional information

Scientific papers and reports can be accessed through my webpage:  www.agr.gc.ca/fra/science-et-innovation/centres-de-recherche/quebec/centre-de-recherche-et-de-developpement-sur-les-sols-et-les-grandes-cultures/personnel-et-expertise-scientifiques/chantigny-martin-phd/?id=1181933396583

Acknowledgements

This project was financially supported by the Sustainable AGriculture Environmental Systems (SAGES) Initiative of Agriculture and Agri-Food Canada

The authors are solely responsible for the content of these proceedings. The technical information does not necessarily reflect the official position of the sponsoring agencies or institutions represented by planning committee members, and inclusion and distribution herein does not constitute an endorsement of views expressed by the same. Printed materials included herein are not refereed publications. Citations should appear as follows. EXAMPLE: Authors. 2015. Title of presentation. Waste to Worth: Spreading Science and Solutions. Seattle, WA. March 31-April 3, 2015. URL of this page. Accessed on: today’s date.

Feeding Strategies to Mitigate Cost and Environmental Footprint of Pig Production in the US

The livestock sector is one of main drivers of the environmental footprint. Animal feed is a key to sustainable meat production. Researchers are looking for environmentally sustainable feeding strategies that will lower diet cost, agricultural use of land, water depletion, and climate change impact. We used linear models to formulate 4 single-objective diets including least-cost, least-land use, least-water depletion, and least-climate change impact diets. Preliminary results showed that the use of wheat and wheat middlings hold potential to reduce pig diet cost and the environmental footprint.

Purpose

Demand for sustainable food, which conserves the environment and meets the needs of human development and increasing population, is growing (SCAR 2014). Livestock production is one of the major causes of the world’s environmental impacts including agricultural land use, water depletion, and climate change impact (PEW Commission on Industrial Farm Animal Production 2010). Feeding is the most important factor in livestock production cost and animal performance which includes growth, nutrition, health, sustainability, and productivity. Farmers are interested in producing animals with a better performance and need feeding strategies that will lower diet costs and conserve resource use (land and water). The objective of this study is to develop cost-effective diet formulations and mitigate the environmental footprint of pig production in the US.

What did we do?

Figure 1. Preliminary grow phase single-objective pig diets including typical US, least-cost, least-climate change impact, least-water depletion, and least-land use. Legend should be read left to right and top to bottom.

Figure 1. Preliminary grow phase single-objective pig diets including typical US, least-cost, least-climate change impact, least-water depletion, and least-land use. Legend should be read left to right and top to bottom.

Windows-based User Friendly Feed Formulation (WUFFDA) linear models are used to formulate single-objective pig diets including least-cost, least-water use, least-land use, and least-climate change impact diets (Figure 1) (Pesti et al. 2004). Models include typical feed ingredients and additional US pig industry top 50 used protein and energy feed ingredients (Table 1 and 2). Nutrient characteristics, inclusion limits, environmental footprint, and cost data for feed ingredients were obtained from the US Animal Feed Database  and incorporated into WUFFDA models (Burek et al. 2014). Theoretical diets are compared against typical US pig multi-phase diets which were obtained from a nutritionist (Figure 1).

Table 1. Typical feed ingredients in US pig diets.

Blood Plasma

L-Valine

Copper Sulfate

Milk, Lactose

Corn DDG

Milk, Whey Powder

Corn, Yellow Dent

Neo-Terramycin

Dicalcium Phosphate

Paylean

DL-Methionine

Potassium Sulfate

Ethoxiquin

Poultry By-Product

Fat (Poultry)

Ronozyme

Fish Meal

Sodium Chloride

Limestone, Ground

Soybean meal, 48%

L-Isoleucine

Trace Mineral Premix

L-Lysine-HCI

Vitamin premix

L-Threonine

Zinc Oxide

L-Tryptophan


Table 2. Top 50 protein and energy feed ingredients in US pig diets.

Alfalfa Meal

Oat Grains

Barley

Oyster Shell

Beet Pulp

Pea Protein Concentrate

Blood Meal Spray-Dried

Peas, Field Peas

Canola Meal, Expelled

Rice

Canola Oil

Rice Bran

Canola, Full Fat

Rice, Broken

Citrus Pulp

Rye

Corn Bran

Safflower Meal

Corn Gluten Feed

Sorghum

Corn Gluten Meal

Soy Protein Concentrate

Cotton Seed Meal

Soy Protein Isolate

Fat (A/V Blend)

Soybean Hulls

Fat (Beef Tallow)

Soybean Meal, 44%

Fat (Restaurant Grease)

Soybean Oil

Feather Meal

Soybean Seeds, Heat Processed

Flaxseed

Soybeans, High Protein, Full Fat

Flaxseed Meal

Sunflower Meal

Meat and Bone Meal

Sunflower, Full Fat

Milk, Casein

Wheat Bran

Milk, Whey Permeate

Wheat Middlings

Milk, Whey Protein Concentrate

Wheat Shorts

Molasses, Sugar Beets

Wheat, Hard Red

Molasses, Sugarcane

Wheat, Hard Red Winter

What have we learned?

The US producers use corn and soybean meal as a base for pig diets (Figure 1). The single-objective modeling shows that more sustainable and cost-effective diets can be formulated by diversifying protein and energy sources. For example, preliminary theoretical single-objective diets for one pig growing phase show that the use of wheat and wheat middlings may reduce multiple objectives (Figure 1). The least-cost diet includes wheat, sorghum, wheat middlings, and corn distillers grains (Figure 1). Wheat, wheat middlings, soybeans, soybean hulls, corn distillers grains are the main ingredients in the least-climate change impact diet (Figure 1). The least-water depletion diet includes wheat middlings, corn distillers grains, and canola meal (Figure 1). The least-land use includes corn distillers grains, wheat, rice bran, and corn gluten feed (Figure1). Theoretical diets serve as guidelines to develop realistic sustainable cost-effective pig diets that pig producers will be able to incorporate into their production system. 

Future Plans

The results presented in this manuscript are preliminary. Formulated diets will be analyzed using the Pig Environmental Calculator (PPEC) and Simapro 8.1 life cycle assessment (LCA) pig production model (PRé Consultants 2014; National Pork Board 2015). The PPEC calculates the actual amount of feeds and total costs (National Pork Board 2015). The Simapro 8.3 cradle-to-farm gate pig production life-cycle assessment model calculates environmental impacts of pig production (PRé Consultants 2014).

Animal feed availability, pig production practices, and environmental footprints vary for pig production regions in the US. Feed costs are dynamic including costs and geography. The intention is to develop pig diets for different pig production regions in the US. Thus, further research will focus on multi-objective analyses to evaluate potential to reduce simultaneously cost and environmental footprints under different constraints. We will verify results with nutritionists, economists, and other experts. The pig producers will have access to formulated diets through PPEC.

Authors

Jasmina Burek, Research Associate, University of Arkansas jburek@uark.edu

Greg Thoma, Jennie Popp, Charles Maxwell, Rick Ulrich

Additional information

Pig Production Environmental Calculator
Life-Cycle Assessment Modeling for the Pork Industry

References

Burek J, Thoma G, Popp J, et al. (2014) Developing Environmental Footprint, Cost, and Nutrient Database of US Animal Feed Ingredients.

National Pork Board (2015) Carbon Footprint of Pork Production Calculator – Pork Checkoff.

PEW Commission on Industrial Farm Animal Production (2010) Environmental Impact of Industrial Farm Animal Production.

PRé Consultants (2014) SimaPro 8.3.

SCAR (2014) Sustainable food. http://ec.europa.eu/environment/eussd/food.htm.

Acknowledgements

This research is part of the program “Climate Change Mitigation and Adaptation in Agriculture,” and is supported by Agriculture and Food Research Initiative Competitive Grant no. 2011-68002-30208 from the USDA National Institute of Food and Agriculture.

The authors are solely responsible for the content of these proceedings. The technical information does not necessarily reflect the official position of the sponsoring agencies or institutions represented by planning committee members, and inclusion and distribution herein does not constitute an endorsement of views expressed by the same. Printed materials included herein are not refereed publications. Citations should appear as follows. EXAMPLE: Authors. 2015. Title of presentation. Waste to Worth: Spreading Science and Solutions. Seattle, WA. March 31-April 3, 2015. URL of this page. Accessed on: today’s date.

Environmental Footprint, Cost, and Nutrient Database of the US Animal Feed Ingredients


Poster presentation BurekWhy Look at Feed Ingredients and Environmental Footprint?

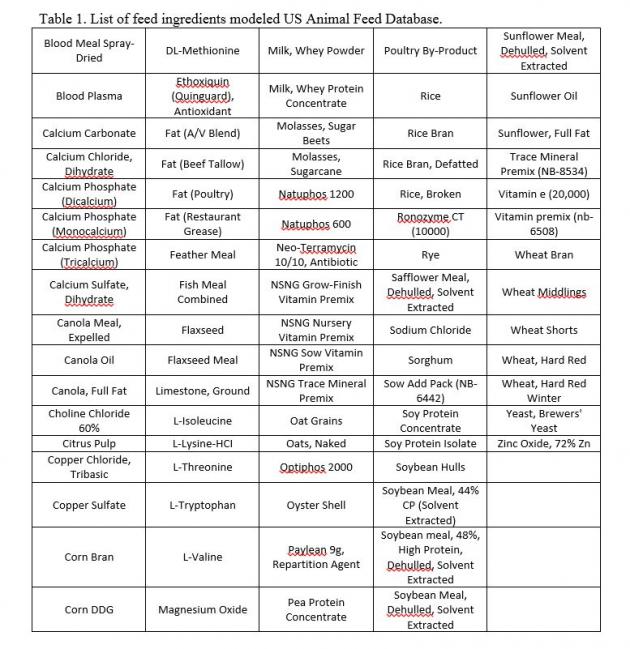
The US Pig Production Environmental Calculator (PPEC) was built upon cradle-to-farm-gate life-cycle assessment (LCA) of pork production combined with the US National Resource Council (NRC 2012) swine nutrient requirements models (NRC 2012), farm operation inputs, and animal feed database. The purpose of the US Animal Feed Database is to compile environmental, economic, and nutrient content of animal feed ingredients in a single location and integrate it into a PPEC economic model of swine operations. (Click on image at right to view a handout of the poster).

What did we do?

We collected data from different sources including NRC (2012) feed nutrient characteristics, Feedstuffs (2014) for feed prices, US agricultural and product LCA models built in SimaPro 7.3.3 (PRé Consultants 2011) and LCA databases (Swiss Centre for Life Cycle Inventories 2010; EarthShift 2011; Blonk Consultants 2014) for environmental footprints. Table 1 shows a list of top US pig feed ingredients.

What have we learned?

list in us databaseFeed ingredients with highest costs are additives (e.g. paylean) and amino acids. Milk by-products have the largest climate change impact, water and land use.

Future Plans

The information from this database will be used as a starting point for identifying potential mitigation options in pig diet formulation. The database will be updated as new information becomes available.

Authors

Jasmina Burek, Research Associate, University of Arkansas jburek@uark.edu

Greg Thoma, Jennie Popp, Charles Maxwell, Rick Ulrich

Additional information

National Pork Board (2015) Carbon Footprint of Pork Production Calculator – Pork Checkoff.
Pesti G, Thomson E, Bakalli R, et al. (2004) Windows User-Friendly Feed Formulation (WUFFF DA) Version1.02.
PRé Consultants (2014) SimaPro 8.3. 4555022.

Pig Production Environmental Calculator
Life-Cycle Assessment Modeling for the Pork Industry

Acknowledgements

This research is part of the program “Climate Change Mitigation and Adaptation in Agriculture,” and is supported by Agriculture and Food Research Initiative Competitive Grant no. 2011-68002-30208 from the USDA National Institute of Food and Agriculture.

The authors are solely responsible for the content of these proceedings. The technical information does not necessarily reflect the official position of the sponsoring agencies or institutions represented by planning committee members, and inclusion and distribution herein does not constitute an endorsement of views expressed by the same. Printed materials included herein are not refereed publications. Citations should appear as follows. EXAMPLE: Authors. 2015. Title of presentation. Waste to Worth: Spreading Science and Solutions. Seattle, WA. March 31-April 3, 2015. URL of this page. Accessed on: today’s date.