Validation of Near-Infrared Reflectance Spectral Data for Analyzing Horse Manure

Can Near-Infrared Reflectance Spectroscopy (NIRS) Be Used For Analyzing Horse Manure?

Increased horse numbers and insufficient acreage limit the ability for on-farm use of horse manure. Nearly 58% of surveyed farmers in NJ indicate that some manure was disposed off-farm while only 54% spread any manure on the farm (Westendorf et al., 2010). Analysis of manure by Near-Infrared Reflectance Spectroscopy (NIRS) could be a useful means of determining nutrient and energy content without time consuming efforts of wet chemistry and other laboratory analyses if horse manure is used as a fertilizer or energy source. The NIRS analysis works by subjecting samples to a concentrated light of a known spectrum and measuring the absorbance of the reflected beam (Dyer and Feng, 1997). Covalent chemical bonds of the common organic elements (Carbon, Nitrogen, Oxygen and Hydrogen) have strong absorbance in the NIRS region, useful because there is a correlation between absorbance and concentration (Malley et al., 2002). By comparing data between samples generated by NIRS to laboratory analysis of the same samples, NIRS equipment can be calibrated for practical use. The objectives of this project were: 1) determine the nutrient content and value of horse manure, and make NIRS calibrations based on previously determined wet chemistry values, and 2) determine if ash or Neutral Detergent Fiber (NDF) content can be used to predict Gross Energy (GE) levels.

What did we do?

Horse manure consisting of 123 solid dry stack manure samples, were collected from 30 NJ farms over four seasons during a 12-month period in 2008-2009. Samples were collected from various random locations in a manure pile in ~ 4 l sealable plastic bags, frozen, and stored until analysis. All samples were dried at 55o C to a constant weight in a Thermocore® oven. Following drying, all samples were ground to a particle size of 5-10 mm in a Waring® industrial blender, referred to as Coarse ground samples. Samples were sent to DairyOne Laboratories in Ithaca, NY and analyzed for manure components (Total-N, P2O5, K2O, NDF, and GE); samples were analyzed for Ash by the Rutgers University Soil Testing Laboratory. Coarse ground samples were further ground in a coffee grinder to a particle size between 2-3 mm (these samples are referred to as Fine ground samples). All NIRS analysis of Coarse and Fine ground samples were made with a Unit y Scientific Spectrastar ™ 2400 Drawer model (Brookfield, CT). Samples were scanned at 1nm intervals over the wavelength range of 1250-2350 nm, as prescribed by Unity Scientific. Data from the DairyOne Laboratory results were used as reference values to develop calibrations using the Ucal™ software package (Unity Scientific, Brookfield, CT) set at default values using a partial linear squares statistical model.

What have we learned?

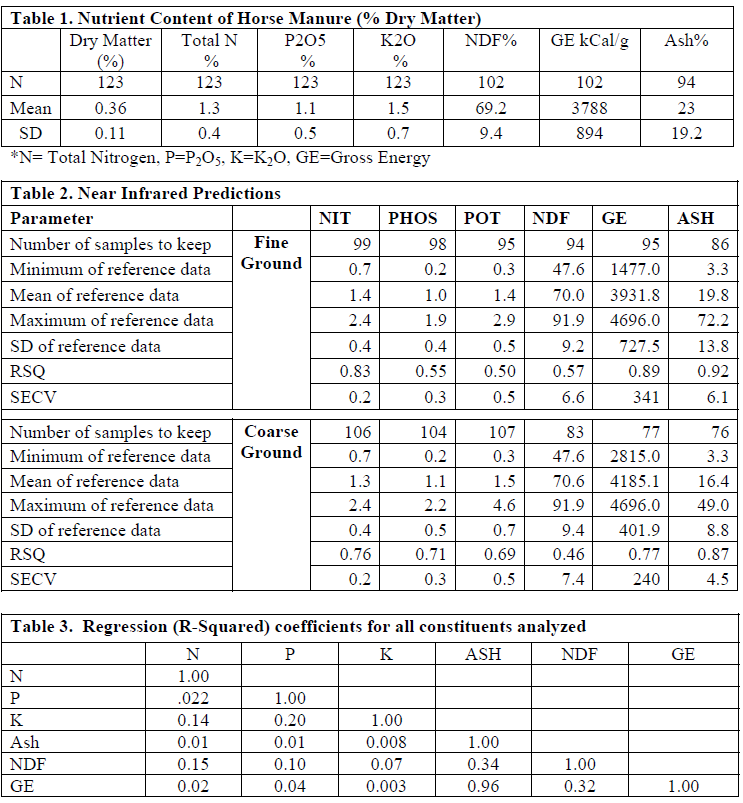
On a dry matter basis (Table 1) samples averaged 1.3% N, 1.1% P2O5, 1.5% K2O, 69.2% NDF, 3800 kCal/g GE, and 24% Ash. The NIRS equations (Table 2) for Coarse (5-10 mm) ground horse manure predicted nutrient content, R-squared values of 0.76, 0.71, 0.69, 0.46, 0.77, and 0.87 for N, P2O5, K2O, NDF, GE, and Ash, respectively. The NIRS also predicted Fine (2-4 mm) ground horse manure R-squared values of 0.83, 0.55, 0.50, 0.57, 0.89, and 0.92 for N, P2O5, K2O, NDF, GE, and Ash, respectively. Ash, GE and NDF were regressed to determine how effectively Ash and NDF would predict GE (Table 3); NDF was a poor predictor of GE content (R-squared of 0.32), while Ash was a good predictor (R-squared of 0.96).

Future Plans

This research suggests that NIRS can be useful for predicting nutrient content of horse manure and that Ash is a good predictor of energy content. A comparative field trial on horse farms is planned for follow-up.

Authors

Michael L. Westendorf. Extension Specialist in Animal Science. Rutgers, the State University of New Jersey westendorf@aesop.rutgers.edu

Zane R. Helsel. Extension Specialist in Plant Biology and Pathology. Rutgers, the State University of New Jersey.

Additional information

Author Contact Information:

Michael Westendorf

Rutgers, The State University of New Jersey

84 Lipman Drive

New Brunswick, NJ 08901

Phone: 848-932-9408

e-mail: westendorf@aesop.rutgers.edu

Reference:

Dyer, D. J. and P. Feng. 1997. NIR Destined to be Major Analytical Influence. Feedstuffs Magazine. November 10, 1997.

Malley, D.F., Yesmin, L., and Eilers, R. G. 2002. Rapid Analysis of Hog Manure and Manure- amended Soils Using Near-infrared Spectroscopy. Soil Science Society of America Journal. 2002. 1677-1686.

Westendorf, M. L., T. Joshua, S. J. Komar, C. Williams, and R. Govindasamy. 2010. Manure Management Practices on New Jersey Equine Farms. Prof. Anim. Sci. 26:123-129.

Acknowledgements

Supported in part by the State Equine Initiative. Rutgers Equine Science Center. New Jersey Agricultural Experiment Station.

The authors are solely responsible for the content of these proceedings. The technical information does not necessarily reflect the official position of the sponsoring agencies or institutions represented by planning committee members, and inclusion and distribution herein does not constitute an endorsement of views expressed by the same. Printed materials included herein are not refereed publications. Citations should appear as follows. EXAMPLE: Authors. 2015. Title of presentation. Waste to Worth: Spreading Science and Solutions. Seattle, WA. March 31-April 3, 2015. URL of this page. Accessed on: today’s date.

Equine Pasture Management Introduction


Purpose*

Sound grazing management strategies for horses have beneficial impacts on horse health, the environment, and the overall cost of keeping horses. This presentation explains how the fundamental principles of horse grazing behavior, horse nutrient requirements, plant chemical composition, and plant physiology are integrated in the development of sound grazing management strategies.

Why Is Pasture Management Important for Horse Operations?

Horses graze continuously and are capable of relatively large nutrient intakes in comparison with their requirements. This “wastage” of pasture nutrients has negative implications on both the cost of feeding horses and horse health. Mature horses, grazing pasture continually, consume on average 2.5% of their body weight in dry matter (DM) per day (range 1.5 to 3%). Therefore a 500 kg horse consumes approximately 12.5 kg DM/d. This level of DM intake represents a significant proportion of a horse’s daily caloric requirements.

Digestible energy (DE) content of grass pasture can range from 1.78 to 2.74 Mcal/kg DM (mean ± S.D., 2.26 ± 0.48 Mcals/kg DM; n = 6959; Dairy One, 2011). Therefore a mature 500 kg horse consuming 12.5 kg DM/d from pasture consumes 28.85 Mcals DE/d, which is 11.58 Mcals greater than required (16.67 Mcals/d). A DE intake of 20 Mcal above maintenance DE is required per kg of BW gain and an increase in 1 body condition score unit requires approximately 18 kg of body weight gain (NRC, 2007).

Given these assumptions the horse in this example would gain just under 1 body condition score unit per month, provided adequate pasture was available. The excess DE intake, and related pasture intake, in the above example is equivalent to approximately 0.7 of a grazing day (i.e., the horse consumes enough DE in 1 d to last 1.7 d). This scenario demonstrates that in some instances continuous grazing regimes, where intake is uncontrolled, can lead to excessive nutrient intake resulting in wasted resources, and contribute negatively to equine health (i.e., excess body condition). Therefore strategies that control and/or account for pasture DM intake should be implemented.

One strategy that can be used to control pasture intake is restricting the amount of time a horse has access to pasture. Restricting pasture access is accomplished by placing horses in dry-lots or by use of a grazing muzzle. It should be noted that horses may still be able to consume a significant amount of forage while wearing a grazing muzzle in place, depending on whether forage is prostrate or erect. Therefore, placing horses in a dry-lot for part of the day may be a more effective practice.

The daily amount of time allowed for grazing in order to match nutrient intake with nutrient requirements (e.g., caloric intake vs caloric requirement) varies with a horse’s physiological state. Mature idle horses, horses at light work (e.g., ridden 2 to 3 times per week), mares in early gestation (less than 5 months), breeding stallions in the non-breeding season can consume their daily DE requirement in 8 to 10 h of grazing well managed pasture (i.e., > 90% ground cover maintained at a height of > 15 cm) during the seasons where pasture is actively growing. Horses having other physiological states can graze the entire day, as pasture intake alone will not likely provide all required nutrients due to their relatively high requirements.

Horses graze selectively, given the choice, which can negatively impact a plant’s ability to re-grow and ultimately to persist. Horses tend to avoid grazing extremely mature pasture grasses, particularly those areas that are used as latrines. When areas of mature pasture grass are avoided horses concentrate grazing on less mature areas undergoing re-growth. Uneven grazing patterns can also result from horses over-grazing preferred forage in pastures that contain multiple plant species.

Horses show considerable preference toward some species (e.g, Kentucky bluegrass) as compared to others (e.g., tall fescue). The net result of uneven grazing is two-fold, wasted forage in one area and over-grazing in others. Prevention of uneven grazing and its consequences can be achieved by rotational grazing. Rotational grazing strategies allocate an area of pasture containing an amount of dry matter that will last a given number of horses 1 to 7 days and then horses are moved to a new area. This strategy forces horses to graze more uniformly.

The allocation process used in rotational grazing can also be used to limit intake to an amount that provides only the daily requirement thus preventing the problem of excessive pasture nutrient intake, such as that illustrated in the previous paragraph.

A sound grazing management plan manages grazing behavior in manner that attempts to match nutrient intake with nutrient requirements while simultaneously minimizing selective grazing and over grazing.

Authors

Paul Siciliano is a Professor of Equine Management and Nutrition in the Department of Animal Science at North Carolina State University where he teaches courses in equine management and conducts research dealing with grazing management of horses. Paul_Siciliano@ncsu.edu

Additional information

Chavez, S.J., P.D. Siciliano and G.B. Huntington. 2014. Intake estimation of horses grazing tall fescue (Lolium arundinaceum) or fed tall fescue hay. Journal of Animal Science. 92:p.2304–2308.

Bott, R.C., Greene, E.A., Koch, K., Martinson, K.L., Siciliano, P.D., Williams, C., Trottier, N.L., Burke, A., Swinker, A. 2013. Production and environmental implications of equine grazing. J. Equine Vet. Sci. 33(12):1031-1043.

Glunk, E.C., Pratt-Phillips, SE and Siciliano, P.D. 2013. Effect of restricted pasture access on pasture dry matter intake rate, dietary energy intake and fecal pH in horses. J. of Equine Vet. Sci. 33(6):421-426.

Dowler, L.E., Siciliano, P.D., Pratt-Phillips, S.E., and Poore, M. 2012. Determination of pasture dry matter intake rates in different seasons and their application in grazing management. J. Equine Vet. Sci. 32(2):85-92.

Siciliano, P.D. and S. Schmitt. 2012. Effect of restricted grazing on hindgut pH and fluid balance. J. Equine Vet. Sci. 32(9):558-561.

Siciliano, P.D. 2012. Estimation of pasture dry matter intake and its practical application in grazing management for horses. Page 9-12 in Proc. 10th Mid-Atlantic Nutrition Conference. N.G. Zimmermann ed., Timonium, MA, March 2012.

The authors are solely responsible for the content of these proceedings. The technical information does not necessarily reflect the official position of the sponsoring agencies or institutions represented by planning committee members, and inclusion and distribution herein does not constitute an endorsement of views expressed by the same. Printed materials included herein are not refereed publications. Citations should appear as follows. EXAMPLE: Authors. 2015. Title of presentation. Waste to Worth: Spreading Science and Solutions. Seattle, WA. March 31-April 3, 2015. URL of this page. Accessed on: today’s date.

Effect of Grazing Cell Size on Horse Pasture Utilization


Purpose *

Horses grazing continuously within a single pasture often graze selectively resulting in under- and over-grazed areas. The net result is inefficient use of forage and/or eventually loss of ground cover. This practice contributes negatively to pasture health and the environment. Rotational grazing can alleviate this problem by forcing horses to be less selective due to constraints on space and time allowed for grazing. It is generally accepted that grazing cells should be sized to provide enough forage for no more than 7 d in order to prevent selective grazing. However, little information is available to definitively confirm this maximum residence time. If the residence time could be increased to greater than 7 d by increasing the size of the grazing cell without the occurrence of selective grazing then labor inputs associated with reconstructing fences and moving horses could be reduced. A reduction in labor might also contribute to an increased acceptance of this practice among horse owners and managers. Therefore a study was designed to compare effect of increasing residence time by increasing grazing cell size on the level of grazing uniformity.

What did we do? 

A predominately tall fescue pasture (approximately 1.5 ha; Lolium arundinaceum Schreb cultivar Max-Q; Pennington Seed, Madison, GA) was divided into four equal sub-plots (approximately 0.37 ha). Eight mature geldings (approximately 500 kg; 9.75 ± 4.4 yr) were paired and randomly assigned to one of two grazing regimes within subplots as follows to determine the effect of residence time and grazing cell size on pasture characteristics reflecting uniformity of grazing: 1) single large grazing cell (SLGC) where horses had access to the entire 0.37 ha subplot for 21-d, or 2) multiple small grazing cells (MSGC) where horses had access to approximately one-third (0.123 ha) of the 0.37 ha subplot for 7 d and were then moved to the next adjacent one-third of the subplot every 7-d for a total of 21-d. Subplot size was estimated to contain enough DM to support DM intake of 2.4% of BW/d for 21 d assuming a grazing efficiency of 0.7. Pasture herbage mass, sward height, compressed sward height and percent ground cover were determined on d-0 and d-21within each sub-plot. The percent compressed sward height below 5 cm within each subplot was used as an estimate of “over-grazed” area. Response variables were analyzed as a repeated measures design for treatment, time and treatment x time interactions. A P-value of 0.05 was considered significant; whereas a P-value of 0.1 was considered a tendency.

What have we learned? 

Pasture herbage mass, sward height, compressed sward height and percent ground cover were not affected by treatment or treatment time interactions. Pasture herbage mass tended to decrease over time (P = 0.08). Sward height and compressed sward height decreased over time (P < 0.05). Percentage of compressed sward height below 5 cm tended to increase at a greater rate within MSGC as compared to SLGC (P = 0.07). Results of this study suggest that sizing grazing cells for longer residence times is feasible and that sizing grazing cells for a shorter residence time requires more management to insure overgrazing does not occur.

Future Plans    

Although the results of this study suggests that two horses can graze a 0.37 ha area containing enough dry matter to facilitate 2.4% of BW intake (assuming a grazing efficiency of 0.7); it is unknown how increasing the stocking rate (and related grazing cell size) will affect uniformity of grazing. Future experiments will investigate this question.

Authors      

Paul D. Siciliano, Professor, Dept. of Animal Science, North Carolina State University Paul_Siciliano@ncsu.edu

Jennifer Gill, Department of Animal Science, North Carolina State University

Additional information               

Bott, R.C., Greene, E.A., Koch, K., Martinson, K.L., Siciliano, P.D., Williams, C., Trottier, N.L., Burke, A., Swinker, A. 2013. Production and environmental implications of equine grazing. J. Equine Vet. Sci. 33(12):1031-1043.

Acknowledgements      

This project was supported by the North Carolina Agricultural Research Service.

The authors are solely responsible for the content of these proceedings. The technical information does not necessarily reflect the official position of the sponsoring agencies or institutions represented by planning committee members, and inclusion and distribution herein does not constitute an endorsement of views expressed by the same. Printed materials included herein are not refereed publications. Citations should appear as follows. EXAMPLE: Authors. 2015. Title of presentation. Waste to Worth: Spreading Science and Solutions. Seattle, WA. March 31-April 3, 2015. URL of this page. Accessed on: today’s date.

Removing Phosphorus from Drainage Water: The Phosphorus Removal Structure

Purpose

To illustrate a case study design and construction of a phosphorus removal structure on a poultry farm, and to present the basics of how to properly design a structure.

What did we do?

We constructed a phosphorus (P) removal structure on a poultry farm in Eastern OK; this is a BMP that can remove dissolved P loading in the short term until soil legacy P concentrations decrease below levels of environmental concern. A P removal structure contains P sorbing materials (PSMs) and are placed in a location to intercept runoff or subsurface drainage with high dissolved P concentrations. As high P water flows through the PSMs, dissolved P is sorbed onto the materials by several potential mechanisms, allowing low P water to exit the structure. While they vary in form, P removal structures contain three main elements: 1) use of a filter material that has a high affinity for P, 2) containment of the material, and 3) the ability to remove that material and replace it after it becomes saturated with P and is no longer effective.

A site was identified which met all criteria for justification of construction of a P removal structure: 1) elevated dissolved P concentrations in runoff (>0.2 ppm), 2) hydraulic connectivity between the runoff/drainage produced and a surface water body, and 3) flow convergence: the site possessed potential to channel the runoff water to a single point in order to treat the water. This site was located on a poultry farm in Eastern OK.
The site was surveyed in order to obtain the necessary inputs for properly designing the P removal structure. This involved a basic NRCS survey to estimate watershed size, peak flow rates, and average annual runoff volume. In addition, several runoff grab samples were taken and analyzed for dissolved P. This information was used to determine the average annual dissolved P load, which was 45 lbs.

Knowing flow and P load parameters, we additionally chose P removal targets and desired lifetime of the structure. We chose to design a structure that would remove 20 lbs of dissolved P during the first year and be able to handle 700arial site view and map gpm flow rate. Several hypothetical designs were made based on the available P sorbing materials (PSMs), such as drinking water treatment residuals, acid mine residuals, and gypsum. We chose to use a treated steel slag material as the PSM in the structure; this required about 35 tons of material.

After construction, the performance of the structure was monitored by measuring flow rates and dissolved P concentrations at the inlet and outlet. In addition, we developed software to aid in proper design of a site specific P removal structure using any PSM, in order to meet desired P removal goals and lifetime. Alternatively, this software can be used to predict the performance and lifetime of a P removal structure that has been already constructed. Licensing of software is available for private industry.

completed p removal structure
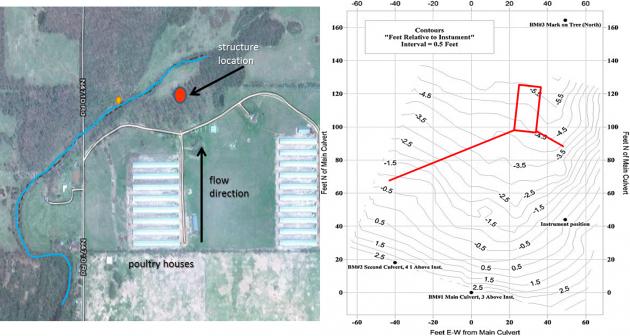
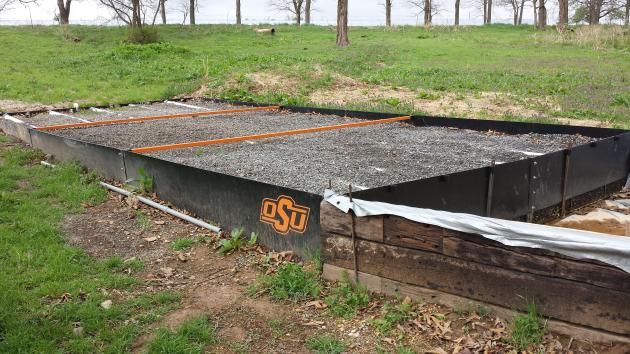
We constructed a P removal structure on a poultry farm in Eastern OK; this is a BMP that can remove dissolved P loading in the short term until soil legacy P concentrations decrease below levels of environmental concern. A P removal structure contains P sorbing materials (PSMs) and are placed in a location to intercept runoff or subsurface drainage with high dissolved P concentrations. As high P water flows through the PSMs, dissolved P is sorbed onto the materials by several potential mechanisms, allowing low P water to exit the structure. While they vary in form, P removal structures contain three main elements: 1) use of a filter material that has a high affinity for P, 2) containment of the material, and 3) the ability to remove that material and replace it after it becomes saturated with P and is no longer effective.

A site was identified which met all criteria for justification of construction of a P removal structure: 1) elevated dissolved P concentrations in runoff (>0.2 ppm), 2) hydraulic connectivity between the runoff/drainage produced and a surface water body, and 3) flow convergence: the site possessed potential to channel the runoff water to a single point in order to treat the water. This site was located on a poultry farm in Eastern OK.

The site was surveyed in order to obtain the necessary inputs for properly designing the P removal structure. This involved a basic NRCS survey to estimate watershed size, peak flow rates, and average annual runoff volume. In addition, several runoff grab samples were taken and analyzed for dissolved P. This information was used to determine the average annual dissolved P load, which was 45 lbs.

Knowing flow and P load parameters, we additionally chose P removal targets and desired lifetime of the structure. We chose to design a structure that would remove 20 lbs of dissolved P during the first year and be able to handle 700 gpm flow rate. Several hypothetical designs were made based on the available P sorbing materials (PSMs), such as drinking water treatment residuals, acid mine residuals, and gypsum. We chose to use a treated steel slag material as the PSM in the structure; this required about 35 tons of material.

After construction, the performance of the structure was monitored by measuring flow rates and dissolved P concentrations at the inlet and outlet. In addition, we developed software to aid in proper design of a site specific P removal structure using any PSM, in order to meet desired P removal goals and lifetime. Alternatively, this software can be used to predict the performance and lifetime of a P removal structure that has been already constructed. Licensing of software is available for private industry.

What have we learned?

p removal performance
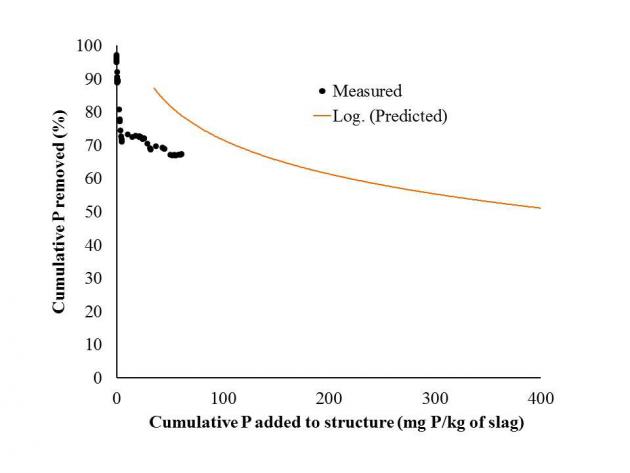
The P removal structure has removed approximately 67% of all dissolved P that has flowed into it over a 16-month time period. In addition, it has handled all flow volume from every event, including a runoff event that resulted in 600 gpm. That single event delivered 2/3 lb of dissolved P, in which the structure removed 66%. While the structure is removing P as predicted based on P loading, the structure has greatly outlasted the goal of removing 45% of cumulative dissolved P in one year. This is due to the below average rainfall received over the last two years.

We also learned about the potential positives and negatives of using certain PSMs. For example, although we could have used other PSMs, in much smaller quantities (2-10 tons) that would remove equal amounts of P, we would have had to build a structure that was much larger in surface area, due to the fact that the hydraulic conductivity of these PSMs is relatively low. It is also possible to build these structures with other materials for the frame, such as concrete, earth, or wood. Structures can be constructed in ditches or potentially in the subsurface to treat tile drainage.

Last, we have some sense of economics for P removal structures and the general cost of P removal compared to other BMPs.

Future Plans

phrog design softwareWe will continue to monitor the structure. In addition, we are cooperating with several people throughout the US in helping to design P removal structures. We are also releasing design software for licensing in an attempt to promote commercialization of this BMP through private industry. A NRCS standard is currently underway and the goal is for this BMP to become cost-shared. Last, we are continuing to investigate the economics of P removal structure over a large scale area.

Authors

Chad Penn, Associate professor of agricultural and environmental chemistry, Oklahoma State University chad.penn@okstate.edu

Josh Payne, Animal waste specialist, Oklahoma State University; James Bowen, graduate assistant; Stuart Wilson, senior research specialist, Oklahoma State University; Josh McGrath, associate professor of nutrient management, University of Kentucky

Additional information

Chad Penn; chad.penn@okstate.edu; 405 744 2746

www.p-structure.blogspot.com

http://www.jswconline.org/content/69/2/51A.full.pdf

http://pods.dasnr.okstate.edu/docushare/dsweb/Get/Document-9345/L-447%20Phosphorus%20Removal.pdf

Acknowledgements

NRCS for funding of this demonstration

The authors are solely responsible for the content of these proceedings. The technical information does not necessarily reflect the official position of the sponsoring agencies or institutions represented by planning committee members, and inclusion and distribution herein does not constitute an endorsement of views expressed by the same. Printed materials included herein are not refereed publications. Citations should appear as follows. EXAMPLE: Authors. 2015. Title of presentation. Waste to Worth: Spreading Science and Solutions. Seattle, WA. March 31-April 3, 2015. URL of this page. Accessed on: today’s date.

Rotational Grazing Effects on Pasture Nutrient Content


Why Look at Rotations Grazing in Horse Pastures?

Rotational grazing is a recommended strategy to improve pasture health and animal performance. Previous studies have reported improved forage quality in rotationally grazed pastures compared to those continuously grazed by cattle, but data are limited for horse pastures.

What did we do?

A study at the University of Tennessee was conducted to evaluate the effects of rotational grazing on the nutrient content of horse pastures. A 2.02 ha rotational grazing pasture (RG) and a 2.02 ha continuous grazing pasture (CG) were each grazed by three adult horses at a stocking rate of 0.6 ha/horse over a two year period. The RG system was divided into four 0.40 ha paddocks and a heavy use area. Pastures were maintained at uniform maximum height of 15 to 20 cm by mowing. Horses were rotated between the RG paddocks every 10 to 14 d, or when forage was grazed to a height of approximately 8 cm. Pasture forage samples (n = 520) were collected and composited monthly (n = 14) during the growing season (April to November) by clipping forage from randomly placed 0.25 m2 quadrates from RG and CG, as well as before and after grazing each RG paddock. Botanical composition and percent ground cover were visually assessed. Forage samples were oven dried at 60°C in a forced air oven for 72 h to determine DM. Forage biomass yield (kg/ha), digestible energy (DE, Mcal/kg), crude protein (CP), acid detergent fiber (ADF), neutral detergent fiber (NDF), lignin, calcium (Ca), phosphorous (P), potassium (K), magnesium (Mg), ash, fat, water soluble carbohydrates (WSC), sugar and fructan were measured using a FOSS 6500 near-infrared spectrometer. Data were analyzed using paired T-tests and differences were determined to be significant at P < 0.05. Data are reported as means ± SEM as a percent of DM.

What have we learned?

Table 1. Nutrient content of continuously grazed (CG) pasture and rotationally grazed (RG) pasture. Data are summarized as means ± SE.
Nutrient Continuous Rotational
DM, % 91.72 ± 0.36 91.89 ± 0.34
DE, Mcal/kg 2.31 ± 0.064 2.42± 0.039*
CP, % 14.92 ± 0.77 15.79 ± 0.64
ADF, % 33.16 ± 1.21 30.81 ± 0.82*
NDF, % 56.80 ± 1.75 53.53 ± 1.65*
Lignin, % 3.47 ± 0.38 2.88 ± 0.32*
Ca, % 0.69 ± 0.11 0.68 ± 0.11
P, % 0.25 ± 0.009 0.27 ± 0.008*
K, % 1.92 ± 0.10 2.11 ± 0.087*
Mg, % 0.25 ± 0.009 0.26 ± 0.007
Ash, % 9.35 ± 0.83 9.39 ± 0.66
Fat, % 2.65 ± 0.12 2.83 ± 0.08
WSC, % 4.95 ± 0.60 6.72 ± 0.71*
Sugar, % 3.33 ± 0.50 4.86 ± 0.55*
Fructan, % 1.61 ± 0.15 1.59 ± 0.16
*means within rows differ; P < 0.05

Forage biomass yield did not differ between RG and CG (2,125 ± 52.2; 2,267 ± 72.4 kg/ha, respectively). The percentage of grass species was greater in RG compared to CG (81.7 ± 3.9; 73.9 ± 4.5, respectively) and the percentage of weed species was lower in RG compared to CG (3.4 ± 0.8; 12.0 ± 1.5, respectively). Tall fescue, kentucky bluegrass, bermudagrass and white clover were the dominant forage species. Rotational grazing increased forage quality compared to continuous grazing. The RG system was higher in DE (Mcal/kg), phosphorous (P), potassium (K), water soluble carbohydrates (WSC), and sugar compared to the CG system (Table 1). While there wasn’t a significant difference in crude protein (CP) content between RG and CG, the numerical difference could potentially affect animal performance. The RG pasture was lower in acid detergent fiber (ADF), neutral detergent fiber (NDF) and lignin compared to the CG pasture. Within the RG pasture, forage nutrient content declined following a grazing period, but recovered with rest. Paddocks were lower in DE, CP, P, K, Fat, WSC and sugar while they were higher in ADF and NDF after grazing compared to before grazing (Table 2).

Table 2. Nutrient content of rotational grazing (RG) paddocks before and after grazing. Data are summarized as means ± SE.
Nutrient Before After
DM, % 91.84 ± 0.27 91.84 ± 0.39
DE, Mcal/kg 2.34 ± 0.03 2.21 ± 0.02*
CP, % 14.98 ± 0.39 13.71 ± 0.43*
ADF, % 32.24 ± 0.54 34.33 ± 0.48*
NDF, % 55.97 ± 0.88 59.24 ± 0.89*
Lignin, % 2.79 ± 0.20 3.41 ± 0.25*
Ca, % 0.58 ± 0.05 0.59 ± 0.05
P, % 0.28 ± 0.004 0.25 ± 0.006*
K, % 2.11 ± 0.08 1.72 ± 0.07*
Mg, % 0.26 ± 0.007 0.26 ± 0.009
Ash, % 8.76 ± 0.19 8.79 ± 0.21
Fat, % 2.64 ± 0.05 2.45 ± 0.06*
WSC, % 6.05 ± 0.47 4.85 ± 0.39*
Sugar, % 4.40 ± 0.38 3.22 ± 0.30*
Fructan, % 1.67 ± 0.15 1.69 ± 0.16
*means within rows differ; P < 0.05

Future Plans

Rotational grazing may be a preferred alternative to continuous grazing as it favors grass production, suppresses weeds and increases energy and nutrient content of pastures. While rotational grazing may be beneficial from an environmental and animal production standpoint, an increase in DE and WSC may pose a risk for horses prone to obesity and metabolic dysfunction. Appropriate precautions should be taken in managing at risk horses under rotational grazing systems. This work is being continued at Virginia Tech and other universities to further understand the use of rotational grazing systems for horses.

Authors

Bridgett McIntosh, Equine Extension Specialist, Virginia Tech bmcintosh@vt.edu

Matt Webb, Ashton Daniel, David McIntosh and Joe David Plunk, University of Tennessee

Additional information

http://www.arec.vaes.vt.edu/middleburg/

Acknowledgements

The authors thank the University of Tennessee Middle Tennessee Research and Education Center and the Tennessee Department of Agriculture’s Nonpoint Source Pollution 319 Water Quality Grant for their support of this project.

The authors are solely responsible for the content of these proceedings. The technical information does not necessarily reflect the official position of the sponsoring agencies or institutions represented by planning committee members, and inclusion and distribution herein does not constitute an endorsement of views expressed by the same. Printed materials included herein are not refereed publications. Citations should appear as follows. EXAMPLE: Authors. 2015. Title of presentation. Waste to Worth: Spreading Science and Solutions. Seattle, WA. March 31-April 3, 2015. URL of this page. Accessed on: today’s date.

Thermal-Chemical Conversion of Animal Manures – Another Tool for the Toolbox


How Can Thermo-Chemical Technologies Assist in Nutrient Management?

Livestock operations continue to expand and concentrate in certain parts of the country. This has created regional “hot spot” areas in which excess nutrients, particularly phosphorus, are produced. This nutrient issue has resulted in water quality concerns across the country and even lead to the necessity of a “watershed diet” for the Chesapeake Bay Watershed. To help address this nutrient concern some livestock producers are looking to manure gasification and other thermo-chemical processes. There are several thermo-chemical conversion configurations, and the one chosen for a particular livestock operation is dependent on the desired application and final by-products. Through these thermo-chemical processes manure Factory processingvolumes are significantly reduced. With the nutrients being concentrated, they are more easily handled and can be transported from areas of high nutrient loads to regions of low nutrient loads at a lower cost. This practice can also help to reduce the on-farm energy costs by providing supplemental energy and/or heat. Additional benefits include pathogen destruction and odor reduction. This presentation will provide an overview of several Conservation Innovation Grants (CIG) and other manure thermo-chemical conversion projects that are being demonstrated and/or in commercial operation. Information will cover nutrient fate, emission studies, by-product applications along with some of the positives and negatives related to thermo-chemical conversion systems.

Exterior of factory processingWhat did we do? 

Several farm-scale manure-to-energy demonstration projects are underway within the Chesapeake Bay Watershed. Many of these receive funding through the USDA-NRCS Conservation Innovation Grant program. These projects, located on poultry farms, are being evaluated for the performance of on-farm thermal conversion technologies. Monitoring data is being collected for each project which includes: technical performance, operation and maintenance, air emissions, and by-product uses and potential markets. Performance of manure gasification systems for non-poultry operations have also been reviewed and evaluated. A clearinghouse website for thermal manure-to-energy processes has been developed.

What have we learned? 

The projects have shown that poultry litter can be used as a fuel source, but operation and maintenance issues can impact the performance and longevity of a thermal conversion system. These systems are still in the early stages of commercialization and modifications are likely as lessons are learned. Preliminary air emission data shows that most of the nitrogen in the poultry litter is converted to a non-reactive form. The other primary nutrients, phosphorus and potassium, are preserved in the ash or biochar co-products. Plant availability of nutrients in the ash or biochar varies between the different thermal conversion processes and ranges from 80 to 100 percent. The significant volume reduction and nutrient concentration show that thermal conversion processes can be effective in reducing water quality issues by lowering transportation and land application costs of excess manure phosphorus.

Future Plans    

Monitoring will continue for the existing demonstration projects. Based on the lessons learned, additional demonstration sites will be pursued. As more manure-to-energy systems come on-line the clearinghouse will be updated. Based on data collected, NRCS conservation practice standards will be generated or updated as necessary.

Author       

Jeffrey P. Porter, PE, Manure Management Team Leader, USDA-Natural Resources Conservation Service jeffrey.porter@gnb.usda.gov

Additional information                

Thermal manure-to-energy clearinghouse website: http://lpelc.org/thermal-manure-to-energy-systems-for-farms/

Environmental Finance Center review of financing options for on-farm manure-to-energy including cost share funding contact information in the Chesapeake Bay region: http://efc.umd.edu/assets/m2e_ft_9-11-12_edited.pdf

Sustainable Chesapeake: http://www.susches.org

Farm Pilot Project Coordination: http://www.fppcinc.org

National Fish and Wildlife Foundation, Chesapeake Bay Stewardship Fund: http://www.nfwf.org/chesapeake/Pages/home.aspx

Acknowledgements

National Fish and Wildlife Foundation, Chesapeake Bay Funders Network, Farm Pilot Project Coordination, Inc., Sustainable Chesapeake, Flintrock Farm, Mark Weaver Farm, Mark Rohrer Farm, Riverview Farm, Wayne Combustion, Enginuity Energy, Coaltec Energy, Agricultural Waste Solutions, University of Maryland Center for Environmental Science, Environmental Finance Center, Virginia Cooperative Extension, Lancaster County Conservation District, Virginia Tech Eastern Shore Agricultural Research and Extension Center, Eastern Shore Resource Conservation and Development Council, with funding from the USDA Conservation Innovation Grant Program and the U.S. EPA Innovative Nutrient and Sediment Reduction Program.

The authors are solely responsible for the content of these proceedings. The technical information does not necessarily reflect the official position of the sponsoring agencies or institutions represented by planning committee members, and inclusion and distribution herein does not constitute an endorsement of views expressed by the same. Printed materials included herein are not refereed publications. Citations should appear as follows. EXAMPLE: Authors. 2015. Title of presentation. Waste to Worth: Spreading Science and Solutions. Seattle, WA. March 31-April 3, 2015. URL of this page. Accessed on: today’s date.

Using Solar Power to Provide Animals with Water while Protecting Water Quality


Why Consider Solar Power for Watering Livestock?

The purpose of this paper and presentation is to show how we have been using solar powered watering stations to provide a clean water supply to livestock while also protecting water resources. The project was started as a way to assist farmers who had received funding from some federal or state agencies to improve water quality on and through their land. One way to improve water quality is to fence livestock out of local waterbodies. As a result of this practice, the farmer may lose the ability to water his/her livestock.  A secondary reason for the project was, since livestock did not have direct access to water, the farmer had to either carry water to the watering stations or use some form of energy (diesel, gasoline, electric) to provided needed water.

What did we do?

To help solve the problem, funding was received from USDA-NRCS through the Conservation Innovation Grant Program (CIG) to install solar powered livestock watering stations. Farmers were selected based on information from NRCs field personnel, County Extension Agents and other groups working with farmers to fence livestock out of the waterbodies. The first steps were to visit with the farmers to determine need for a solar powered watering station.

Through a first set of questions, it was determined: 1) if the farmer needed the watering station; 2) where the watering station would be located; 3) was there an existing well and pump and what was the source of energy?;  4) what would be the preferred energy source based on available electricity; and 5) would there be a solar system that could be designed to meet the need of the farmer (an initial design).

To further discuss these steps, we looked to see if the farmer needed the watering station. Was there was a means to put in a limited access watering spot so water was still available on a limited basis and still help with protecting water quality? The location of the watering station was determined based on plans to rotationally graze the pasture where the livestock would be located. If the livestock were to be rotated through a number of different paddocks, the suggestion would be to locate the watering station in the center of a rotation. Alternatively, could a solar powered pumping system be located in one place and pump water to various watering stations on the property? The third aspect of the initial planning process was to determine if there was an existing well or pump. If there was an existing well and pump, what was the source of power for the pump? If diesel or gasoline was being used, what was the cost of such a system on an annual basis? The next aspect asked if there was available electric power for a pump? If the answer was “Yes, there is power less than one-quarter mile” then it was suggested the farmer consult with the local power utility to determine the cost of running power to the proposed pumping location. Another aspect of this step in the process was where would the water source be and would solar even be viable due to shade or tree cover? The last aspect of the determination of using solar power was the ability of us to design a system based on the number of livestock that had or needed to be watered and the depth of the well (if currently in place), expected depth to groundwater, height from a surface water source to highest and most distant watering station, and distance of having to run pipe from water source to most distant watering station. If after going through all of these aspects with the farmer, it was determined that a solar powered watering system was a good option for the farmer, we worked with him or her to fully design a solar powered watering system, ordered the solar components and helped the farmer install the system.

What have we learned?

From this project we have learned that there are some locations that are not good for a solar powered watering systems due to location, distance to available power and economics. Most of the times when the system was determined to be non-economical, it was due to there being electric power within a short distance of the proposed solar installation site. Short distance here is defined as any distance that makes running electricity to the proposed water source location economically preferable to that of installing solar power. Sometimes location was not a good fit in that there was very little open space to install a solar powered system for pumping the water. Another thing we have learned is that the solar powered system needs to be protected or at least in a location where livestock cannot get to the panels and control boxes. In cases where small livestock are being watered, having the solar panels on poles above their height can be beneficial in providing maintenance for grass control. However, for larger livestock, the support structure and solar panels themselves can become scratching posts which can result in broken solar panels. One other thing we have learned is that based on the needs or direction of the local NRCS working groups, solar powered watering systems may or may not be included in the cost share options for farmers.

Future Plans  

Future plans are to work with County Extension Agents, NRCS, farmers and other groups promoting the use of solar powered systems for watering livestock in areas where this technology can protect water quality.

Author     

Gary L. Hawkins, Water Resource Management and policy Specialist and Assistant Professor, University of Georgia, Crop and Soil Science ghawkins@uga.edu

Additional information                

For more information please contact ghawkins@uga.edu

Sun-powered water source. Angus Journal. July 2013. Anderson, B.B.

Acknowledgements     

Thanks to Mr. Gary Murphy for his assistance in installing and demonstrating the solar system in many different venues. Thanks also is extended to USDA-NRCS for funding the projects through the CIG program.

The authors are solely responsible for the content of these proceedings. The technical information does not necessarily reflect the official position of the sponsoring agencies or institutions represented by planning committee members, and inclusion and distribution herein does not constitute an endorsement of views expressed by the same. Printed materials included herein are not refereed publications. Citations should appear as follows. EXAMPLE: Authors. 2015. Title of presentation. Waste to Worth: Spreading Science and Solutions. Seattle, WA. March 31-April 3, 2015. URL of this page. Accessed on: today’s date.

Composting and the Benefits: Achieving Practice Change through Education to Reduce Nutrient Loads and Increase Adoption of Best Management Practices

Purpose

Florida houses roughly 500,000 horses and is also home to 700 freshwater springs; Marion County is, “Horse Capital of the World” and houses two first magnitude springs and each is currently in a restoration plan with the Florida Department Environmental Protection Agency (FDEP). The Florida Department of Agriculture and Consumer Services (FDACS) equine Best Management Practices (BMP) Manual recommends composting as an excellent manure management option.

Composting is a controlled biological process that decomposes and heats up organic material to produce a biologically stable humus, which can then be used as a rich soil amendment. Composting provides protection to the ground and surface waters by preventing excess nutrients from being leached out and running-off into the waters. It destroys up to 90% of weed seeds contained in manure and kills parasite eggs and pathogens. Additionally, the organic matter/compost helps prevent and control soil erosion and can improve both soil quality and productivity.

Compost Bin SetupWhat did we do?

Individual and group programming has been developed to educate farm owners and managers about the benefits derived from composting horse manure/spent bedding. Since 2007, Over 800 farms have been seen in the county. In 2013 alone, 132 participants were involved in individual farm consultations or farm revisits, group presentations and composting workshops. Education was provided and supplemental materials were developed for clientele about composting manure, compost bin construction and composting’s soil-improvement capabilities. Compost Countryside

What have we learned?

Pre and post-test results showed a 62% (82 of 132 total participants) knowledge gain from information taught. A total of 71% (n=12 of 17 farm revisit consultations) of farms revisited improved and adopted recommended manure handling practices after receiving education. Additionally, seven farms and facilities have begun cost-share planning with Southwest Florida Water Management District (SWFWMD) for compost bin construction. Results/impacts show improved management practices and a greater understanding of BMPs, allowing for a decrease in nutrient levels to the ground and surface waters. Pictures show sample bins which were constructed as a result of individual and group programming.

an example of a concrete manure storage areaFuture Plans

Continued group and individual programming needs to be continued, in partnership with trade journal articles being written about manure management, protection of the ground and surface waters and the benefits derived from composting manure/bedding. Cost-share dollars, coming from state organizations, will further incentivize farms to construct and use compost facilities as part of a regular manure management plan.

example of lattice compost storage areaAuthor

Jamie Cohen, Farm Outreach Coordinator, UF/IFAS Extension Marion County jamiecohen@ufl.edu

Additional information

My eXtension.org Manure Management Strategies Webcast:  https://connect.msu.edu/p8yko9zhhoq/?launcher=false&fcsContent=true&pbMode=normal

eXtension.org –Manure Management page:  https://lpelc.org/horse-manure-management/

A Guide to Composting Horse Manure:  www.whatcom.wsu.edu/ag/compost/horsecompost.htm

The authors are solely responsible for the content of these proceedings. The technical information does not necessarily reflect the official position of the sponsoring agencies or institutions represented by planning committee members, and inclusion and distribution herein does not constitute an endorsement of views expressed by the same. Printed materials included herein are not refereed publications. Citations should appear as follows. EXAMPLE: Authors. 2015. Title of presentation. Waste to Worth: Spreading Science and Solutions. Seattle, WA. March 31-April 3, 2015. URL of this page. Accessed on: today’s date.

An NE-1441 Project: Proposed Methodologies for Administering a Multi-State Environmental Best Management Practices Survey of Equine Properties


*Purpose 

Several states have reported that equine are the fastest growing segment of the livestock industry. Nationwide, equine has increased by 77% since 1997; and it is reported there are approximately 9.5 million horses in the United States (AHC, 2005). Proper management of equine operations requires the adoption of Best Management Practices (BMPs) to balance nutrient production and prevent erosion. Government agencies are concerned about non-point sources of water pollution and have focused on agriculture, including equine operations, as a major contributor to water quality issues. Many states’ laws have regulated equine farms, requiring farm managers to incorporate BMPs. The objectives of this proposed national (multi-state) survey are to quantify and assess the use of the equine industry’s BMPs in pasture management, erosion control and to examine potential environmental impacts. Few state studies have investigated horse BMPs in the U.S, and more research is needed to assess the effect of horse farm management on U.S. water quality. Knowledge of the current scope and nature of equine industry management practices are important when developing regulations, laws, and educational programs to enhance the stewardship and govern land management on equine operations.

What did we do? 

The methodology to assess horse property manager/owner practices consists of gathering a minimum of 150-2,000 names and email addresses of horse owners/farm managers from the 15 states involved in the NE-1441 project. Some of the N. E. states have fewer equine operations. An email containing survey information and a link to the 40 question online survey will be sent to horse farm managers in 2016. Three follow-up reminders will be sent to non-responding addresses. It is hoped to have a 40% response rate. Data will analyzed using SPSS 16.0 (SPSS Inc., Chicago, IL) for descriptive statistics, determining response frequencies and percentages.

The Questionnaire Instrument will include the following areas:

Part I General: Involved in the horse industry? Are you the owner or manager of a horse operation? If No, then you are finished taking the survey. Business or Hobby?

Part II Demographics: Location, State, County, Survey participants gender, age, Size of farm total acreage, Confinement areas, Pasture areas, primary and 2nd use of operation, Highest average number of horses on property? On average, how many hours per day do your horses spend grazing pastures by seasons?

Part III Horse Pasture Management Rotational Grazing, unlimited access,Pasture Management Plan, Agricultural Erosion and Sedimentation Plan weed control and type, mowing, resting pastures,Sacrifice lots, pasture topography, surface water, Sheds and barns,divert runoff, roof gutters.

Part IV: Horse Pasture Applications and/or Evaluation: Line, Fertilizer, Herbicide use, Seeding practices, Lime, Soil testing.

Part V: Horse Manure Management: Nutrient Management Plan, primary manure management, collection, storage, uses, removal.

Part VI: Conclusion: What are your limitations in altering the management of your horse operation? What information resources do you use for your equine farm operations?

What have we learned? 

The questions for an equine related APHIS/USDA animal agriculture survey need to be more specific to the activities and needs of the horse industry. Whereas most animal agriculture operations do not deal directly with the general public as a necessary component of their business plan, the horse industry depends on active and engaged clientele. If we are able to gather national data through a single effort survey, the resulting information could be compared and sorted in a consistent and statistically reliable manner, allowing educational materials and opportunities to be tailored to area or regional needs.

Future Plans 

A survey will be conducted by the NE-1441 (a northeast regional Hatch research group focusing on environmental impacts of equine operations) participating states to determine the use of the following best management practices: managed storage area, composted manure storage, stream crossings, buffers and vegetative filter strips, heavy use pads and sacrifice areas, soil testing, and fertility management on fields receiving manure. Develop means of determining the impact of equine outreach programs, more specifically determination of BMP adoption rate.This will allow us to chart progress among producers who use extension services and/or implement BMPs with the assistance of extension or other service providers such as NRCS, state departments of agriculture, and etc. We will work with social scientists to determine adoption rates, what the reasons for resistance to adoption are, and how to develop programs to overcome this resistance.

Corresponding author, title, and affiliation 

Betsy Greene, Professor/Equine Extension Specialist, University of Vermont

Corresponding author email 

betsy.greene@uvm.edu

Other authors

Ann Swinker, Extension, Pennsylvania State University Amy Burk, Extension, University of Maryland Rebecca Bott, Extension, South Dakota State University Carey Williams, Extension, Rutgers, State University of New Jersey

Additional information 

Westendorf, M. L., T. Joshua, S. J. Komar, C. Williams, and R. Govindasamy. 2010. Manure Management Practices on New Jersey Equine Farms. Prof. Anim. Sci. 26:123-129.

Swinker, A., S. Worobey, H. McKernan, R. Meinen, D. Kniffen, D. Foulk, M. Hall, J. Weld, F. Schneider, A. Burk, M. Brubaker, 2013, Profile of the Equine Industry’s Environmental, Best Management Practices and Variations in Pennsylvania, J. of NACAA. 6:1, 2158-9429.

Fiorellino, N.M., K.M. Wilson, and A.O. Burk. 2013. Characterizing the use of environmentally friendly pasture management practices by horse farm operators in Maryland. J. Soil Water Conserv. 68:34-40.

Acknowledgements

The State University Extension Equine Specialists that make up the NE-1441: Environmental Impacts of Equine Operations, Multi-State Program. USDA.

The authors are solely responsible for the content of these proceedings. The technical information does not necessarily reflect the official position of the sponsoring agencies or institutions represented by planning committee members, and inclusion and distribution herein does not constitute an endorsement of views expressed by the same. Printed materials included herein are not refereed publications. Citations should appear as follows. EXAMPLE: Authors. 2015. Title of presentation. Waste to Worth: Spreading Science and Solutions. Seattle, WA. March 31-April 3, 2015. URL of this page. Accessed on: today’s date.

Case Study of Contaminated Compost: Collaborations Between Vermont Extension and the Agency of Agriculture to Mitigate Damage Due to Persistent Herbicide Residues

Why Study Herbicide Contamination of Compost?

Picloram, clopyralid, aminopyralid and aminocyclopyrochlor are broadleaf herbicides commonly used in pastures due to effectiveness in controlling undesirable plants and the very low toxicity for animals and fish. In fact, some of these herbicides do not require animal removal post application. The grazing animals can ingest treated leaves with no ill health effects, but may pass the herbicides through to the manure. Also see: Composting Livestock or Poultry Manure

When a complaint driven problem of damaged tomatoes and other garden crops in Vermont was traced back to a single compost provider in Chittenden County in Vermont, a series of actions and reactions commenced. Complaints were fielded and investigated by personnel from the Vermont Agency of Agriculture, Food and Markets (VT-AG) and the University of Vermont Extension (UVM-EXT). The compost provider sent samples of various components of the compost to a single laboratory and received positive results for persistent herbicides in sources of equine bedding/manure components. Subsequent interviews by the facility manager in both print and television media seemed to cast blame on Vermont equine operations for ruining Vermont gardens. Coincidentally, the composter had recently changed compost-processing methods. Initial samples sent to a separate laboratory did not support the composter’s laboratory results. Samples of feed, manure, shavings, and many other components which were shipped to several laboratories by VT-AG, resulted in extremely inconsistent and/or contradictory data between laboratories running the exact same samples.

Related: Small Farm Environmental Stewardship or Managing Manure on Horse Farms

What did we do? 

Several processes were underway by several agencies in a coordinated and collaborative effort to resolve and mitigate the herbicide issues:

• Vermont Agency of Agriculture, Food and Markets was receiving and investigating complaints.

• University of Vermont Extension plant biology personnel were identifying, documenting, and sampling affected plants, as well as counseling gardeners.

• University of Vermont equine extension worked with horse owners and media to mitigate unsubstantiated claims of “horses poisoning garden plants”.

• A more thorough investigation by VT-AG involved collection of raw samples (feed, hay, shavings, manure) from 15 horse farms who utilized the compost facility to dispose of manure and bedding.

• The VT Secretary of Agriculture and the VT-AG Agri-chemical Management Section Chief were brought together with equine and compost experts attending the NE-1041 Equine Environmental Extension Research group annual meeting hosted by UVM equine extension.

• VT-AG worked with herbicide manufacturers to use high quality testing equipment and procedures to gather consistent data from samples.

What have we learned? 

More extensive details of this particular case have been published in the Journal of NACAA (http://www.nacaa.com/journal/index.php?jid=201).

• The levels of persistent herbicides were low enough that they were below the acceptable limits for water, yet they still harmed sensitive garden plants.

• Nationally and locally manufactured grains tested positive for persistent herbicides; most likely due to the individual components being treated within legal limits during field production.

• Many of the laboratories were unable to provide accurate or consistent results when testing for the persistent herbicides.

• Discussions between the NE-1041 group and VT-AG resulted in a fruitful exchange of information, as well as development and delivery of pertinent information for the general public and County Agricultural Agents.

Future Plans 

Several proactive activities have already been initiated and/or completed. A peer reviewed case study on all aspects of the contaminated compost has been published in the Journal of NACAA; and two episodes of Vermont’s Agricultural television show (Across the Fence) were created to educate and update the general public on the situation. A Vermont compost working group has been assembled and set goals to create potential educational materials including a horse owner pamphlet (in final editing phase), a farmer/livestock pamphlet, and press releases for the public education on challenges with persistent herbicides. The VT-AG website has a Compost FAQs page addressing the most common questions associated with compost and herbicides.

Authors

Betsy Greene, Professor/Extension Equine Specialist, University of Vermont Betsy.Greene@uvm.edu

Carey Giguere, Agrichemical Management,Vermont Agency of Agriculture

Rebecca. Bott, Extension, South Dakota State University

Krishona. Martinson, Extension, University of Minnesota

Ann Swinker, Extension, Penn State University

Additional information

• Greene, E.A., R.C. Bott, C. Giguere, K.L. Martinson, and A.W. Swinker. 2013. “Vermont Horses vs. Twisted Tomatoes: A Compost Case Study. J of NACAA. 6:1 (http://www.nacaa.com/journal/index.php?jid=201)

• Vermont Agency of Agriculture, Food and Markets Compost FAQ’s: http://agriculture.vermont.gov/node/696

• Davis, J. Dept. of Horticultural Science, NC State University. 2010. Herbicides in Manure: How Does It Get there and why Should I Care?, Proceedings 8th Annual Mid-Atlantic Nutrition Conference, Timonium, MD. pp 155-160.

• Across the Fence Television Show: An Update on Green Mountain Compost Contamination and Testing-Greene/ Gigliuere (9/14/12)

• Across the Fence Television Show: Information from NE 1041 Meetings and National Equine Specialists-Greene (9/17/12)

• Article from Minnesota Extension explaining the problem in hay and how to avoid it. The article is devoted to “ditch hay”, but the information is relevant to all hay. https://extension.umn.edu/horse-nutrition/managing-herbicides-ditch-forages

• Washington State University Web site on clopyralid carryover includes pictures of affected vegetables, research results, and the bioassay protocol http://www.puyallup.wsu.edu/soilmgmt/Clopyralid.htm

• Dow Agrosciences United Kingdom website with information on aminopyralid: http://www.manurematters.co.uk/

• CDMS Agro-chemical database with access to all the herbicide labels: http://www.cdms.net/LabelsMsds/LMDefault.aspx?t

Acknowledgements

The State University Extension Equine Specialists that make up the NE-1441: Environmental Impacts of Equine Operations, Multi-State Program. USDA.

The authors are solely responsible for the content of these proceedings. The technical information does not necessarily reflect the official position of the sponsoring agencies or institutions represented by planning committee members, and inclusion and distribution herein does not constitute an endorsement of views expressed by the same. Printed materials included herein are not refereed publications. Citations should appear as follows. EXAMPLE: Authors. 2015. Title of presentation. Waste to Worth: Spreading Science and Solutions. Seattle, WA. March 31-April 3, 2015. URL of this page. Accessed on: today’s date.