This presentation will review the existing multi-species literature on nutrient cycling and how it is affected by the horse’s diet and rotational grazing.
Grazed pastures, particularly rotationally grazed pastures, recycle nutrients faster than ungrazed pastures. Nutrients on pasture land enter through animal waste, and waste feed or fertilizer; they leave through removal of forage, leaching/runoff, or animal product/waste removal. Taking away the animal component removes about half of the inputs needed to recycle the nutrients. Dietary nitrogen (N), phosphorus (P) and potassium (K) are required for basic maintenance of horses; however, not all of what is consumed is used by the animal, therefore the dietary concentrations of these nutrients will impact the nutrient cycling. Digestibility of N, P and K in horses is approximately 80, 25 and 75 %, respectively. What does not get digested will end up excreted back into the soil.
What did we do?
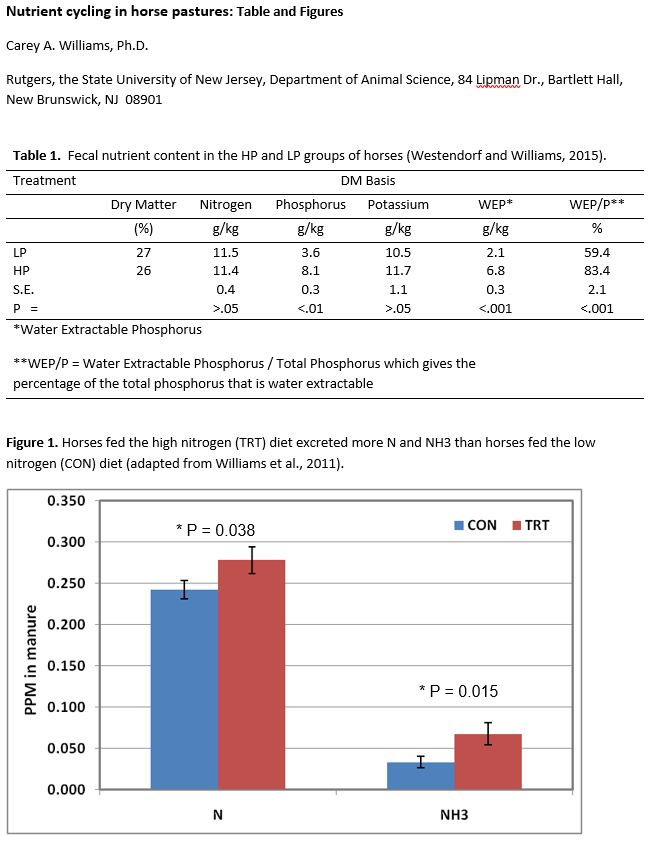
For example, in one study eight Standardbred mares were divided into two groups and received diets of grass hay and grain. The high P (HP) group received 142 g/d of NaH2PO4, formulated to provide 4.5-times the dietary P requirement, or 65 g phosphorus/d. The low P (LP) group received 28 g of phosphorus/d in the basal diet. Data showed that horses receiving the HP diet excreted higher P and water extractable P in the manure than those fed the LP diet (Table 1; Westendorf and Williams, 2015). The same goes for N, where one study used a treatment group that was supplemented with 700 g/d of soybean meal top dressed on 500 g of sweet feed per day (TRT; 1042 g protein/d DM total), while the control group received the sweet feed meals without the soybean meal (CON; 703 g protein/d total). Both groups were also fed 8 kg/d of a grass hay mix (562 g protein /d DM), water and salt ad libitum. Horses fed the TRT diet excreted more N and NH3 than horses fed the CON diet (Figure 1; Williams et al., 2011).
What have we learned?
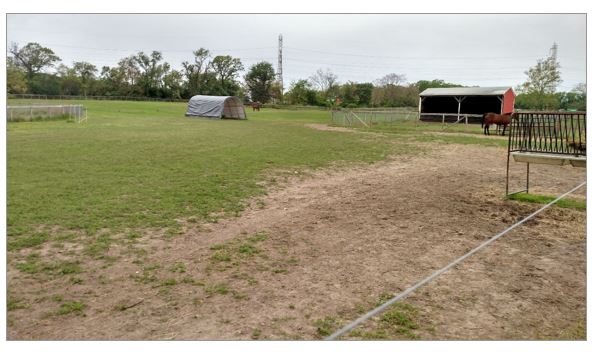
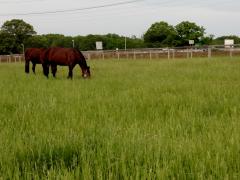
More intensive grazing also creates an increased rate of nutrient cycling due to the added animal inputs on the land. Even though no horse related studies have been performed on this topic studies in cattle have found that plant-available N levels doubled when cattle were rotationally grazed with five grazings per season instead of three (Baron et al., 2002). Kenny (2016) looked at horses grazed under either a continuous or rotational grazing system (see Pictures 1 and 2, Left to Right, respectively) and found no differences in system after one year of grazing, however, the author concludes that more time on the system could have generated differences.
Other factors that affect the rate of nutrient cycling include amount of legumes in the pasture, distribution of manure on pastures (i.e. relation to water, shelters and fencing), and use or rates of fertilizer.
Future Plans
More equine specific studies need to be performed looking at how grazing systems and equine diets affect nutrient cycling and how horse farm owners can utilize this to best manage their farm for optimal nutrient utilization.
Corresponding author, title, and affiliation
Carey A. Williams, Equine Extension Specialist, Rutgers, the State University of New Jersey, Department of Animal Science
Baron, V. S., E. Mapfumo, A. C. Dick, M. A. Naeth, E. K. Okine, and D. S. Chanasyk. 2002. Grazing intensity impacts on pasture carbon and nitrogen flow. J. Range Manage. 55:525-541.
Kenny, L. B. 2016. The Effects of Rotational and Continuous Grazing on Horses, Pasture Condition, and Soil Properties. Master thesis, Rutgers, the State University of New Jersey, New Brunswick, NJ.
Westendorf, M. L., and C. A. Williams. 2015. Effects of excess dietary phosphorus on fecal phosphorus excretion and water extractable phosphorus in horses. J. Equine Vet. Sci. 35:495-498. doi:10.1016/j.jevs.2015.01.020
Williams, C. A., C. Urban, and M. L. Westendorf. 2011. Dietary protein affects nitrogen and ammonia excretion in horses. J. Equine Vet. Sci. 31:305-306.
The authors are solely responsible for the content of these proceedings. The technical information does not necessarily reflect the official position of the sponsoring agencies or institutions represented by planning committee members, and inclusion and distribution herein does not constitute an endorsement of views expressed by the same. Printed materials included herein are not refereed publications. Citations should appear as follows. EXAMPLE: Authors. 2017. Title of presentation. Waste to Worth: Spreading Science and Solutions. Cary, NC. April 18-21, 2017. URL of this page. Accessed on: today’s date.
In Pennsylvania there has been an increased emphasis on farm and nutrient management practices on equine operations due to expansion of environmental regulations. Of the 31,000 operations which house horses in Pennsylvania, 23,250 are non-commercial operations and over 75 percent are on limited acreage, requiring intensive management. Managers of equine operations frequently do not have agricultural backgrounds and need assistance with farm management plans. Proper management of equine operations requires a series of complementing Best Management Practices (BMPs) that implement strategies to preserve pasture vegetative cover, to balance nutrient production with nutrient utilization, to properly manage excess manure nutrients, and to manage equine operations for minimal release of sediment.
This environmental program was developed to identify needed BMPs for the equine industry and help farm mangers understand, select, and implement sustainable farm management practices. The program consisted of three components: Documentation of existing practices and conditions on equine operations, educational outreach to increase knowledge and skills, and on-farm implementation of BMPs. These three projects covering 2009-2015, measured sediment and nutrient losses, for high density horse operations; and recorded environmentally sound farm management practices.
What did we do?
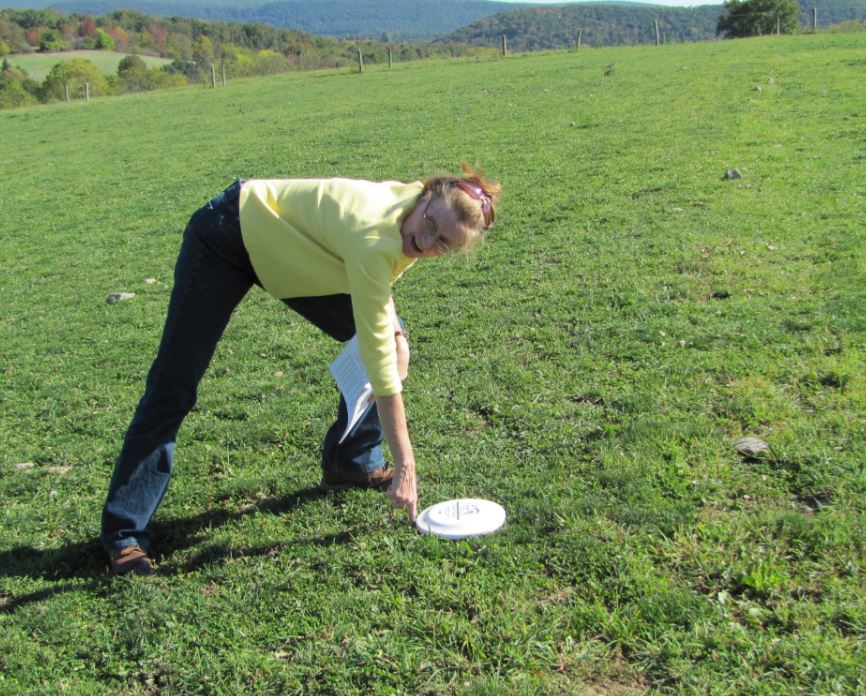
Project 1- documented conservation and farm management practices on 23 equine operations, quantitatively evaluated pasture desirable plants and canopy cover, sampled feed, hay and soil, and conducted nutrient management audits. Pasture data, collected using line point transect methodology, included calculation of percent canopy cover, basal stems and desirable forage. The 23 surveyed operations were used to develop a baseline for total nutrient balances and levels for the Pennsylvania horse industry.
Project 2- looked at nitrogen and phosphorus inputs on 14 farms to determine the risk of horse farms for non-point source pollution. Over a 12 months period, amounts of imported fertilizer, hay, concentrate feed, and bedding were obtained from farm managers. Samples of hay, concentrate feed, and bedding were taken from each farm and analyzed for N and P. Whole farm nutrient balance was calculated as a percent by the equation ((imported nutrients- exported nutrients) /imported nutrients) X 100. Nitrogen and P whole farm balances were recorded as a percentage basis for the total farm and on a kilogram basis for per animal unit and per hectare values. PROC SURVEYMEANS was used to determine descriptive statistics on the sample and whole farm balance values.
Project 3- involved 95 farm operations (1,086.90 ac.) in a project designed to implement practices to increase canopy cover and desirable forages in pastures and reduce nutrient and sediment loss. The team provided individual assistance to help owners locate resources, technical assistance and funding. All farm managers (n=95) farms were visited documenting conservation/management practices, BMPs already in place and identification of areas of concern/improvement needs. The team finalized field farm survey instruments, quantitatively documented pasture plants/canopy cover, sampled feed/hay/soil, and conducted nutrient management audits. Pasture data was collected using line point intercept and Equine Pasture Evaluation Disc methodology. All plant species were documented with pasture condition scores generated using pasture condition score sheets.
Out of the 95 farms visited, a total of 43 farm (744.55 ac. collectively), pastures were targeted for improvement, soil tested and prepared for methods to improve the pasture grass stands. Farms selected to reseed pastures were provided with a seed mix that was custom blended for their farm based on soil conditions, farm management, pasture needs and level of use.
Twenty-seven of the farms conducted reseeding using a no-till drill, 8 farms utilized conventional plowing and 8 farms utilized broadcasting and/or frost seeding. The remaining 48 farms did not need to reseed and instead received recommendations on methods to improve and manage existing forage quality through improving or utilizing BMPs. Four farms did not continue involvement in the program after the initial farm visit by the team.
What have we learned?
Project 1- The surveyed farms have helped to validate and evaluate existing tools on horse operations. The “pasture sediment loss” tools used (at that time) in this project (PA RUSLE2, Pasture Condition Score, Nutrient Balancing, Pasture Nutrient Balancing sheets and PA Phosphorous-Index) helped to analyze the cost-effectiveness and sustainability of the nutrient reduction strategies. The survey results have shown that these selected tools need to be adjusted in order to properly measure sediment and soil loses on horse farms.
Smaller farm operators reported a major hurdle to managing pastures is lack of knowledge and lack of equipment. In addition, 33% of farm managers reported they wanted to utilize the suggested practices, but required financial assistance or more technical information.
Results of the information gathered by the Equine Environmental Stewardship (EES) team projects has been used and examined by state agencies, assisting in development of in-service training for their personnel, used in revising potential regulations and assistance concerning horse farm operations.
Study 2- The majority of the horses on the farms were non-breeding horses, which the only managed output was manure. Four of the farms did not export any manure, 3 exported a small portion of their collected manure and 6 exported all their collected manure. Whole farm balance inputs averaged 53 kg N per 1000 lbs of animal (AU) and 13 kg P/AU. Whole farm balances ranged from 100% retention of imported nutrients where no products were exported to a negative balance where all collected manure was exported. Average N and P whole farm balances were 73% and 51% retention of inputs, respectively. With limited export of nutrients from horse farms as foals or manure, more manure must be exported and/or nutrient imports must be decreased to approach nutrient balance and decrease the risk of nutrient pollution.
Project 3- Out of the 95 farms visited, a total of 43 farms (representing 744.5 acres) were reseeded. Twenty farms needed to utilize the no-till drill purchased through the project grant. Pastures chosen for reseeding had low forage yields and canopy covers less than 50%. After reseeding the pastures, yields increased to 1.0 to 2.0 tons per acre resulting in an economic gain that averaged $450 to $600 per acre.
In conclusion: The Team noted that farm owners are committed to adopting practices that maintain healthy horses, healthy farms, and a healthy environment. Each of the farms listed worked with the Equine Team to select and implement one or more Best Management Practices (BMPs) on their farm. BMP’s were chosen to increase pasture canopy cover and improve pasture quality, proper composting and or disposal of manure, and ration formulation. Practicing rotational grazing, utilizing sacrifice areas, soil testing and applying lime and fertilizers are BMPs farmers were encouraged to adopt.
Future Plans
The survey results are being used in the development of the curriculum for Environmental Stewardship short courses, to help agency personnel understand the equine industry and to help farm owners develop the knowledge and skills necessary to adopt environmentally sound farm management practices.
Corresponding author, title, and affiliation
Ann Swinker, Extension Horse Specialist, Pennsylvania State University
Bott, R., Greene, E., Trottier, N., Willliams, C., Westendorf, M., Swinker N., Mastellar, S., Martinson, K., Environmental implications of nitrogen output on horse operations: A review, Journal of Equine Veterinary Science 08/2015; DOI:10.1016/j.jevs.2015.
Swinker, A., D. Foulk, H. McKernan , Environmentally Friendly Farm Program Recognizes Pennsylvania Farms that Adopt Sound Management Practices Protecting Water Quality and the Environment, Waste to Worth, Seattle WA, March 31 – April 3, 2015.
USDA, CIG Grant Final Report: Pennsylvania Small Farm Environmental Stewardship Program: Implementing Conservation Practices on Small Farms and Using Environmental, Agreement Number: 69-3A75-11-180. 56 pages.
USDA Natural Resource Conservation Service Conservation Innovation Grant and SARE Grant for funding this project. USDA Regional Project, NE-1041, All the hard work of the PSU Extension Equine Team
The authors are solely responsible for the content of these proceedings. The technical information does not necessarily reflect the official position of the sponsoring agencies or institutions represented by planning committee members, and inclusion and distribution herein does not constitute an endorsement of views expressed by the same. Printed materials included herein are not refereed publications. Citations should appear as follows. EXAMPLE: Authors. 2017. Title of presentation. Waste to Worth: Spreading Science and Solutions. Cary, NC. April 18-21, 2017. URL of this page. Accessed on: today’s date.
In Nebraska alone, nearly 400 earthen manure storage structures are in operation; approximately four dozen requests to cease operation of permitted lagoons were received by the Nebraska Department of Environmental Quality in the prior decade with many more non-permitted storage structures being in need of proper closure. Abandoned livestock lagoons, earthen manure storage basins, and other manure storages (e.g. concrete pits) need to be decommissioned in a manner that controls potential environmental risk and makes economical use of accumulated nutrients. Currently, limited guidance is available to support lagoon closure planning and implementation and few professionals who support livestock producers have experience planning or participating in the manure storage closure process. The main focus of this project was to produce two videos that document the processes for planning and executing a lagoon closure.
What did we do?
The University of Nebraska Haskell Ag Laboratory, located near Concord, NE, had an anaerobic lagoon that was operated for over 20 years, but has not received swine manure additions since 2009 when the swine unit was depopulated. The decommissioning of this storage structure was proposed in 2014 and provided our team an opportunity to plan, implement and document the procedures necessary to properly close this structure. When we went to find material on how to accomplish this properly, we did not find suitable material. Two grants were secured in 2016 from the U.S. Pork Center of Excellence (USPCE) to fund our team efforts to document the closure process – from planning to completion – with two separate videos. The first video is focused on the planning activities necessary to prepare for removal and utilization of stored liquid and sludge. The second is focused on the liquid and sludge removal and utilization activities, decommissioning of conveyance structures, and deconstruction of the lagoon berm to return the site to a natural grade.
Activities conducted to execute the lagoon closure have included:
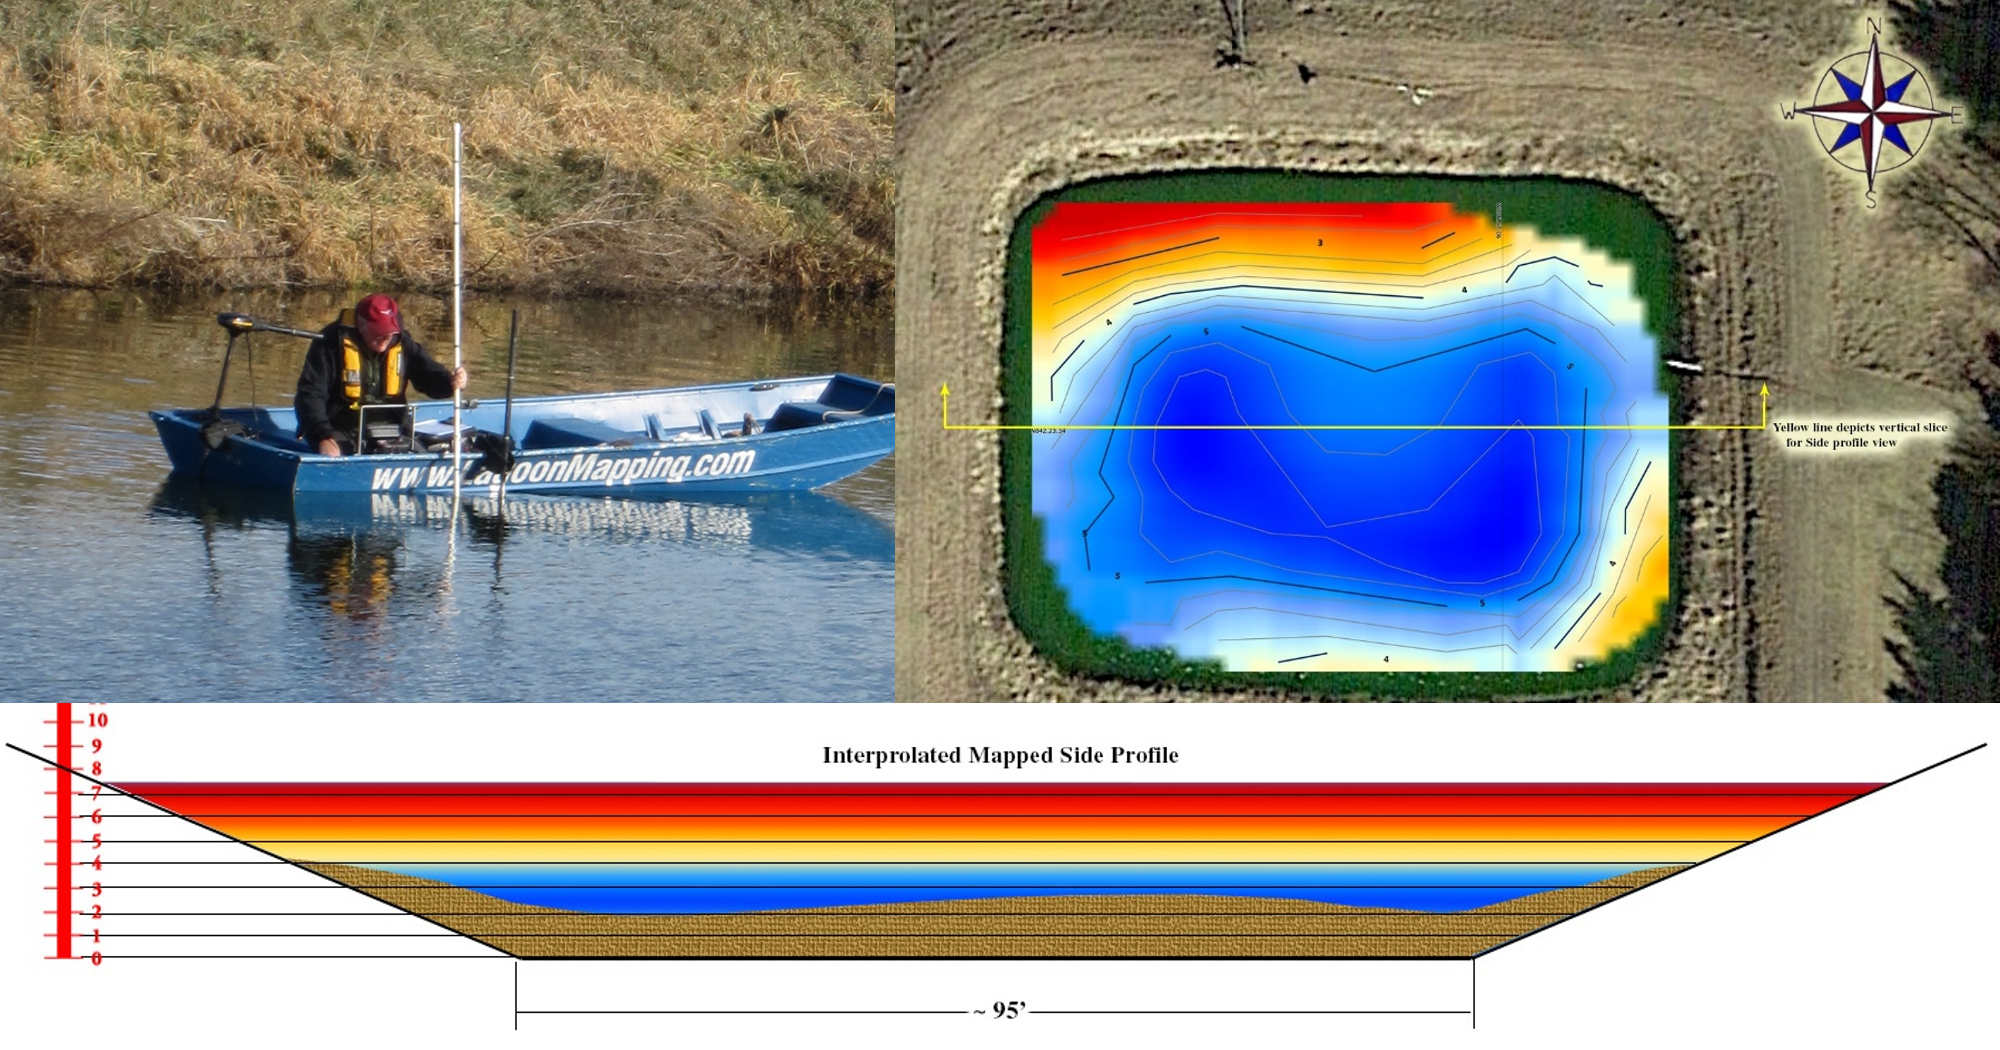
1) Mapping of sludge levels with sonar and analyzing sludge samples to estimate volume and nutrient content of sludge, which enabled development of a land application plan for utilizing the products
Figure 1. Sonar sludge mapping.
2) De-watering the lagoon (effluent used for sprinkler irrigation and flood irrigation)
3) Hosting a demonstration event during which participants:
a. observed sludge removal and land application processes,
b. participated in a manure spreader calibration,
c. inspected the soil beneath the lagoon liner,
d. viewed the abandoned production buildings and heard about options for eliminating conveyance of liquid from the building to the lagoon,
e. explored alternative sludge removal methods, and
f. participated in a classroom session where presenters shared details of the closure planning process, cost-share opportunities for closure of manure storage structures, and expectations for re-grading and re-seeding the site following removal of sludge.
Figure 2. Participants learned about planning land application of the sludge.
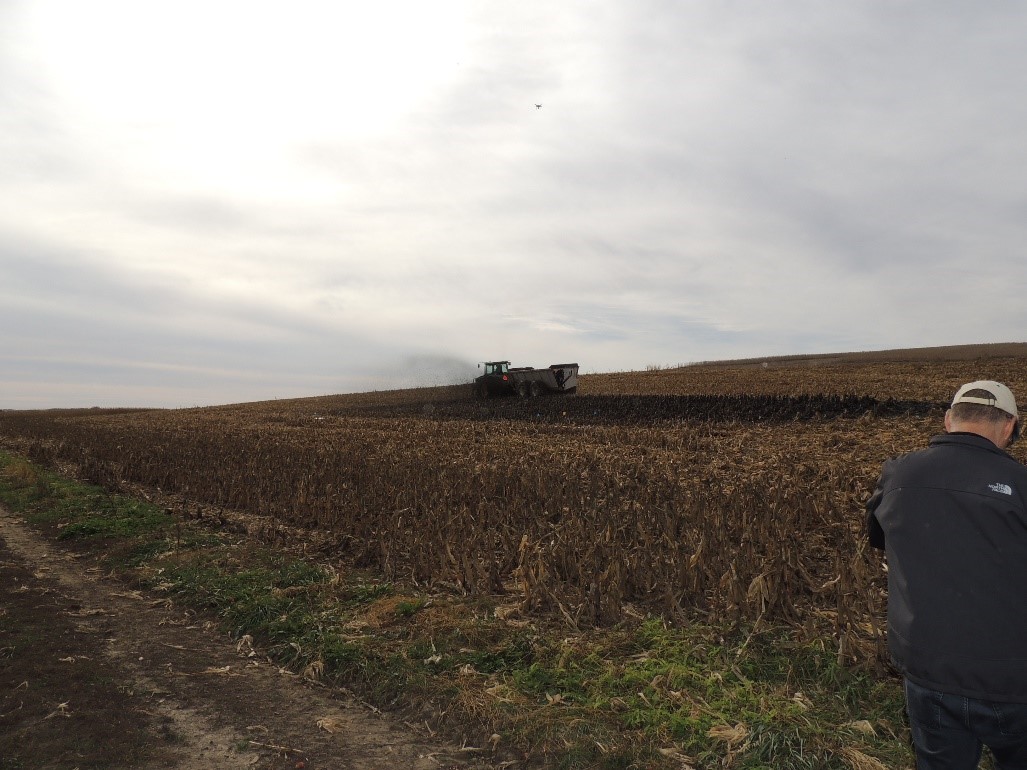
Figure 3. Land application of the sludge and calibration of the manure spreader.
4) Removing the sludge and applying it to cropland following the demonstration event.
Documentation of all planning, demonstration, and closure execution activities have been captured via extensive video footage, still photos, and participant interviews. Production of the videos is in process with completion and release of videos anticipated in summer 2017.
What have we learned?
Although every manure storage closure process is expected to present its own unique challenges and opportunities for learning, the process documented during this project has provided a number of insights:
1) While this process involved pumping liquid from the lagoon prior to attempting sludge removal in order to observe the sludge layer and document the volume present, a more appropriate, and likely more effective, process is to agitate the storage prior to and during pumping activities to enable handling all of the material as a slurry;
2) Dewatered sludge volume (nearly 200,000 gallons) and nutrient content (44.2 lbs. TKN, 37.5 lbs. organic N, 89.3 lbs. P2O5 and 7.6 lbs. K2O per 1,000 gallons) for this system yielded enough nutrients to apply to 80-100 acres, based on a phosphorus removal rate. It is unknown what the release of the organic N component of the sludge will be, but using just the phosphorus content, application of 1000 gallons per acre would provide enough phosphorus for what would be removed from 220 bushels of corn, which is worth approximately $35 with winter 2017 prices.;
3) Given the high phosphorus content in the sludge and that the nearby fields at the Haskell Ag Lab were not in need of phosphorus, an appropriate application rate for the sludge was determined as 8-10 tons/acre;
4) Soil beneath the lagoon liner yielded a phosphorus concentration of 556 ppm, likely a result of an inadequate liner in the lagoon as originally constructed in the 1960s; and
5) Installation of a bentonite clay liner during renovation of the structure in 1992 appeared to be effective as the liner was fully intact when observed during closure activities.
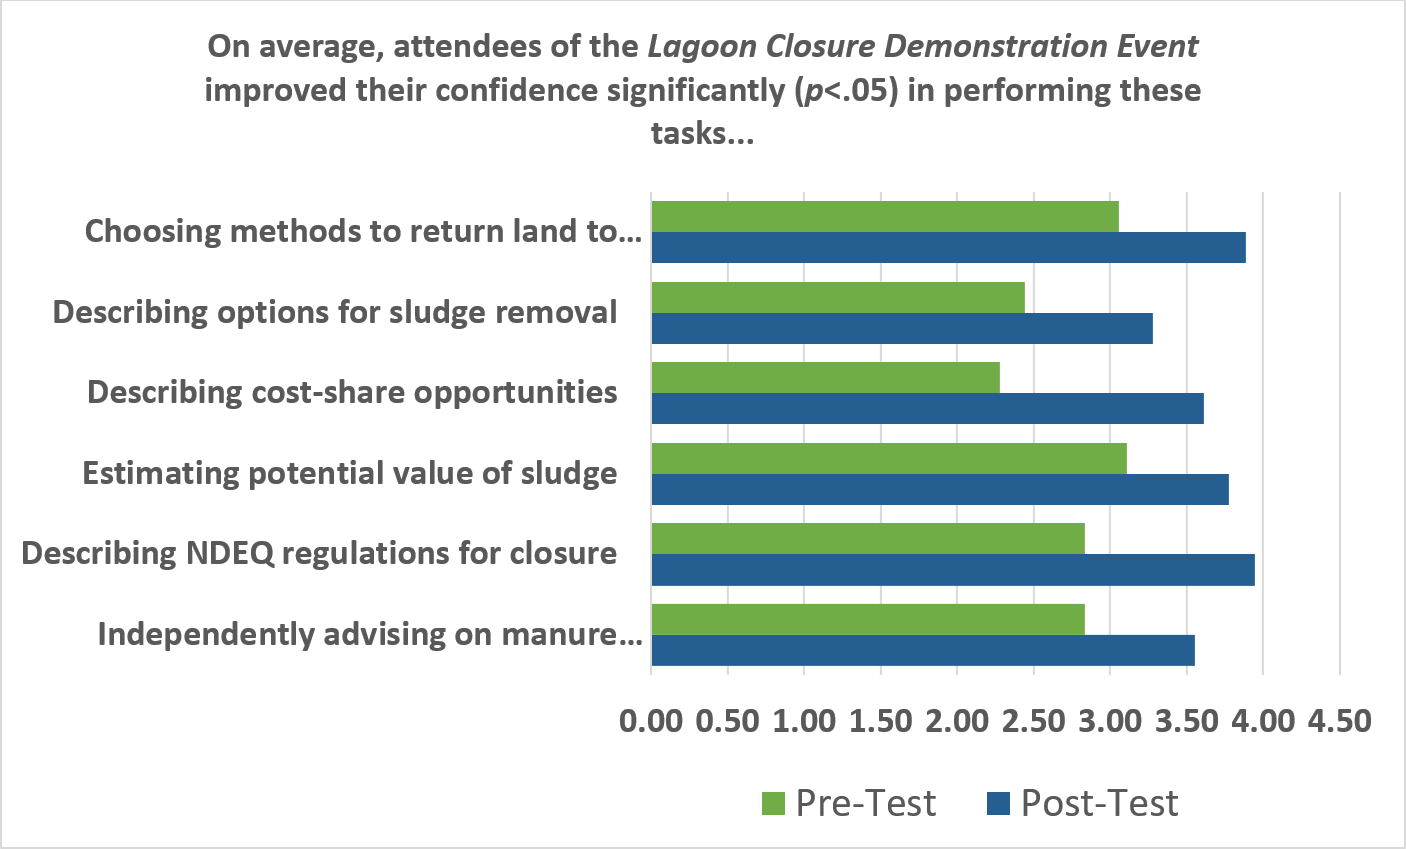
Pre-post surveys completed by 33 attendees of the demonstration event revealed that attendees improved their confidence in performing six key tasks identified by the team as being impactful. Results are summarized in Figure 4.
Figure 4. Impacts of the lagoon closure demonstration event.
Future Plans
We plan to continue the decommissioning process by:
1) Completing sludge removal and application to cropland;
2) Deconstructing the berms, leaving the liner intact, and returning the area to natural grade;
3) Seeding the area to establish ground cover and mitigate runoff and erosion; and
4) Plugging the inlet pipes in manure pits within the animal housing in lieu of removing buried conveyance pipes.
The two videos are in production and will be made available through the Pork Information Gateway (www.porkgateway.org) during summer 2017.
Corresponding author, title, and affiliation
Leslie Johnson, Research Technologist, University of Nebraska – Lincoln
The authors would like to recognize the U.S. Pork Center of Excellence (USPCE) for funding the development of the videos documenting this process and enabling us to complete this project. We would also like to acknowledge that without the support of the industry, who provided equipment and advice, we would not have been able to get this project off the ground. Also a special thanks to the Agricultural Research Division for their support.
Conservation and recovery of nitrogen and phosphorus from animal wastes and municipal effluents are important because of economic and environmental reasons. This paper presents a novel technology for separation and recovery of ammonia and phosphorus from liquid swine manure, which has significant amount of nutrients but also contains relatively high moisture content.
What Did We Do?
Phosphorus recovery via magnesium (MgCl2) precipitation was enhanced by combining it with ammonia recovery through gas-permeable membranes and low-rate aeration. Detailed procedures used in the research are provided in Vanotti et al. (2017).
What Have We Learned?
The combination of low-rate aeration and gas-permeable membrane N recovery destroyed the natural carbonate alkalinity in the wastewater and increased pH values, which accelerated ammonia uptake in the gas-permeable membrane system and improved the phosphate recovery. The process provided 100% phosphorus recovery efficiencies. Surprisingly, the magnesium phosphates produced contained very-high phosphate grade (46% P2O5 ) similar to commercial superphosphate fertilizer and consistent with the composition of a rare biomineral called newberyite that is found in guano deposits. This is an important finding because we were able to produce from wastes a valuable phosphate product with high P2O5 content favored by the fertilizer industry.
Future Plans
Research will be summarized showing consistent results obtained with municipal side-stream effluents. Economic considerations are provided in Dube et at. (2016).
Dube, P. J., Vanotti, M. B., Szogi, A. A., and García-González, M. C. (2016): Enhancing recovery of ammonia from swine manure anaerobic digester effluent using gas-permeable membrane technology. Waste Management 49:372–377.
Vanotti, M.B., Szogi, A.A., and Dube, P.J. (2016): Systems and methods for recovering ammonium and phosphorus from liquid effluents. U.S. Patent Application 15/170,129. U.S. Patent and Trademark Office.
Vanotti, M.B., Dube, P.J., Szogi, A.A., M.C. Garcia-Gonzalez (2017): Recovery of ammonia and phosphate minerals from swine wastewater using gas-permeable membranes. Water Research 112:137-146
Acknowledgements
This article is part of USDA-ARS Project 6082-12630-001-00D “Improvement of Soil Management Practices and Manure Treatment/Handling Systems of the Southern Coastal Plains.” We acknowledge the field and laboratory assistance of William Brigman and Chris Brown, USDA-ARS, Florence, SC, and the field sampling assistance of Diana Rashash, North Carolina Extension Service/ North Carolina State University.
The authors are solely responsible for the content of these proceedings. The technical information does not necessarily reflect the official position of the sponsoring agencies or institutions represented by planning committee members, and inclusion and distribution herein does not constitute an endorsement of views expressed by the same. Printed materials included herein are not refereed publications. Citations should appear as follows. EXAMPLE: Authors. 2017. Title of presentation. Waste to Worth: Spreading Science and Solutions. Cary, NC. April 18-21, 2017. URL of this page. Accessed on: today’s date.
Long term and significant accumulation of sludge in anaerobic swine lagoons reduces its storage volume and ability to treat waste. Usually, excess accumulation of lagoon sludge is removed using pump or dredge. The dredged sludge is then land applied at agronomic rates according to its nutrient content.
The accumulation of phosphorus (P) in the sludge requires the largest area of land application based on crop agronomic requirements. Therefore, nutrient management plans may limit application to crop or pastureland near the animal facility to avoid P build up in excess of soil and crop assimilative capacities. Although dewatered sludge can be moved off the farm, transportation becomes less economical with increasing distances. An option is to extract and recover P in a concentrated form for its economical transfer to P-deficient croplands, for use as fertilizer.
What did we do?
A patented treatment process, called Quick Wash (QW), developed by USDA-ARS for extraction and recovery of P from animal manure solids was tested for recovery of P from anaerobic swine lagoon sludge. With the QW process, P was extracted in solution from dredged sludge by mixing with sulfuric acid prior to dewatering using polymer enhanced mechanical solid-liquid separation. After that, P was recovered by addition of liquid lime and an anionic flocculent to the separated liquid extract to form a calcium-containing P precipitate. The QW process generated two solid products: 1) sludge solids low in P; and 2) a concentrated P material.
What have we learned?
While most of the nitrogen and carbon was left in the washed sludge solids, the QW process extracted and recovered as much as 90 % of the P from sludge. From results of a pilot field test, the P grade of the recovered phosphate was in the range of 24.0% – 30.5 % P2O5. The inclusion of this process in a lagoon sludge management plan offers producers an opportunity to locally land-apply the low-P sludge as a carbon-rich soil amendment and recover P as a valuable product for export from the farm.
Future Plans
USDA granted an exclusive license of the invention to Renewable Nutrients, LLC (Pinehurst, NC) to commercialize in the U.S the process for P recovery from animal and municipal waste streams. Renewable Nutrients is developping commercialization plans for the Quick Wash process that will include the operating and equipment costs of phosphorus recovery from dredged lagoon sludge.
Corresponding author, title, and affiliation
Ariel A. Szogi, Research Leader, USDA-ARS Coastal Plains Soil, Water, and Plant Research Center, Florence, SC.
This work is part of USDA-ARS National Program 212; ARS Project 6082-12630-001-00D “Improvement of Soil Management Practices and Manure Treatment/Handling Systems of the Southern Coastal Plain.”
Phosphorus loss from agricultural fields fertilized with poultry litter may contribute to eutrophication of nearby rivers, lakes, and streams. It has been suggested that gypsum can be used as a soil amendment to reduce P loss from these fields. Also, a new USDA-NRCS National Conservation Practice Standard 333 “Amending Soil Properties with Gypsum Products” has recently been created to promote conservation through gypsum use.
What Did We Do?
Field studies were conducted to evaluate the influence of gypsum on reducing P loss from both hayfields and row crops fertilized with poultry litter. Simulated rainfall was created to evaluate the effectiveness of gypsum on reducing P loss in successive runoff events occurring after poultry litter applications during the growing season.
What Have We Learned?
Results showed that gypsum can reduce the loss of dissolved P with surface water runoff from both hayfields and row crop systems. In addition, applying gypsum to grass buffer strips at the edge of an agricultural field could also be an effective management practice for P loss reduction. Gypsum reduced dissolved P loss in successive runoff events after poultry litter application regardless of timing, suggesting that the effect is persistent and will not diminish over a growing season. These findings suggest that gypsum use as a soil amendment has promise for reducing P loss from agricultural fields.
Future Plans
Future plans are to determine the most effective gypsum rate needed to reduce P loss from both row crop and hayfields systems.
Corresponding author (name, title, affiliation)
Dexter B. Watts, Research Soil Scientist, USDA-Agricultural Research Service located at the National Soil Dynamics Laboratory in Auburn, AL
H. Allen Torbert, Research Soil Science, USDA-Agricultural Research Service located at the National Soil Dynamics Laboratory in Auburn, AL.
Additional Information
Watts, D.B., J.B. Hess, S.F. Biligili, H.A. Torbert, J.L. Sibley, and J.D. Davis. 2017. Flue gas desulfurization gypsum; Its effectiveness as an alternative bedding material for broiler production. Journal of Applied Poultry Research. 26:50-59.
Watts, D.B., G.B. Runion, and K.S, Balkcom. 2017. Nitrogen fertilizer sources and tillage effects on cotton growth, yield and fiber quality. Field Crops Research. 201:184-191.
Watts, D.B., and H.A. Torbert. 2017. Influence of three application yearly application yearly application of FGD gypsum and poultry litter on surface water runoff. Soil Science. 182:18-27.
Torbert, H.A., R.L. Chaney, and D.B. Watts. 2017. Potential adherence of FGD gypsum to forage as a consideration for excessive ingestion by ruminants. Journal of Environmental Quality. doi:10.2134/jeq2016.07.0279 (In Press).
Watts, D.B., and H.A. Torbert. 2016. Influence of FGD gypsum on reducing soluble P in successive runoff events from a Coastal Plain Bermudagrass Pasture. Journal of Environmental Quality. 45:1071-1079.
Watts, D.B. and W.A. Dick. 2014. Sustainable uses of FGD gypsum in agricultural Systems. J. Environ. Qual. 43:253-262.
Chen, L., D. Kost, Y. Tian, X. Guo, D.B. Watts, D. Norton, R.P. Wolkowski, and W.A. Dick. 2014. Effects of gypsum on heavy metals in soils and earthworms. J. Environ. Qual. 43:263-272.
Torbert, H.A. and D.B. Watts. 2014. Impact of FGD Gypsum application on water quality in a Coastal Plain soil. J. Environ. Qual. 43:273-280.
Watts, D.B. and H.A. Torbert. 2009. Impact of gypsum applied to buffer strips on reducing
soluble P in surface water runoff. J. Envron. Qual. 38:1511-1517.
The authors are solely responsible for the content of these proceedings. The technical information does not necessarily reflect the official position of the sponsoring agencies or institutions represented by planning committee members, and inclusion and distribution herein does not constitute an endorsement of views expressed by the same. Printed materials included herein are not refereed publications. Citations should appear as follows. EXAMPLE: Authors. 2017. Title of presentation. Waste to Worth: Spreading Science and Solutions. Cary, NC. April 18-21, 2017. URL of this page. Accessed on: today’s date.
Assessing and improving the sustainability of dairy production is essential to secure future food production. Implementation of Beneficial Management Practices (BMPs) can reduce carbon and reactive nitrogen footprints of dairy farms. BMPs can and have been developed for different farm components, including feed, manure management and field cultivation practices. It is practically and economically infeasible to empirically test all combinations of BMPs at a whole farm scale. We therefore use whole-farm process-based models to assess the impact of several Beneficial Management Practices (BMPs) on carbon and reactive nitrogen footprints of dairy farms in the Great Lakes region. Specifically the aim of this study is to evaluate the influence of Beneficial Management Practices (BMPs) on carbon, reactive nitrogen and phosphorus footprints of dairy farms in the Great Lakes region.
What did we do?
1. Baseline farms
We developed two baseline model farms, a small 150 cow herd farm and a large 1500 cow herd farm, that are thought to be representative for current dairy farming practices in the Great Lakes region, particularly Wisconsin and New York State (Table 1). The two baseline dairy farms were developed based on individual team members’ expertise and a consultation with external experts (Dane County Conservationists, Madison, Wisconsin). For the 1500 cow farm, the baseline scenario was partly based on a previously-studied commercial dairy farm in NY state. Since this commercial dairy farm already employs some BMPs (e.g. anaerobic digestion as BMP in manure management), the farm was ‘downgraded’ to derive the baseline.
2. Beneficial Management Practices
Farm-specific BMPs were developed for three farm components, i.e. “Feed”, “Manure Management & Storage” and “Field management”. These BMPS were developed based on expert judgement and are expected or known to reduce whole-farm GWPs.
To ensure a meaningful integration of BMPs and a consistent comparison of whole-farm BMPs to the baseline and to each other, we used the following set of rules (per farm type): i) Total cultivated area was fixed (areas of individual crops can vary per scenario); ii) Herd size was fixed; iii) Milk production was allowed to float, however, only if the production increased (no decreases in milk production); iv) Purchases of crops and protein mixes were minimized as far as possible.
3. Process model simulation
The Integrated Farm System Model (IFSM4.3) was used to simulate the two baseline farms (i.e. 1500 cow farm in NY and 150 cow farm in WI) and all the individual BMPs. IFSM was used as a baseline model. The other process-based models, that is DNDC, APEX and CNCPS, were used to check IFSM predictions.
4.Whole-farm mitigation strategy
The individual BMPs were analyzed in terms of potential reduction in carbon and reactive nitrogen footprint. The best performing individual BMPs were combined into a whole-farm mitigation strategy and this whole-farm mitigation strategy was subsequently modeled in IFSM.
What have we learned?
A comparison of model simulations of feed BMPs to the baseline shows that an integrated feed BMP (low forage, corn silage:alfalfa 3:1, ~2% NDF digestibility, reduced protein 14%, added fat, increased feed efficiency) can potentially reduce carbon and reactive nitrogen footprints with ~20% and ~24%, respectively, while remaining cost effective (18% increase in net return in $/cow), for both farm sizes.
For the small farm, replacing the bedded-pack barn with a free stall barn for the heifers, substantially reduces the carbon and the reactive nitrogen footprint with 12% and 11%, respectively. The manure management BMP ‘sealed with flare’ provides the largest potential reduction in carbon footprint for both farms (11% – 20%), primarily through a mitigation of CH4 emissions from manure storage.
Field management BMPs only provide a minimal reduction in carbon footprint (~3%), however, the field BMP ‘no-till with injection’ substantially reduces the reactive N footprint (~16%) for both farm sizes. This reduction is primarily achieved by a reduction in ammonia volatilization.
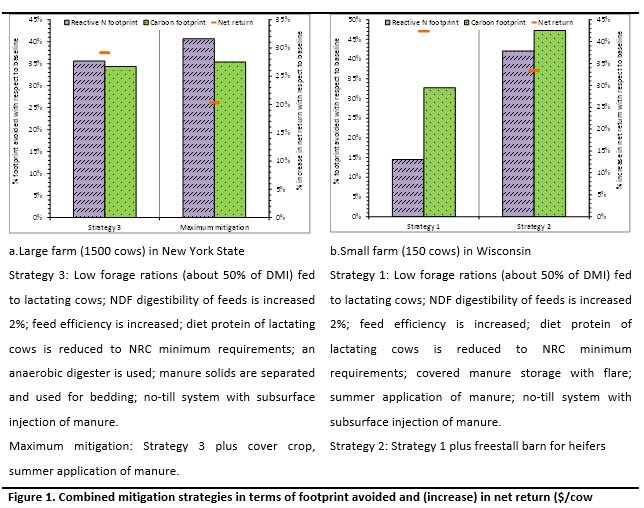
Based on the results for the individual BMPs, two combined whole-farm mitigation strategies were developed per farm and simulated in IFSM (Figure 1). For both the large farm and the small farm, the integrated whole-farm BMPs show an overall potential to reduce carbon and reactive nitrogen footprints with 33% to 37% and 15% to 42% respectively, simultaneously increasing milk production and the net return per cow with 10% to 12% and 20% to 42%, respectively.
This analysis suggests that BMPs can be applied to reduce greenhouse gas emissions and reactive nitrogen losses without sacrificing productivity or profit to the farmer.
Future Plans
Future research plans include a further comparison and analysis of IFSM predictions with predictions from other process models, including CNCPS, APEX, and ManureDNDC. In addition, we will assess the impact of climate change on the reactive nitrogen and carbon footprint of the baseline farms and the developed whole-farm mitigation strategies.
Corresponding author, title, and affiliation
Karin Veltman, PhD, University of Michigan, Ann Arbor
Alan Rotz, Joyce Cooper, Larry Chase, Richard Gaillard, Pete Ingraham, R. César Izaurralde, Curtis D. Jones, William Salas, Nick Stoddart, Greg Thoma, Peter Vadas, Olivier Jolliet
Additional information
Veltman et al. (2017) Comparison of process-based models to quantify nutrient flows and greenhouse gas emissions associated with milk production. Agricultural Ecosystems and Environment, 237, 31–44
DairyCAP project, www.sustainabledairy.org, aims to reduce the life cycle environmental impact of dairy production systems in the US.
Acknowledgements
This material is based upon work that is supported by the National Institute of Food and Agriculture, U.S. Department of Agriculture, under award number 2013-68002-20525. Any opinions, findings, conclusions, or recommendations expressed in this publication are those of the author(s) and do not necessarily reflect the view of the U.S. Department of Agriculture.
The authors are solely responsible for the content of these proceedings. The technical information does not necessarily reflect the official position of the sponsoring agencies or institutions represented by planning committee members, and inclusion and distribution herein does not constitute an endorsement of views expressed by the same. Printed materials included herein are not refereed publications. Citations should appear as follows. EXAMPLE: Authors. 2017. Title of presentation. Waste to Worth: Spreading Science and Solutions. Cary, NC. April 18-21, 2017. URL of this page. Accessed on: today’s date.
The use of gas-permeable membranes in wastewater treatment and resource recovery has become an increasingly prevalent research topic. Many of the membranes used for such purposes are expanded PTFE (ePTFE or Teflon), but the specifications, characteristics, and performance under certain conditions of these materials vary widely. In spite of these property differences, we found no documented process or suggested membrane specifications by which one membrane product can be selected over another for a given removal or recovery goal in wastewater. Research we reviewed in this area mostly describe examples of different applications.
Collection of ammonia from waste streams, especially with high concentrations such as animal manures, offers several benefits such as reduction of air pollution precursors, prevention of water pollution, and transformation into higher-value products.
What did we do?
Tests were selected to evaluate the performance and durability of four different hydrophobic, gas-permeable membranes specific to the application under consideration—ammonia recovery from wastewater—but can be used with slight modification for testing recovery of other compounds of interest.
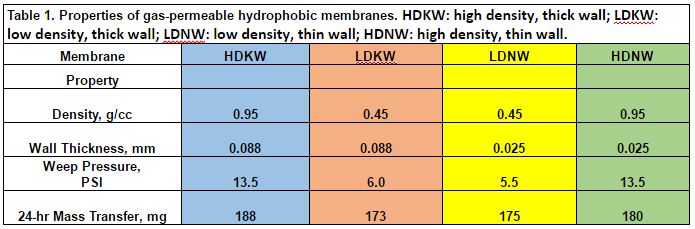
The four Teflon membranes selected differed in material density and wall thicknesses, specifications important for variability in handling, durability, and mass transfer (HDKW: high density, thick wall; LDKW: low density, thick wall; LDNW: low density, thin wall; HDNW: high density, thin wall). Membrane specifications and properties are provided in Table 1. The different membranes were examined in this study spanned across several trials. Experimentation reared data on different membranes’ weep pressure, as well as the airflow rate through the membranes as a function of applied pressure to the membrane. Data were also collected on the rate of transfer of ammonia from the gas phase across the membrane into the aqueous phase over a 24-hour period.
I. Weep Pressure Test
The weep pressure is that pressure at which the membrane loses its hydrophobicity and allows liquid to pass. Results are used to estimate the maximum differential pressure the membrane can withstand without compromising membrane integrity. This test of each membrane material was completed in triplicate using prepared sections of each of the four membrane materials. Membranes were first soaked in 0.1 mM sulfuric acid for 24 hours. A section of each membrane material was connected at the end of a column of vinyl tubing and filled with the 0.1 mM H2SO4 solution at a pressure of 0.5 PSI. Pressure was increased by 0.5 psi increments every 24 hours by applying air pressure through a manifold. Pressure was increased until a drop of liquid was found weeping from one or more of the membranes.
II. Air Flow Test
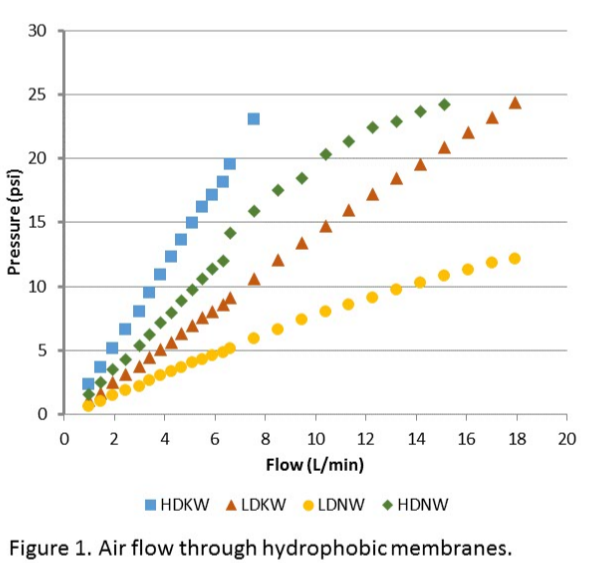
We determined the resistance to airflow through each membrane as an indication of the relative resistance of the various membranes to mass transfer of gas molecules of interest. A section of each of the four materials were connected to a compressed air source through a flow meter and pressure gauge. The pressure was recorded as the airflow rate was increased incrementally to 25 PSI, well past the maximum weeping pressure, or until the flow rate seemed to taper off. The procedure was repeated three times using the same section of each membrane material. The results are shown in Figure 1.
III. Mass Transfer Test (Gas to Liquid Exchange)
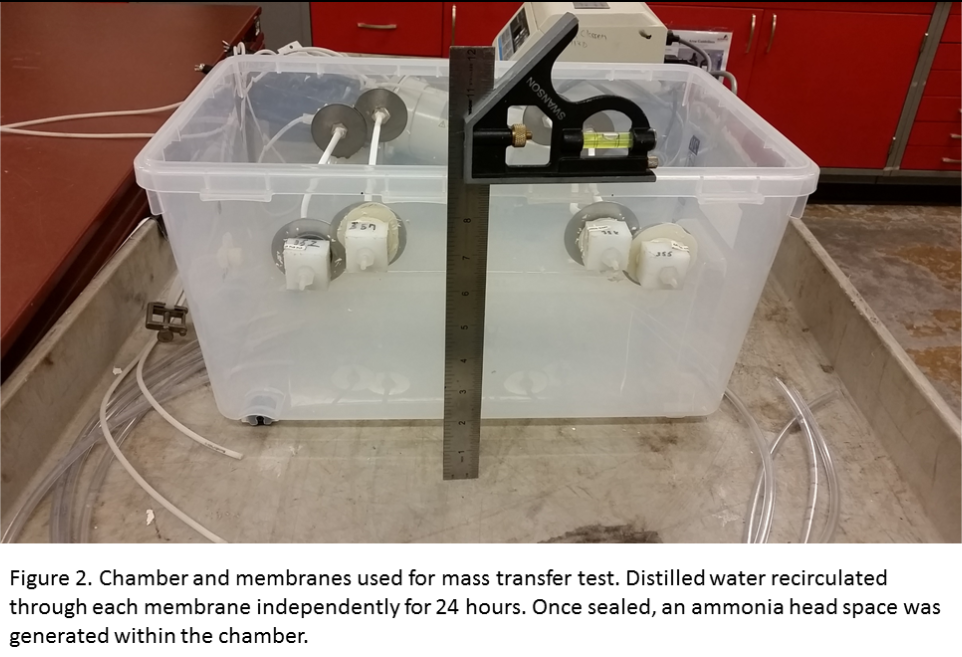
A final test was conducted to estimate if the differences in membrane composition and performance of earlier tests impact the mass transfer of the gas of interest across the membrane. A single section of each of the four membrane materials was installed through bulkhead fittings as shown in Figure 2 into a chamber such that deionized (DI) water could be circulated through each individual membrane while all four membranes were exposed to the same NH3 concentration inside the chamber. NH4Cl was combined with NaOH inside the chamber to produce NH3 gas.
What have we learned?
The results of the mass transfer experiments revealed there are only small differences in ammonia transfer rates among the different membranes, leaving the membrane selection to rely on other results. The weep pressure of the low density membranes was lower than that of the high density membranes but was sufficient to avoid backwards movement of the two fluid phases. The higher airflow rate and lower pressure of the low density thin walled material was the determining factor in selecting this membrane. From these tests, this membrane will survive handling and installation and will provide little resistance to ammonia transfer from wastewater.
Future Plans
The experiments and conclusions involved in this study are some of the first of their kind for this application, therefore leaving much research to still be done surrounding membrane selection for other material recovery processes. Data gathered in this particular study can serve as a guideline for further research pertaining to optimal membrane characteristics for the recovery of target products from effluent.
Corresponding author, title, and affiliation
Jacqueline Welles, Undergraduate Research Assistant, Biological and Agricultural Engineering, North Carolina State University
Elizabeth Gordon, Undergraduate Research Assistant, Biological and Agricultural Engineering, North Carolina State University John J. Classen, Ph.D., Associate Professor, Biological and Agricultural Engineering, North Carolina State University Mark Rice, E
Additional information
Primary author: Jacqueline Welles – North Carolina State University
Funding for this project was provided by NRCS CIG Award Number 69-3A75-12-183. The authors are grateful for the analytical work of the BAE Environmental Analysis Laboratory, Dr. Cong Tu, manager.
While Eastern Redcedar are native to Nebraska and much of the Central U.S., the ability of these trees to thrive in many soils and under a broad range of climatic conditions has contributed to their designation as an invasive species. Cedar tree proliferation negatively impacts agriculture by reducing groundwater availability, compromising grazing land, impeding forage production for cattle, and altering surface water flows. Agricultural crop and livestock producers depend on affordable access to water, healthy and productive soils, and quality grazing land to remain profitable. Land treatment practices that return organic matter to soil improve soil health, which in turn positively impacts crop productivity, soil water holding capacity, soil fertility, and grazing land forage quality and productivity. This project is investigating the use of two readily available by-products in Nebraska, livestock manure and cedar tree wood chips, as amendments on agricultural land to improve soil productivity metrics. The overall goal of this project is to demonstrate a value-added use for woody biomass to offset the cost of tree management activities and encourage landowner management of cedars.
What did we do?
Crop year 2016 was the first year of the Woody Biomass and Manure Project. Six treatments were applied to 12-m x 10-m plots within cooperators’ fields following the 2015 harvest:
1. woody biomass (WB1), 6 ton/ac
2. woody biomass (WB2), 12 ton/ac
3. woody biomass with liquid N (WBLN), 6 ton/ac
4. woody biomass with swine manure (WBSM), 6 ton/ac
5. woody biomass with cattle manure (WBCM), 6 ton/ac
6. control (Cont), no amendments
Manure and liquid nitrogen treatments received less than 30 lbs ac-1 of N in the fall. The experiment is a completely randomized block design with four replications of each treatment, for a total of 24 plots, at each of the sites. Since the plots were established within existing crop fields, the producers were encouraged to continue their current management strategies. Both sites were irrigated, and fertilizer was applied uniformly across all plots using the pivot throughout the growing season.
Soil was sampled for chemical and biological properties in the spring and fall of 2016 and sent to a commercial lab for analyses. Rye was sampled by hand harvesting 0.25 square feet from four locations within each plot for a total of 1 square foot. Corn was sampled by hand harvesting six plants from each plot. Stand counts were also completed. WATERMARK sensors were installed at three depths (1, 2, and 3 ft) in two replications of four treatments (WBCM, WB1, WB2, Cont) at both sites. Additionally, temperature sensors were installed at a depth of 1 ft. A total of 16 plots were monitored (8 plots per site with 2 replications of 4 treatments).
What have we learned?
Soil biological and chemical characteristics have not been affected during the first year. There were no differences in the amount or type of soil microbes due to treatment. WBCM and WBLN had greater soil nitrate than WB1 and WBSM early in the spring. Additionally, WBCM had greater soil K than the other treatments. Other than these two instances, there were no differences in organic matter, pH, and macronutrients. However, this is not surprising since measurable changes in soil properties typically occur over many years and manure application rate was relatively low. More importantly, though, is that microbial populations were not decreased by the cedar mulch.
Cedar mulch applications did not decrease biomass yield of corn and rye when applied with nitrogen. In fact, in the rye, WBLN had the greatest biomass yields followed by WBCM, WB1, WBSM, and Cont. WB2 had the lowest rye biomass, which was probably due to nitrogen tie-up by the wood chips due to the initially higher C:N ratio. There was no treatment effect for corn biomass or stand counts.
At the site planted to corn at a depth of one foot, the three woody biomass treatments monitored (WB1, WB2, and WBCM) were significantly wetter and cooler than the control from mid-June until mid-July. WBCM was also wetter at a depth of two feet than the control. Unfortunately, due to rodent activity, statistical analyses at the rye site and other times of the growing season are not possible. The differences in soil moisture and temperature are probably due to shading and the physical barrier to evaporation that the wood chips supply. The increased soil moisture under the woody biomass treatments could reduce irrigation.
Future Plans
In order to apply for competitive funding, we need more supporting data. We are going to increase monitoring of soil moisture and temperature, so that three replications of all six treatments are monitored at both sites. Additionally, a greenhouse study will be conducted to provide water quality data and rate of decomposition of the wood chips.
Corresponding author, title, and affiliation
Linda Schott, Extension Graduate Research Assistant, University of Nebraska-Lincoln
Amy Schmidt, Assistant Professor, University of Nebraska-Lincoln; Amy Timmerman, Associate Extension Educator, University of Nebraska-Lincoln; Adam Smith, Assistant Forester, Nebraska Forest Service
Additional information
More information can be found at: manure.unl.edu
Acknowledgements
This project is funded by the Nebraska Forest Service. We would like to thank the Middle Niobrara Natural Resource District, especially Mike Murphy, Travis Connot, and Zach Peterson, for their assistance to this project. We would also like to thank the Nebraska Forest Service, especially Richard Woollen, Adam Smith, and Heather Nobert, for their assistance to this project. Additionally, this project would not be possible without our two farmer cooperators, Leonard Danielski and Greg Wilke.
The purpose of this research was to identify trade-offs among soil erosion, soil health, and crop production when using cover crops with manure application.Continuous corn silage cropping systems in Wisconsin leads to overall removal of N from the system unless manure is applied. However, this cropping system allows for the planting of cover crops or a winter silage crop post harvest, which may lead to increases in soil N over time. Cover crops are valuable in these corn-silage based rotations as they also provide ground cover after harvest and can reduce N leaching after fall manure application.
What did we do?
The cropping system investigated was a continuous corn silage system with fall manure application. The experiment was a randomized complete block split-plot design where the whole plot treatments were no cover, rye as a cover (chemically terminated) or as a forage (harvested) crop and the split plot treatment was depth.The objective of this study was to determine the effect of cover cropping on potentially mineralizable nitrogen (PMN) over a growing season using a 7-day anaerobic incubation (2015 and 2016 season), a long-term aerobic incubation (2015 season), and N uptake by corn.
What have we learned?
There were no statistical differences in short-term PMN among cover crop treatments at any time point in 2015 or 2016. However, the cover crop treatments led to a yield reduction compared to no cover crop use in both years. Thus, our study showed significant effects of cover cropping on agronomic factors like corn yield and N uptake but these same differences were not measurable in the soil N.
Future Plans
This work will continue to evaluate the long-term effects of cover crop use on soil health.
This material is based upon work that is supported by the National Institute of Food and Agriculture, U.S. Department of Agriculture, under award number 2013-68002-20525. Any opinions, findings, conclusions or recommendations expressed in this publication are those of the author(s) and do not necessarily reflect the view of the U.S. Department of Agriculture.
The authors are solely responsible for the content of these proceedings. The technical information does not necessarily reflect the official position of the sponsoring agencies or institutions represented by planning committee members, and inclusion and distribution herein does not constitute an endorsement of views expressed by the same. Printed materials included herein are not refereed publications. Citations should appear as follows. EXAMPLE: Authors. 2017. Title of presentation. Waste to Worth: Spreading Science and Solutions. Cary, NC. April 18-21, 2017. URL of this page. Accessed on: today’s date.
Manage Cookie Consent
To provide the best experiences, we use technologies like cookies to store and/or access device information. Consenting to these technologies will allow us to process data such as browsing behavior or unique IDs on this site. Not consenting or withdrawing consent, may adversely affect certain features and functions.
Functional
Always active
The technical storage or access is strictly necessary for the legitimate purpose of enabling the use of a specific service explicitly requested by the subscriber or user, or for the sole purpose of carrying out the transmission of a communication over an electronic communications network.
Preferences
The technical storage or access is necessary for the legitimate purpose of storing preferences that are not requested by the subscriber or user.
Statistics
The technical storage or access that is used exclusively for statistical purposes.The technical storage or access that is used exclusively for anonymous statistical purposes. Without a subpoena, voluntary compliance on the part of your Internet Service Provider, or additional records from a third party, information stored or retrieved for this purpose alone cannot usually be used to identify you.
Marketing
The technical storage or access is required to create user profiles to send advertising, or to track the user on a website or across several websites for similar marketing purposes.


 Project 1- documented conservation and farm management practices on 23 equine operations, quantitatively evaluated pasture desirable plants and canopy cover, sampled feed, hay and soil, and conducted nutrient management audits. Pasture data, collected using line point transect methodology, included calculation of percent canopy cover, basal stems and desirable forage. The 23 surveyed operations were used to develop a baseline for total nutrient balances and levels for the Pennsylvania horse industry.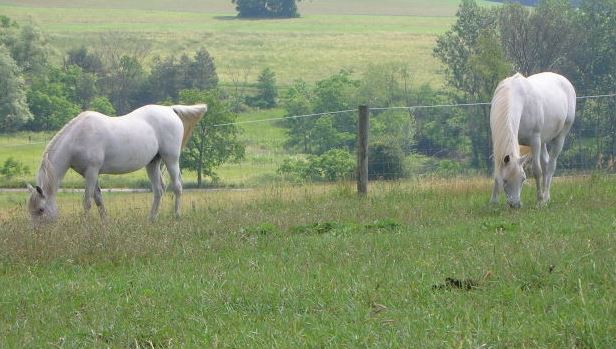



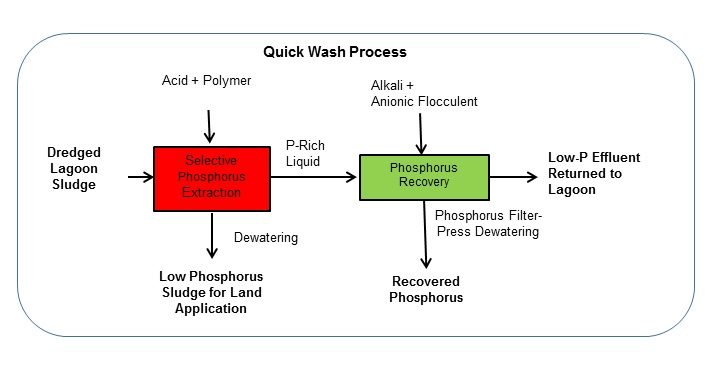 P was extracted in solution from dredged sludge by mixing with sulfuric acid prior to dewatering using polymer enhanced mechanical solid-liquid separation. After that, P was recovered by addition of liquid lime and an anionic flocculent to the separated liquid extract to form a calcium-containing P precipitate. The QW process generated two solid products: 1) sludge solids low in P; and 2) a concentrated P material.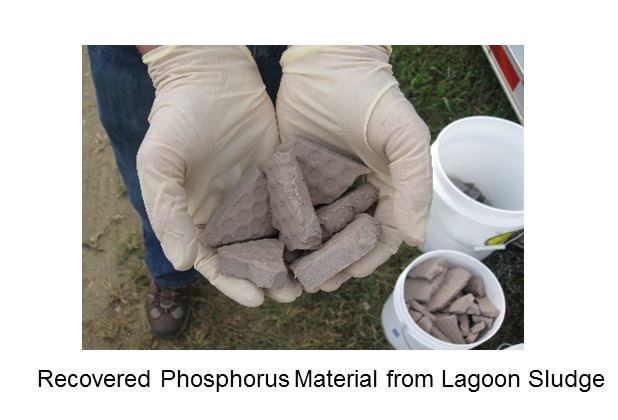
 Proceedings Home