
Assessment of Condensed Distillers Solubles (CDS) and Wet Distillers Grains (WDG) as Sources of Phosphorus Fertilizer for Corn and Wheat

Proceedings Home W2W Home w2w17 logo

Purpose

Some farmers in North Dakota are showing growing interest in applying coproducts from ethanol production, as sources of nutrients for crop production, especially corn and wheat. The majority of these coproducts are used as livestock feedstuff, but sometimes, due to a combination of factors, ethanol plants have a surplus of condensed distillers solubles (CDS) and wet distillers grain (WDG). Under those circumstances, the price of CDS and WDG can drop significantly, and due to their nutrient content, it might make financial sense to use them as a source of nutrients for crop production instead of commercial fertilizers. Cognizant of current low market prices of wheat and corn, farmers are seeking effective and less expensive sources of nutrients for their crops. Farmers also like the concept of recycling the nutrients exported in the corn kernels back into the soil in the form of CDS and WDG.

What Did We Do?

We conducted studies in Carrington (2015 and 2016) and Fairmount (2015), ND. We assessed the impact of CDS and WDG compared to triple super phosphate (TSP) fertilizer as sources of phosphorus (P), on grain yield and quality of corn (2015 and 2016) at rates of 0, 40, 80, 120 lbs P2O5/ac, and wheat (2016) at rates of 0, 40, 80 lbs P2O5/ac. Treatments were surface applied and incorporated. CDS was mixed with water to facilitate application. The check (0 lbs P) and TSP treatments received recommended N as urea.
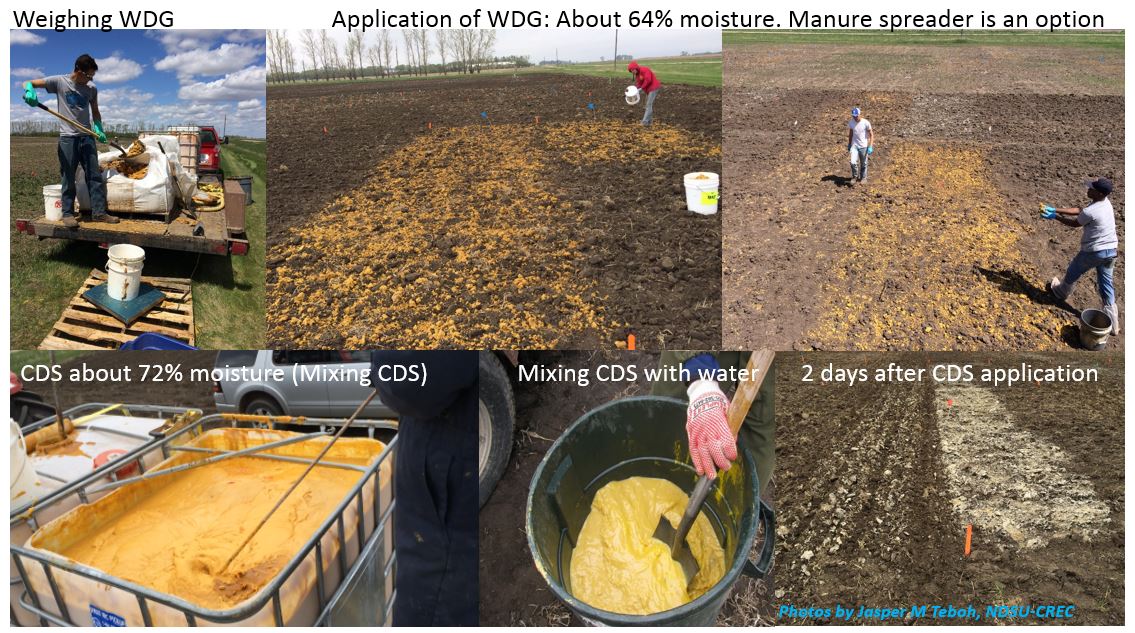
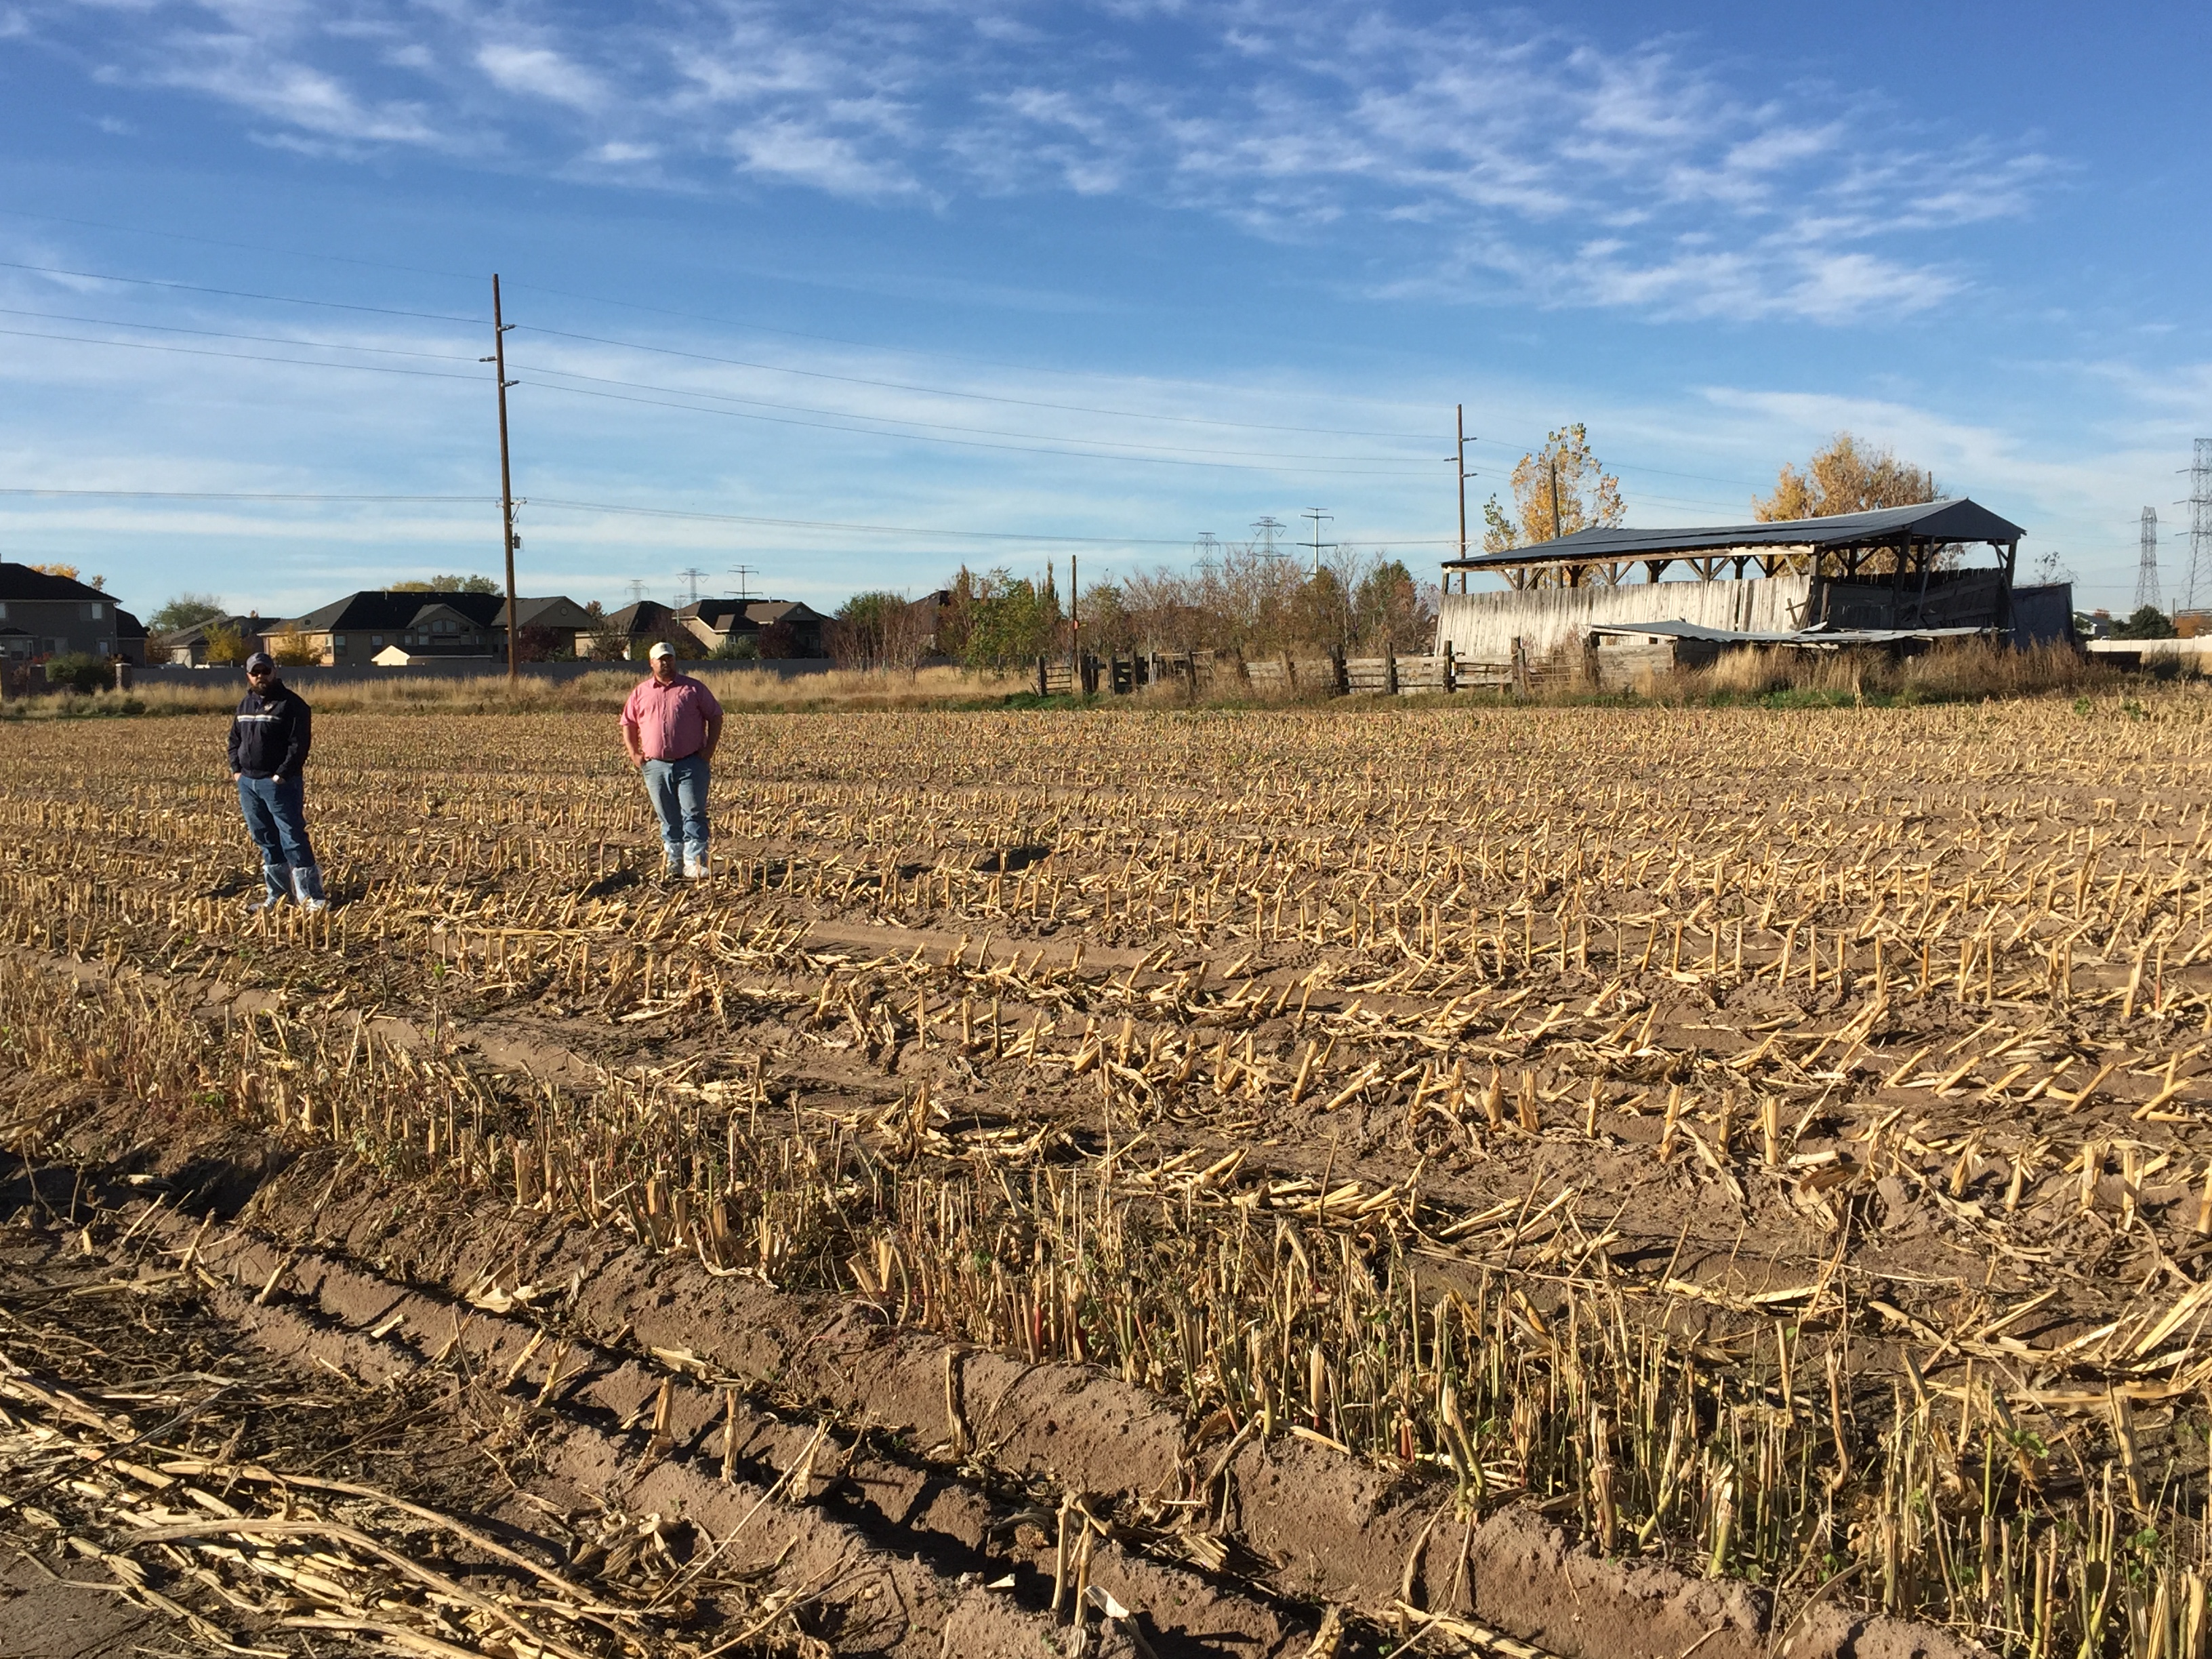
Slides of weighing, applying, and mixing WDG

What Have We Learned?

In 2015, corn yields from CDS treatments were consistently greater than yields from WDG and TSP at each P level at Carrington. Corn did not respond to P application at Fairmount. In 2016, corn yields were significantly greater for WDG treatments than for CDS and TSP, which produced similar yields. Wheat yields and protein were also significantly higher for WDG compared to TSP. Therefore, CDS and WDG can be valuable sources of P and other nutrients for grain crops in North Dakota.

Future Plans

We will continue assessing the P fertilizer value of CDS and WDG for corn and wheat in 2017. A separate study will assess in-furrow treatments with CDS. Finally, we will assess soil residual effects from CDS and WDG application to soil on subsequent crops, as well as potential economic implications for farmers.

Authors

Jasper M Teboh, Research Soil Scientist, NDSU – Carrington Research Extension Center

Jasper.Teboh@ndsu.edu

Other Authors

Joel Ransom, Extension Agronomist – Cereal Crops, NDSU – Department of Plant Sciences

Szilvia Yuja, Research Soil Specialist, NDSU – Carrington Research Extension Center

J. Paulo Flores, Precision Ag Specialist, NDSU – Carrington Research Extension Center

Additional Information

Please contact me with questions at Jasper.Teboh@ndsu.edu or by phone at 701-652-2951 (Ext 109).

Results from this research were first presented at the ASA/SSSA/CSSA 2016 annual conference in Phoenix and is accessible at:

https://scisoc.confex.com/crops/2016am/webprogram/Paper100533.html

A summary of findings was later presented on the NDSU – Carrington REC blog at

https://www.ag.ndsu.edu/CarringtonREC/center-points/distillers-grains-impacted-yields-of-corn-and-spring-wheat-when-used-as-a-source-of-p

Acknowledgements

The authors are grateful to the North Dakota Corn Council, and North Dakota Agricultural Products Utilization Commission for funding the corn and wheat projects, respectively. Our gratitude also to Tharaldson Ethanol (Casselton, ND) especially Mr. Keith Finney and Mr. Brad Kjar; Mr. Greg LaPlante, Mr. Chad Deplazes (Research Specialist at NDSU), CREC technicians, staff, and students for field support.

The authors are solely responsible for the content of these proceedings. The technical information does not necessarily reflect the official position of the sponsoring agencies or institutions represented by planning committee members, and inclusion and distribution herein does not constitute an endorsement of views expressed by the same. Printed materials included herein are not refereed publications. Citations should appear as follows. EXAMPLE: Authors. 2017. Title of presentation. Waste to Worth: Spreading Science and Solutions. Cary, NC. April 18-21, 2017. URL of this page. Accessed on: today’s date.

Manure Treatment and Natural Inactivation of Porcine Epidemic Diarrhea Virus in Soils

Proceedings Home W2W Home w2w17 logo

Purpose

The porcine epidemic diarrhea virus (PEDv) outbreak in North America has substantially impacted swine production, causing nearly 100% mortality in infected newborn piglets. Because manure may remain a source of reinfection, proper manure management practices to limit outbreaks need to be developed and evaluated. Two laboratory studies simulating manure pit treatment with increasing amounts of quicklime were conducted to determine PEDv susceptibility to increasing pH. Additionally, two laboratory soil incubation studies contrasting manure liming, multiple soil types, and two antecedent soil moistures were conducted over several months with incubation conditions mimicking the climates in Minnesota, Missouri, and Oklahoma to determine whether current manure application practices reduce the potential for PEDv reinfection via manure-amended soil. Quantitative PCR and live swine bioassays were used to enumerate PED virus and to determine whether manure and soil samples contained infectious PEDv.

What did we do?

Quicklime-Manure Slurry Incubations: An initial short-term manure slurry study was conducted on fresh PEDv-positive manure slurry collected in 2015 from the shallow pit of a commercial swine facility in southeast Nebraska. Manure was sampled prior to treatment (0 h) and then distributed among glass beakers (250 mL) to accommodate triplicates of three treatments: liming to pH 10, liming to pH 12, and unlimed manure. Following pH adjustment, aliquots of each sample were collected at 1 and 10 h, immediately neutralized with 10 mM HCl and stored at -80°C for subsequent analysis. In a second manure slurry incubation, triplicate PEDv-positive manure samples collected from a commercial swine operation in south central Nebraska site in December 2016 were mixed in equal portion (w:v) with distilled water to mimic manure slurry consistency observed in swine production pit storages. Quicklime was added stepwise (0.25 g addition) to each manure slurr! y sample with continuous stirring to gradually increase manure slurry pH. After each addition of quicklime, pH was measured and an aliquot of manure slurry was collected for subsequent quantitative PCR PEDv enumeration and infectivity in a pig bioassay.

Long-term manure and soil incubation. Initial tests determined appropriate initial soil moisture contents (representing a ‘dry’ and ‘moist’ soil condition) and manure:soil ratios (1 g slurry:3 g soil) to best represent the manure:soil within an injection furrow when slurry is injected into soil, and appropriate liming source (ag lime vs. quicklime). PEDv-positive manure slurry collected from a commercial swine operation in southeast Nebraska was divided between two 3-L containers, one for limed treatment (LIME) and the other for the control, or no-lime, treatment (CNL). Quicklime (30 g) was added to one 3 L portion (equivalent to an application of 80 lbs. quicklime per 1000 gallons of slurry) to achieve a final pH of 12. Both treated and untreated slurry stocks were incubated at room temperature for 24 hours. Distilled water was added to two soils, a silty clay loam (pH 7.0) and a loamy fine sand (pH 6.9), to attain 10% and 30% water holding capacity! (dry and moist soil condition). Thirty grams (dry weight) of soil was apportioned to multiple 50 mL screw top conical tubes and a cavity was made in the center of the soil by pressing a 10 mL pipet tip into the soil. Ten mL of slurry (LIME or CNL) were then added to each soil tube via pipet. Four replicate tubes were immediately frozen at -80°C for each combination of soil, moisture, and manure treatment to represent initial soil application (day 0). The tubes were loosely capped and placed into one of three incubators operated independently throughout the trial to simulate soil temperatures between November 1 and May 1 at one of three geographic locations: southern Minnesota, northern Missouri, and central Oklahoma (Figure 1). Twenty replicate tubes were created for each combination of soil, moisture, incubation, and manure treatment, and a set of four tubes were collected for each treatment combination on days 30, 60, 90, 120 and 150 of the incubation and immediately transfer! red to a -80°C freezer for storage.

Molecular detection and quantification of PEDv. Prior to analysis, soil and manure samples were removed from -80°C storage and allowed to thaw at room temperature. The RNA in each sample was extracted using the RNA PowerSoil Total RNA Isolation kit (Mo Bio, Carlsbad, CA). PEDv was detected in samples by reverse transcription and quantitative polymerase chain reaction (RT-qPCR).

Swine bioassay. To confirm that conditions yielding a PCR negative result actually inactivated the PED virus and rendered the manure non-infectious, a live pig bioassay was conducted with the limed and non-limed manure slurry samples from the initial short-term manure slurry incubation (quicklime addition). Fifteen pigs, approximately 21 days old, were sourced from a high-health facility whose dams tested negative for PEDv antibodies and virus by PCR. Piglets were tested for PEDv upon arrival and confirmed negative. Piglets were randomly assigned to individual housing in BSL-2 rooms at the University of Nebraska-Lincoln Life Sciences Annex as follows: control (3 piglets), pH 10 (6 piglets), and pH 12 (6 piglets), and allowed to acclimate for three days. Each pig was then administered a 10-mL oral gavage of manure slurry: three piglets in the control room received one of the three un-limed slurry samples; six piglets in the pH 10 room received one of the six limed (pH 10) sl! urry samp les (three limed for 1 h and three limed for 10 h); and six pigs in the pH 12 room received one of the six limed (pH 12) slurry samples (three limed for 1 h and three limed for 10 h). Piglets were monitored for fecal shedding of PEDv for four days until control animals began to demonstrate clinical signs of PEDv infection, at which time all piglets were humanely euthanized. Fecal swabs, and duodenum, ileum, jejunum, and cecum samples were collected from each animal and fixed in formalin. All fecal and tissue samples were analyzed for the presence of detectable PED virus by immunohistochemistry and PCR.

PEDv, log # g soil

What have we learned?

Manure Slurry Incubation: Manure limed to pH 10 and pH 12 for 1 and 10 h yielded no detectable PEDv RNA. Live swine bioassay results confirmed that these samples were not infective while control samples resulted in PEDv infection of piglets. These results indicate that a final manure slurry pH of 10 (equivalent to 50 lbs. of quicklime added to 1000 gallons manure slurry) is sufficient to reduce PEDv RNA to an undetectable concentration after 1 hour of contact time. All pigs receiving limed manure (pH 10 or 12 maintained for 1 or 10 h) during the live swine bioassay tested negative for PEDv infection while control pigs (un-limed treatment) all tested positive for PEDv infection (Figure 1). The pig bioassay results confirmed that the PCR assay is a reliable predictor for the presence of infectious PEDv in these matrices and that lime addition to achieve pH 10 for just one hour is sufficient to deactivate the virus in stored manure.

Soil Incubations: At the completion of the long-term (150-day) soil incubation, a subset of the frozen samples (LIME and CON soil samples collected on day 0 and 30) was selected for RNA extraction and qPCR analysis. The qPCR results from days 0 and 30 yielded no detectable PEDv RNA in either the limed or un-limed manure-amended soils (Figure 1). Furthermore, manure-amended soils did not differ from soil-only controls even though PEDv RNA was still detectable in the original manure slurry at high concentrations. No differences in PEDv abundance were detected on either day when initial soil moisture (10% vs 30% water holding capacity), incubation condition (MN vs. MO vs. OK), or soil type (silty clay loam and loamy fine sand) were varied. For these soils, the concentration of PEDv in limed or un-limed manure decreased immediately to a non-detectable level. These results indicate that manure-amended soil with pH 6.9 or greater is not a vector for transmission of the PED virus.

A consistent finding from all of the studies is that pH of media (slurry or soil) strongly influences PED virus survival.

Future Plans

Additional studies are underway to identify the lowest pH at which the PED virus is rendered non-infectious in slurry manure.

Corresponding author, title, and affiliation

Amy Millmier Schmidt, Assistant Professor, Departments of Biological Systems Engineering and Animal Science, University of Nebraska – Lincoln

Corresponding author email

aschmidt@unl.edu

Other authors

Stevens, E., A. Schmidt, D. Miller, J.D. Loy and V. Jin

Additional information

Dr. Amy Millmier Schmidt, corresponding author, can also be reach at (402) 472-0877.

Acknowledgements

Funding for this research was provided by the National Pork Board. Gratitude is extended to Ashley Schmit for assistance with laboratory activities and animal care. Special thanks to the Nebraska pork producers who granted access to their farms for collection of PEDv-positive manure.

Reducing Greenhouse and Ammonia Emissions from Manure Systems


Proceedings Home W2W Home w2w17 logo

Purpose             

Dairy manure systems produce greenhouse gas and ammonia emissions that contribute to climate change. There are many potential practices and management strategies that can reduce these emissions which can conserve nutrients and reduce environmental impacts. This work assesses different processing strategies, additives, and manure storage covers to reduce emissions from dairy manure systems.

What did we do? 

We completed three laboratory/field trials to assess emissions from manure systems. The first trial was to assess the greenhouse gas and ammonia emissions during storage and land application of manure that was processed with solid separation and digestion in combination with solid separation. A second trial assessed emissions and manure characteristics from storage with various commercial additives. The third study assessed ammonia emissions from digested manure storages with various biomass covers including raw wood, steam treated wood, and biochar produced from wood and corn cobs.

What have we learned? 

The results from the study indicate that separation and digestion result in significant reductions in greenhouse gas emissions. However, as expected, ammonia emissions following digestion are increased due to increased nitrogen mineralization. Results also indicate that separation alone had a similar impact to greenhouse gas emissions, but did not further reduce emissions following digestion. Commercially available products that are designed to be added to manure storages had little to no impact on emissions or manure characteristics for the conditions present in this study. Lastly, biochar was capable of reducing ammonia emissions significantly when applied as a cover. Although the biochar was capable of sorbing ammonical nitrogen, the results indicate that the physical barrier on the manure surface was the primary driver for the reduction in ammonia emissions.

Future Plans    

Following the outcomes of this work, information is being added to a dairy manure life cycle assessment to determine larger system wide impacts from changes in management practices or the inclusion of a processing system. In addition, work is being conducted to look at potential benefits that may be gained over a number of impact factors when manure management systems are optimized with other waste management systems from the municipal sector.

Corresponding author, title, and affiliation        

Rebecca Larson, Assistant Professor, University of Wisconsin-Madison

Corresponding author email    

rebecca.larson@wisc.edu

Other authors   

M.A. Holly, Agricutural Engineer at USDA ARS, J.M. Powell, Soil Scientist at USDA ARS, H. Aguirre-Villegas, Assistant Scientist at University of Wisconsin-Madison

Additional information 

Holly, M.A., R.A. Larson, M. Powell, M. Ruark, and H. Aguirre-Villegas. 2017. Evaluating greenhouse gas and ammonia emissions from digested and separated manure through storage and land application. Agriculture, Ecosystems & Environment, 239:410-419. http://www.sciencedirect.com/science/article/pii/S0959652616321953

Holly, M.A. and R.A. Larson. 2017. Effects of Manure Storage Additives on Manure Composition and Greenhouse Gas and Ammonia Emissions. Transactions of the ASABE, Accepted in Print.

Holly, M.A. and R.A. Larson. 2017. Evaluation of Biochar, Activated Biochar, and Steam Treated Wood as Dairy Manure Storage Covers for Ammonia Mitigation. In Review.

Acknowledgements       

This material is based upon work that is supported by the National Institute of Food and Agriculture, U.S. Department of Agriculture, under award number 2013-68002-20525. Any opinions, findings, conclusions or recommendations expressed in this publication are those of the author(s) and do not necessarily reflect the view of the U.S. Department of Agriculture.


The authors are solely responsible for the content of these proceedings. The technical information does not necessarily reflect the official position of the sponsoring agencies or institutions represented by planning committee members, and inclusion and distribution herein does not constitute an endorsement of views expressed by the same. Printed materials included herein are not refereed publications. Citations should appear as follows. EXAMPLE: Authors. 2017. Title of presentation. Waste to Worth: Spreading Science and Solutions. Cary, NC. April 18-21, 2017. URL of this page. Accessed on: today’s date.
Intake and Digestibility of Nutrients, Manure Production, and Nitrogen Excretion as Affected by Nonfiber Carbohydrate Sources and Rumen Degradable Protein Levels in the Diet of Dairy Cows


Proceedings Home W2W Home w2w17 logo

Purpose           

This study was to determine the effects of nonfiber carbohydrate (NFC) sources and rumen degradable protein (RDP) levels in diet on apparent total-tract nutrient digestibility, manure production and nitrogen (N) excretion in dairy cows.

What did we do?         

Eighteen mid-lactation multiparous Holstein cows were used in this split-plot study. Cows were randomly assigned to 9 or 11% RDP (16.5% crude protein (CP) for all diets, dry matter (DM) basis) as main plots and cows within each RDP level were further assigned to 3 NFC treatments, including (DM basis): 10% dextrose (D), 5% dextrose, 5% purified starch (DS), and 10% purified starch (S). Each period lasted 4 weeks and samples were collected during the fourth week.

What have we learned? 

There was no NFC x RDP interaction for response variables. Intake (kg/d) responded linearly for DM (24.3, 24.2, and 22.6), organic matter (22.7, 22.6, and 21.1), CP (4.0, 3.9, and 3.7), and neutral detergent fiber (7.0, 6.9, and 6.5) for D, DS and S, respectively (all P < 0.01). Same pattern was observed for the amount of nutrient digested, but apparent total-tract digestibility (%) was unaffected by dietary treatments, averaging 70.4, 71.8, 72.2, and 41.9 for DM, organic matter, CP and neutral detergent fiber, respectively. Fecal DM excretion (kg/d) was 7.2, 7.2, and 6.7 for D, DS, and S, respectively (P = 0.02), but urine volume (29.3 L/d) and urine N (254 g/d) were not affected. However, fecal N (180, 179, and 173 g/d) decreased, and N use efficiency (100x Milk N/N intake; 26.9, 27.4, and 29.3 %) increased linearly as starch in diet increased. There was no dietary effect on milk protein production (173 g/d). In this study, the substitution of starch for dextrose in the diet reduced DM and nutrient intake, did not alter digestibility, but reduced fecal DM and N excretions.

Future Plans   

Future studies will further look into the effect of carbohydrate and nitrogen in diet on nutrient use efficiency, manure excretion, as well as methane emission in dairy cows.

Corresponding author, title, and affiliation      

Michel Wattiaux, Professor, Department of Dairy Science, University of Wisconsin-Madison

Corresponding author email  

wattiaux@wisc.edu

Other authors  

Fei Sun, PhD candidate, Department of Dairy Science, University of Wisconsin-Madison -Matias Aguerre, Assistant Professor, Department of Animal and Veterinary Sciences, Clemson University

Additional information               

Fei Sun is the presenting author of this presentation and can be contacted for questions regarding this study via fei.sun@wisc.edu

Acknowledgements      

This study was funded by the Dairy Coordinated Agricultural Project

Results of Nutrient Recovery System Installed on Large Scale Dairy Operation After 2-years of Operation


Proceedings Home W2W Home w2w17 logo

*Do not make slides downloadable

Purpose 

For centuries, farmers have disposed of manure by simply spreading it on the land. It is a natural fertilizer. Today, that practice is no longer considered the best solution. Field spreading is now understood to contribute to a growing global problem of the pollution of water, soil, and air. Consequently, U.S. dairy farmers face increased fiscal and operational pressure from the progression of ever tightening environmental regulations. Conventional handling of manure also imposes a number of operational challenges (limitations for storage, land application and irrigation, settlement in lagoons, high manure hauling costs, etc.) and typically requires a relatively large land base to allow adequate nutrient management.

In Indiana, a dairy that was daily producing thousands of tons of livestock waste was investigating how technology could capture the valuable nutrients remaining in their cow manure after it had gone through the farm’s anaerobic digestion process. Their goal was to convert the manure/digestate into a nutrient rich cake that could be easier managed and made into fertilizer, and the liquid clean enough to be used unrestricted for land application.

The farm’s key operational deliverables were 1) to reduce the manure’s handling and transportation costs, 2) allow for precision applications of the processed manure as carbon-based fertilizer and 3) allow for re-use of nutrient reduced liquid for field irrigation.

What did we do? 

The dairy farm chose to implement a nutrient recovery technology from Trident Processes LLC. The technology separates the manure/digestate into three fractions: 1) cellulosic fiber, 2) a concentrated cake of nutrient enriched solids, and 3) water with about 1% remaining solids.

Trident’s turn-key system, consisting of different mechanical and chemical components, processes the manure and diverts each separated fraction into their separate spaces. Sensors and programmable controls (PLC) allow for smooth operation, requiring minimal operator attendance. The entire system can be monitored, controlled and diagnosed remotely.

The manure is fed into the system following the digestion process. The initial step is the extraction of the large fiber, which is done via a rotary screen conditioner. The wetted material separates, with the effluent water and fine solids sifting down through the screen while the larger fiber is retained. This step is critical as it ensures the fine particles, which contain the nutrients, are sent down stream for further treatment.

FIBER: The extracted fiber is sent to a screw press for further dewatering. This renders it as a 30% dry cellulosic fiber biomass that is ideal for recycling as cow bedding or other biomass use. Any liquid squeezed from the fiber is diverted to join the fine solids stream.

SOLIDS: The effluent water and solids are sent to a dissolved air flotation (DAF) tank. Polymerization ensures effective flocculation of the feedstock, resulting in a concentration of the nutrient rich particles that float to the surface. The sludge formed on the surface is skimmed off the top and gravity fed into a multi-disc press for second-stage dewatering. The press gently dewaters and thickens the recovered solid/nutrient sludge into a 25% solids, nutrient rich cake.

WATER: The final effluent water, now nutrient reduced, contains less than 1.2% solids and is sent to the lagoon for storage. The water is then reused for irrigation through efficient pivot systems or as operational water on the farm.

What have we learned? 

By implementing Trident’s Nutrient Recovery System, the farms’ objectives have been met and/or exceeded. After running for nearly two years the system is producing the following statistics:

• Fully automated operation requiring about 1 hr/shift for operator attendance (visual checks)

• 98% system uptime

• Polymer costs: $0.06 – $0.08/day/cow

• Reduction of handling and irrigation costs: $ 0.01/gal (conventional) vs $0.003/gal (center pivot)

• $250,000/yr electrical power savings with MD Press vs. centrifuge

• 73,000+ ton/yr nutrient cake produced

• 81% P, 70% organic N (54% TKN), and 20% K is the average nutrient capture rate

• 1% (max.) solids in the effluent water sent to lagoons

• 99% Suspended solids captured

Future Plans 

Dairy farm: A fertilizer plant will go live in the near future, allowing the farm to sell their concentrated nutrients to the plant as feedstock for custom fertilizer production.

Technology provider: 2nd Phase effluent treatment to capture and retain the solid and nutrient fraction of the existing process, allowing to meet stream discharge standards and comply with BOD / COD levels. Bench scale testing is completed. Farm scale pilot testing is scheduled to run from March 2017-December 2017.

Corresponding author, title, and affiliation       

Richard Shatto (Senior Partner at Point Nexus Consulting), Frank Engel (Director Marketing at KPD Consulting Ltd.)

Corresponding author email 

frank.engel@kpdconsulting.ca

Additional information 

https://youtu.be/PvaTGmyws-w (Carl Ramsey’s presentation at Indiana Dairy Forum)

http://www.progressivedairy.com/topics/manure/prairie-s-edge-dairy-on-pa… (Progressive Dairyman article)

http://tridentprocesses.com/documents/case-study-trident-nutrient-recove… (Newtrient case study)

https://are.wisc.edu/manure-processing/ (manure management project with University of Wisconsin)

http://www.foodqualityandsafety.com/article/nutrient-recovery-improves-s… (Nutrient Recovery Improves Sustainability article in Food Quality & Safety Magazine)

Acknowledgements       

Carl Ramsey, Environmental Manager at Prairie’s Edge Dairy Farm

Soil Net LLC, Dr. Aicardo Roa (strategic partner for chemical separation process)

Leap Tech, R.C. Ludke (strategic partner for automation)

Mobile Struvite System for Nutrient Extraction from Dairy Manure


Proceedings Home W2W Home w2w17 logo

Purpose            

Use of dairy manure as the sole source of nitrogen can lead to increased amounts of P in soil. In addition, P reserves around the world are finite and technologies are needed to effectively capture excess P in manure for the purpose of recycling to areas and crops in need of P.

What did we do?          

During the past decade we have adapted a fluidized bed technology to effectively recover P from liquid dairy manure in the form of struvite (magnesium mono-ammonium phosphate). A starter amount of struvite is placed at the bottom of an inverted cone that forms the fluidized bed for producing additional struvite. Manure that has been pre-treated is pumped up through the bottom of the cone to create the swirling action of the fluidized bed. To effectively form struvite, P in manure has to be dissociated from Ca, before subsequently binding with Mg and NH3. The fluidized bed technology was originally demonstrated with swine manure which is relatively lower in Ca compared to dairy manure. Due to the greater content of Ca in dairy manure we determined that it was necessary to lower the pH in dairy manure so that P could be free of Ca and available to form struvite. The pH has been most successfully lowered with use of sulfuric acid. As the low-pH manure is pumped up through the cone, ammonia is injected into the bottom of the cone to raise the pH and promote formation of struvite. The struvite we produced has been used as an effective fertilizer for growth of triticale, oats, corn silage and alfalfa. 

Picture of fluidized bed technology

What have we learned?            

Agriculture and human waste water industries have shown interest in this technology for the capture of P. The technology has been demonstrated as stationary units at three dairies, and has also been adopted by the human waste water plants. Phosphorus removal from dairy manure has been greater than 50%. Greenhouse and field plot studies compared struvite to mon-ammonium phosphate (MAP) and results indicated that struvite was comparable or superior compared to MAP in acidic soils and inferior to MAP in alkaline soils.

Future Plans    

Our current project will involve the demonstration of a mobile system that can be easily transported from dairy to dairy on a 24 foot trailer. Struvite that is captured from each dairy will be used in agronomic studies to promote a nutrient recycling relationship.

Corresponding author, title, and affiliation        

Joe Harrison, Professor, Washington State University

Corresponding author email    

jhharrison@wsu.edu

Other authors   

Keith Bowers and Elizabeth Whitefield

Additional information              

http://www.puyallup.wsu.edu/dairy/nutrient-management/default.asp

Acknowledgements       

This project is funded USDA NRCS CIG #69-3A75-17-51.

Characterization of litter produced in turkey production operations in Virginia

Proceedings Home W2W Home w2w17 logo

Purpose

Turkey production is a partnership between companies (integrators) and private farmers (contractors). The companies own the birds while the farmers raise birds and manage litter. Generally, a turkey farm makes two products, birds for meat and litter. Mature birds are harvested by the companies for processing at designated regional plants. The litter is rich in nitrogen (N), phosphorus (P) and potassium (K), and is usually removed from production houses and used as fertilizer for crops and forage production. If not used and/or managed properly, nutrients in turkey litter, like any other animal manure in general, may result in water quality degradation, especially in sensitive ecosystems such as the Chesapeake Bay (Bay).

This project was initiated to gather locally based turkey litter generation and nutrient content data to develop equations and coefficients to be used as input in Phase 6.0 Chesapeake Bay Program Watershed Model. Using equations derived from locally based data, simultaneously improves the accuracy and quality of annual nutrients (N, P) mass estimates inputs and provides better representation of turkey production operations in the Phase 6.0 Bay watershed modeling tools. The results reported here focused on the mass generation rate and nutrient content of litter from turkey production systems in Virginia.

What did we do?

The first step was to determine and describe the common turkey production systems and bird types in Virginia, and to a large extent, the Bay watershed. Two production systems (1- and 2-stage) and five (hen, heavy hen, heavy tom, breeders, brooder/poult) bird types were identified. Then, we used a combination of farmer and integrator surveys to identify bird and production type for the period 2012 to 2016. The information collected during the survey included bird and production type, number of birds placed, number of birds harvested, average bird harvest/market weights, mass of litter removed from houses at total clean out, number of flocks per cleanout, and number of flocks raised per year. The mass of litter generated was estimated by relating the estimated bird numbers, mass of litter removed from buildings, and average bird market weight. Historical nutrient data was obtained from the manure nutrient management program database maintained by the Virginia Department of Conservation and Recreation. Statistical analysis was conducted on the data collected to determine if there was any differences in mass of litter generated and litter nutrient concentrations. A one-way analysis of variance (ANOVA) was performed to test for significant differences group means and the Turkey’s HSD test to identify which groups were different. Differences were considered significant at p < 0.05.

What have we learned?

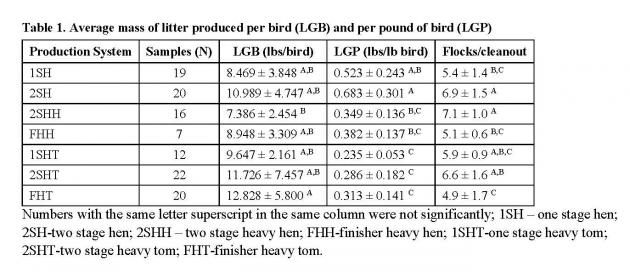
We found differences in the mass of litter generated among bird types. Consequently, bird types were grouped based on the statistical similarity of their means and averages of litter generation nutrients for the groups calculated and proposed as factors (Table 1) to use in calculated annual nutrient loads in the Phase 6.0 Chesapeake Bay Program Watershed Model. The overall mean for mass of litter in pounds (lbs) generated per bird and litter generated per pound of bird were 10.263 (±4.973) and 0.407 (±0.198), respectively.

table 1 average mass of litter produced per bird

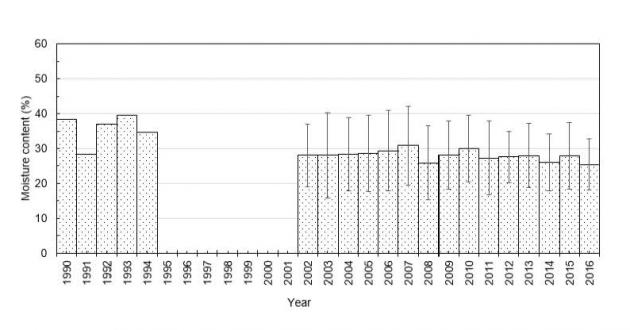
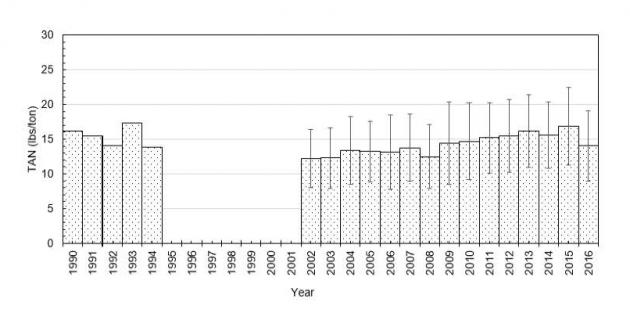
Litter generation rates per bird are about 48 to 77 % less than ASABE 2005 tabulated values. Nutrient content of litter has remained stable since 2000 (Figure 1). The ratio of ammonia nitrogen to total nitrogen and total nitrogen to total phosphorus has remained stable at 0.21 and 1.37, respectively. Conversely, the moisture content has been stable and seem to be dropping over time (Figure 1).

Figure 1. Turkey litter nitrogen (TKN), ammonium (TAN), phosphorus (TP), and moisture content from operations in Virginia between 1990 and 2016.

Figure 1. Turkey litter nitrogen (TKN), ammonium (TAN), phosphorus (TP), and moisture content from operations in Virginia between 1990 and 2016.

Figure 1. Turkey litter nitrogen (TKN), ammonium (TAN), phosphorus (TP), and moisture content from operations in Virginia between 1990 and 2016.

Figure 1. Turkey litter nitrogen (TKN), ammonium (TAN), phosphorus (TP), and moisture content from operations in Virginia between 1990 and 2016.

Figure 1. Turkey litter nitrogen (TKN), ammonium (TAN), phosphorus (TP), and moisture content from operations in Virginia between 1990 and 2016.

Future Plans

Continue data collection to characterize turkey litter generation and nutrient contents in Virginia and expanded to other regions of the Bay watershed. Establish an ongoing system beyond the present study to accept farm specific bird production data summarized to eliminate disclosure of confidential business information and used as the foundation for improving litter generation rate and nutrient concentration goals.

Corresponding author, title, and affiliation

Jactone A. Ogejo, Biological Systems Engineering Department, Virginia Tech

Corresponding author email

arogo@vt.edu

Acknowledgements

Timothy Sexton and Bobby Long, Virginia Department of Conservation and Recreation; Mark Dubin, Chesapeake Bay Program; Jordan Kristoff and Austin Shifflet, Virginia Tech

The authors are solely responsible for the content of these proceedings. The technical information does not necessarily reflect the official position of the sponsoring agencies or institutions represented by planning committee members, and inclusion and distribution herein does not constitute an endorsement of views expressed by the same. Printed materials included herein are not refereed publications. Citations should appear as follows. EXAMPLE: Authors. 2017. Title of presentation. Waste to Worth: Spreading Science and Solutions. Cary, NC. April 18-21, 2017. URL of this page. Accessed on: today’s date.

Developing a Comprehensive Nutrient Management Plan (CNMP)

Proceedings Home W2W Home w2w17 logo

Purpose

Livestock producers are presented with a number of challenges and opportunities. Developing a quality Comprehensive Nutrient Management Plan (CNMP) can effectively help landowners address natural resource concerns related to soil erosion, water quality, and air quality from manure management. As livestock operations continue to expand and concentrate in certain parts of the country, utilizing a CNMP becomes even more important. Following the NRCS 9-step planning process is critical in developing a good plan. Effective communication is a key element between all parties involved in the planning process. A CNMP documents the decisions made by the landowner for the farmstead area, crop and pasture area, and nutrient management. Information will cover the elements essential for developing a quality CNMP.

What did we do?

Since the CNMP documents the records of decisions by the landowner, it has to be organized in such a fashion that it is understandable to and usable by the landowner. The CNMP is the landowner’s plan. Therefore, the role of the planner is to help landowners do the things that will most benefit them and the resources in the long run. This will take both time and effort. To provide consistency with other conservation planning efforts within NRCS, CNMPs following the same process outlined in the National Planning Procedures Handbook. There are several items that are essential for a quality CNMP to be developed:

• Have a good understanding of potential resource concerns especially soil erosion, water quality and air quality.

• Make the appropriate number of site visits. Trying to do this from the office will likely lead to a poor quality CNMP that may not be implemented.

• Address resource concerns for the Farmstead and Crop and Pasture areas.

• Ensure that all nutrient sources are addressed.

• Follow the 9 steps of planning.

• Decisions are agreed upon by the landowner. The CNMP reflects the landowner’s record of decisions.

• Follow-up to address any questions or concerns.

• Update as necessary. A CNMP is not a static document.

Field

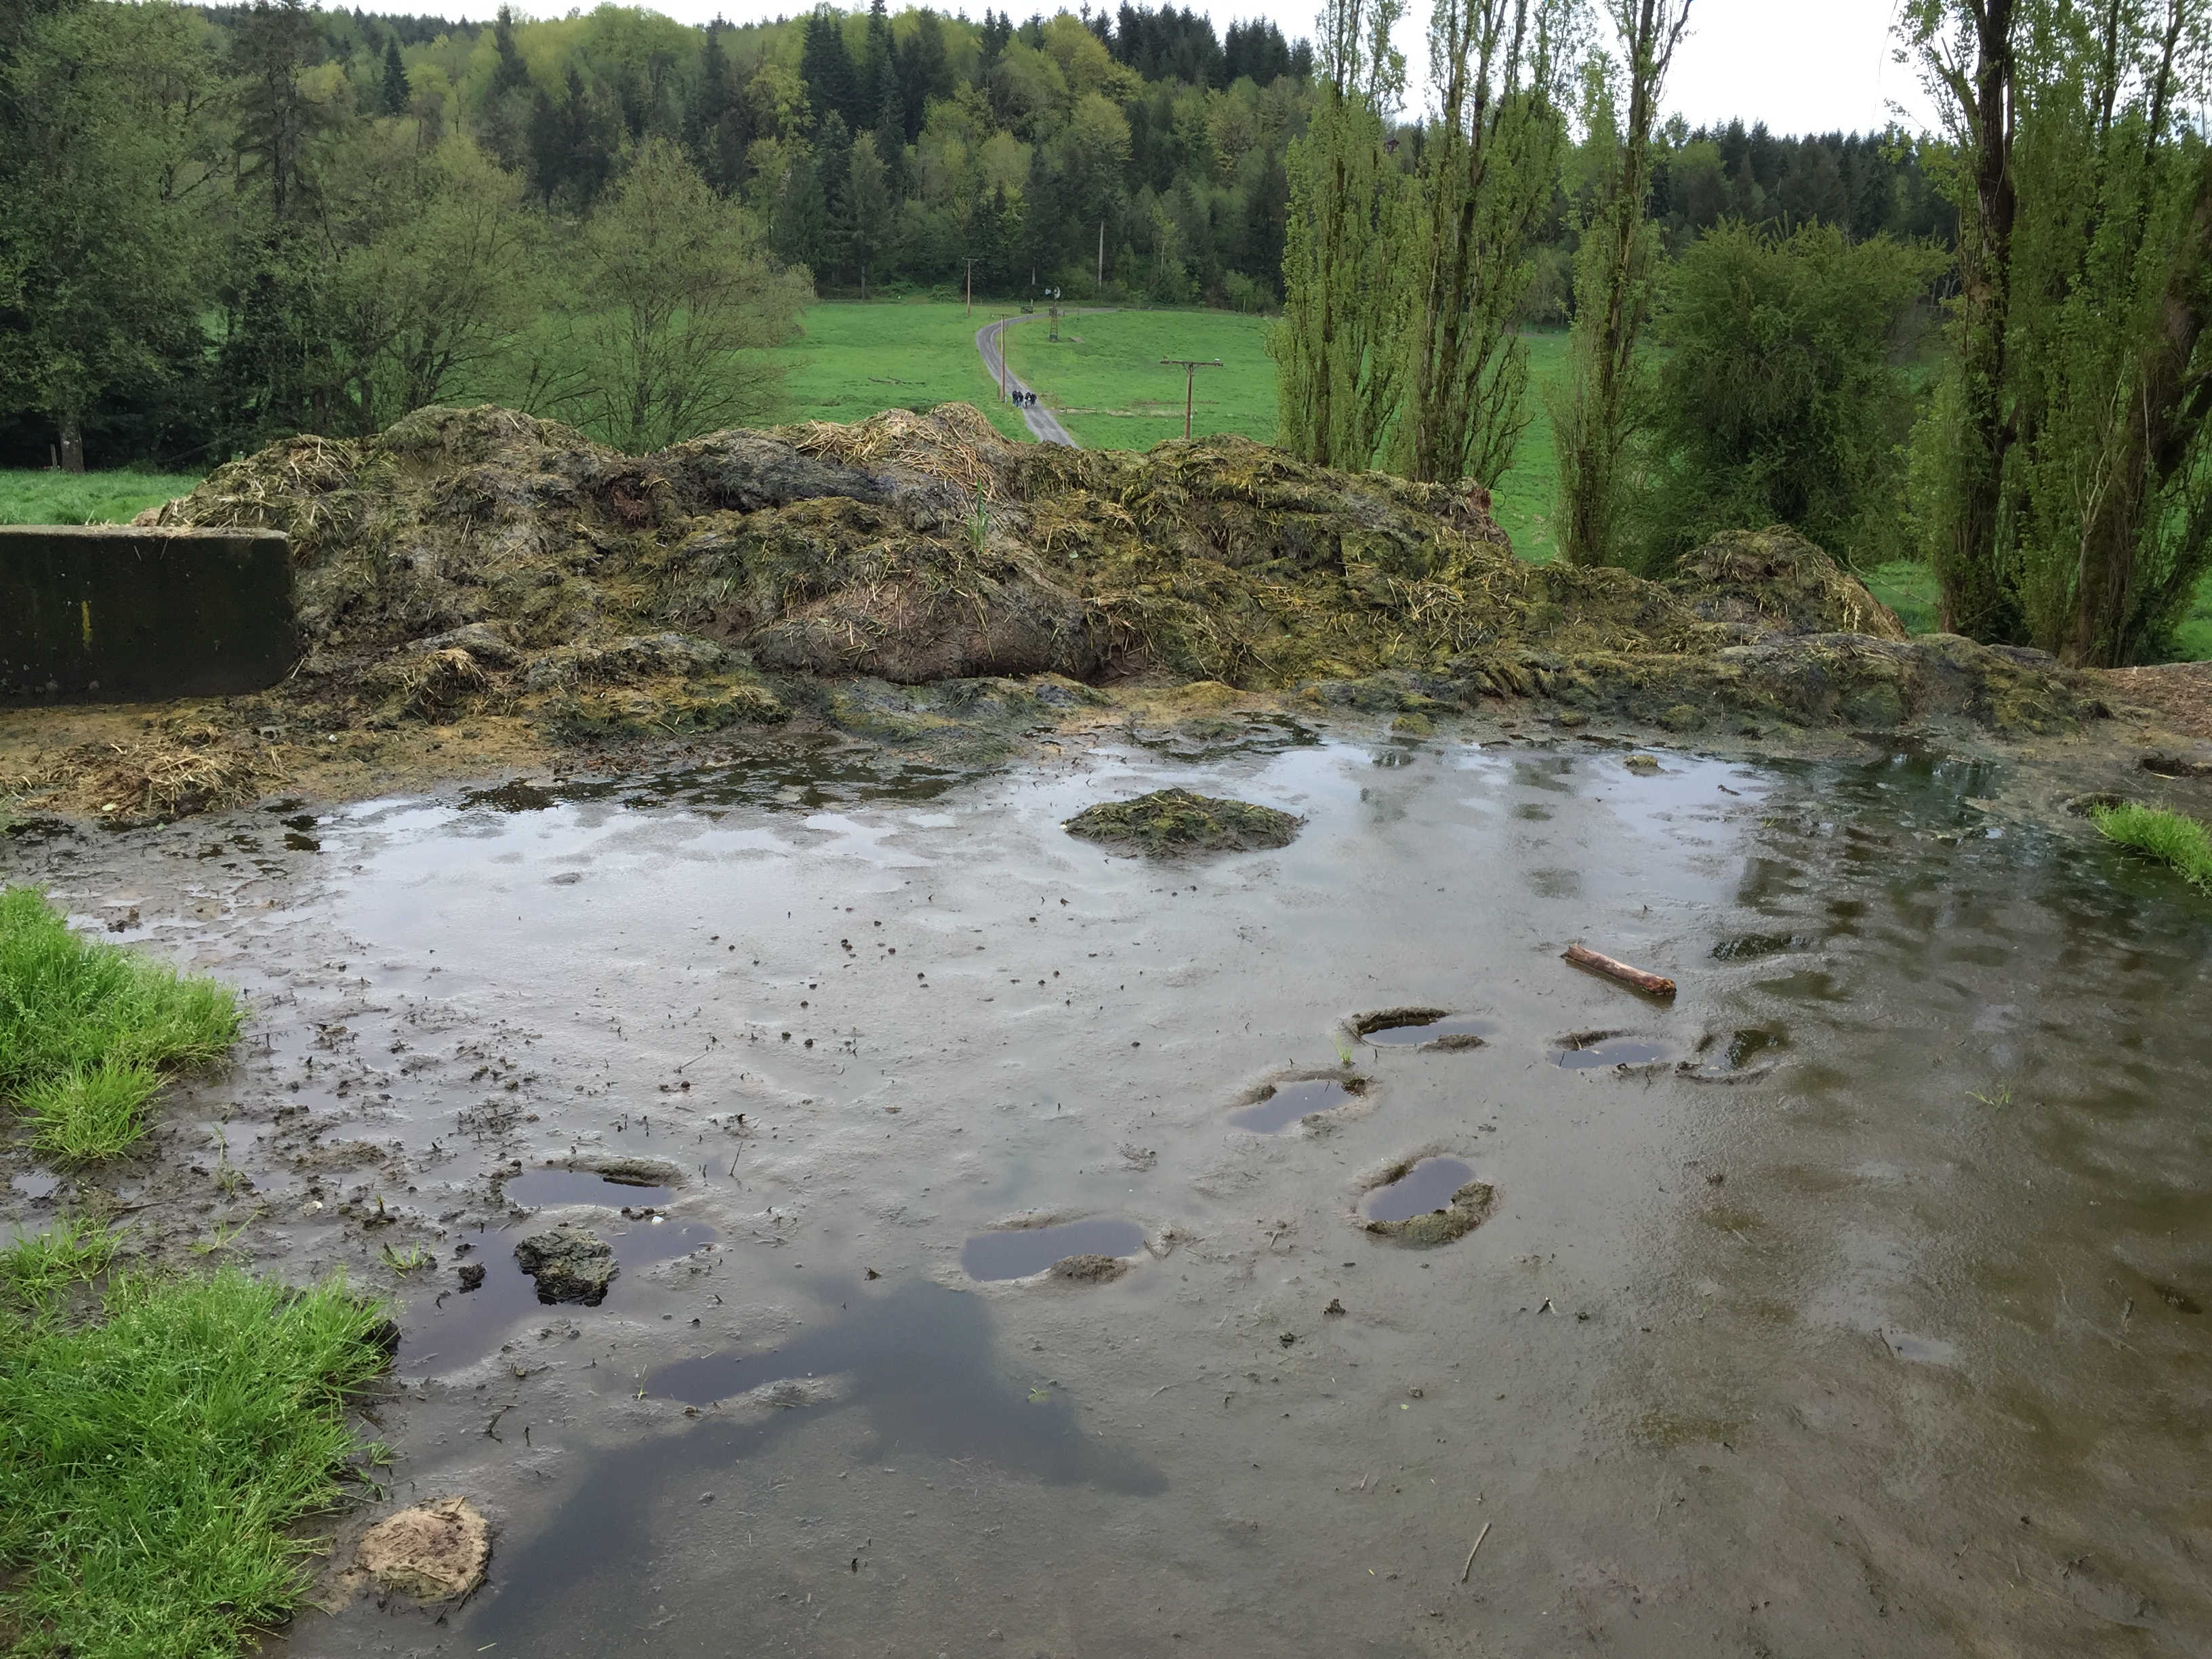
Land application of animal manure without proper land treatment practices

Muddy field with standing water

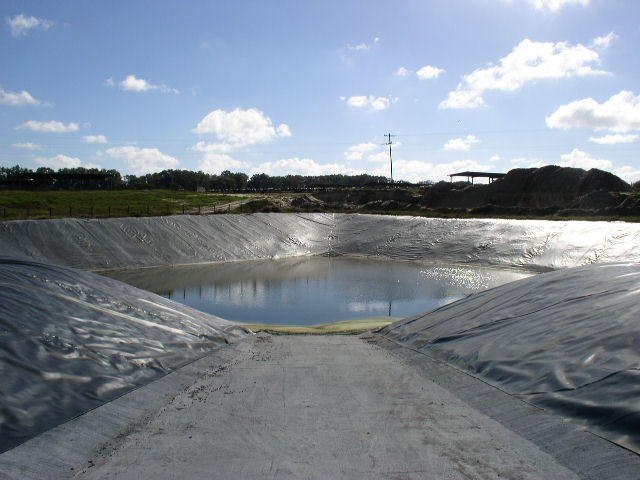
Proper animal manure storage required to address water quality issues

Picture of lined water bed

Evaluation of storage area to adequately address surface and subsurface
water quality issues

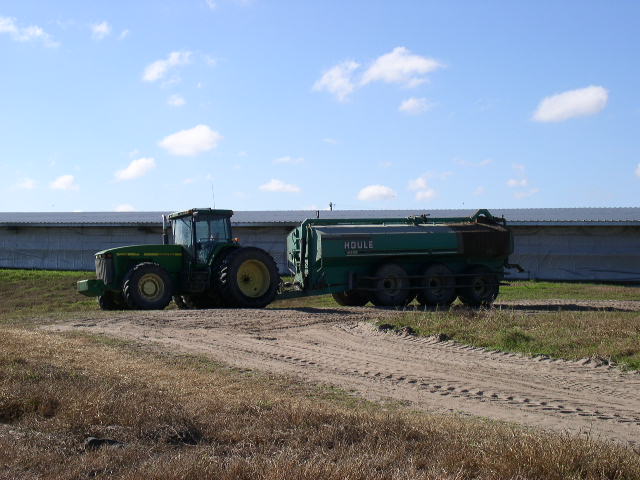
Picture of tractor and tanker spreader

Land application and nutrient management are critical elements for a
properly prepared CNMP

What have we learned?

The quality of CNMPs varies greatly across the country. Some were becoming so large that landowners were having difficulty finding the activities that needed to be completed. The revised CNMP format and process following the NRCS Conservation Planning approach should improve both the quality and usability of the plans developed. Due to statutes in the Farm Bill, all conservation practices recorded in the record of decision of the CNMP, whether receiving financial assistance or not, must be implemented by the end of the established contract period between the landowner and NRCS. Therefore it is important to only include the practices that are going to be implemented. CNMPs should be periodically updated to account for operational changes such as animal numbers, cropping systems, or land application methods.

Future Plans

The CNMP planning process will be evaluated to determine whether landowner objectives are being met and resource concerns properly addressed. Additional evaluations will look at the consistency of the plans generated across the country and the usability by landowners.

Corresponding author, title, and affiliation

Jeffrey P. Porter, P.E.; National Animal Manure and Nutrient Management Team Leader, USDA-Natural Resources Conservation Service

Corresponding author email

jeffrey.porter@gnb.usda.gov

Additional information

References

USDA-NRCS General Manual – Title 190, Part 405 – Comprehensive Nutrient Management Plans

USDA-NRCS Handbooks – Title 180, Part 600 – National Planning Procedures Handbook

Code of Federal Register (CFR) Title 7, Part 1466 – Environmental Quality Incentives Program (1466.7 EQIP Plan of Operations and 1466.21 Contract Requirements)

Webinar

Comprehensive Nutrient Management Plans and the Planning Process – http://www.conservationwebinars.net/webinars/comprehensive-nutrient-management-plans-and-the-planning-process/?searchterm=cnmp

The authors are solely responsible for the content of these proceedings. The technical information does not necessarily reflect the official position of the sponsoring agencies or institutions represented by planning committee members, and inclusion and distribution herein does not constitute an endorsement of views expressed by the same. Printed materials included herein are not refereed publications. Citations should appear as follows. EXAMPLE: Authors. 2017. Title of presentation. Waste to Worth: Spreading Science and Solutions. Cary, NC. April 18-21, 2017. URL of this page. Accessed on: today’s date.
What’s New with Comprehensive Nutrient Management Plans (CNMPs)?

Proceedings Home W2W Home w2w17 logo

Purpose

A Comprehensive Nutrient Management Plan (CNMP) is a management plan to utilize nutrients and to manage the collection, handling, storage, application, & utilization of animal waste. The purpose of the plan is to address soil erosion, water quality, and air quality concerns. Even though a CNMP is not a regulatory document, portions can potentially be used in the permitting process. It is meant to be a dynamic plan to help the producer’s operation to be sustainable. Landowner of animal feeding operations (AFO’s) that receive technical and/or financial assistance from NRCS are required to have a CNMP. This includes dairies, beef feedlots, poultry, and swine operations. Land application of manure is not a requirement. There are no animal numbers thresholds for a CNMP.

What did we do?

In 1999 the Unified National Strategy for Animal Feeding Operations directed USDA and EPA to work together to address environmental issues with AFO’s. The CNMP was developed as a voluntary way for a landowner to take action. The original document had a ten part format and was truly comprehensive. Any planner or engineer associated with the plan had to sign it. Developing a CNMP in this format was difficult and time consuming and in some cases the document became so large in size that no one updated them.

What have we learned?

In October 2015 the format changed back to a plan that is more consistent with a conservation plan, recording the decisions of the landowner/cooperator with regard to managing waste and utilizing the nutrients.

The plan now has a four part format. The first part is the signature page where the NRCS representative and the landowner sign confirming the decisions. Section one follows the signature page and documents decisions with regard to the Production Area (Farmstead). It includes maps, animal inventory, and records of decisions for the production area only. Section two documents the decisions with regard to the Land Treatment Area (Crop and Pasture). It contains maps, resource assessments, implementation requirements and records of decision for the land treatment areas. The third section documents decisions with regard to Nutrient Management. This includes risk analyses, setbacks, nutrient applications, and field balances.

For livestock operations with greater than 300 animal units a printout of the National Air Quality Site Assessment tool (NAQSAT) is now required as supporting documentation in the CNMP. It is to increase awareness of air quality issues that may be addressed on farm.

Several parts of the original format are not included in the current format. This includes the Operation and Maintenance plan and the Emergency Response plan. Both would now be found in the case file and not in the CNMP itself.

Picture of a field

Looking at crop residue.

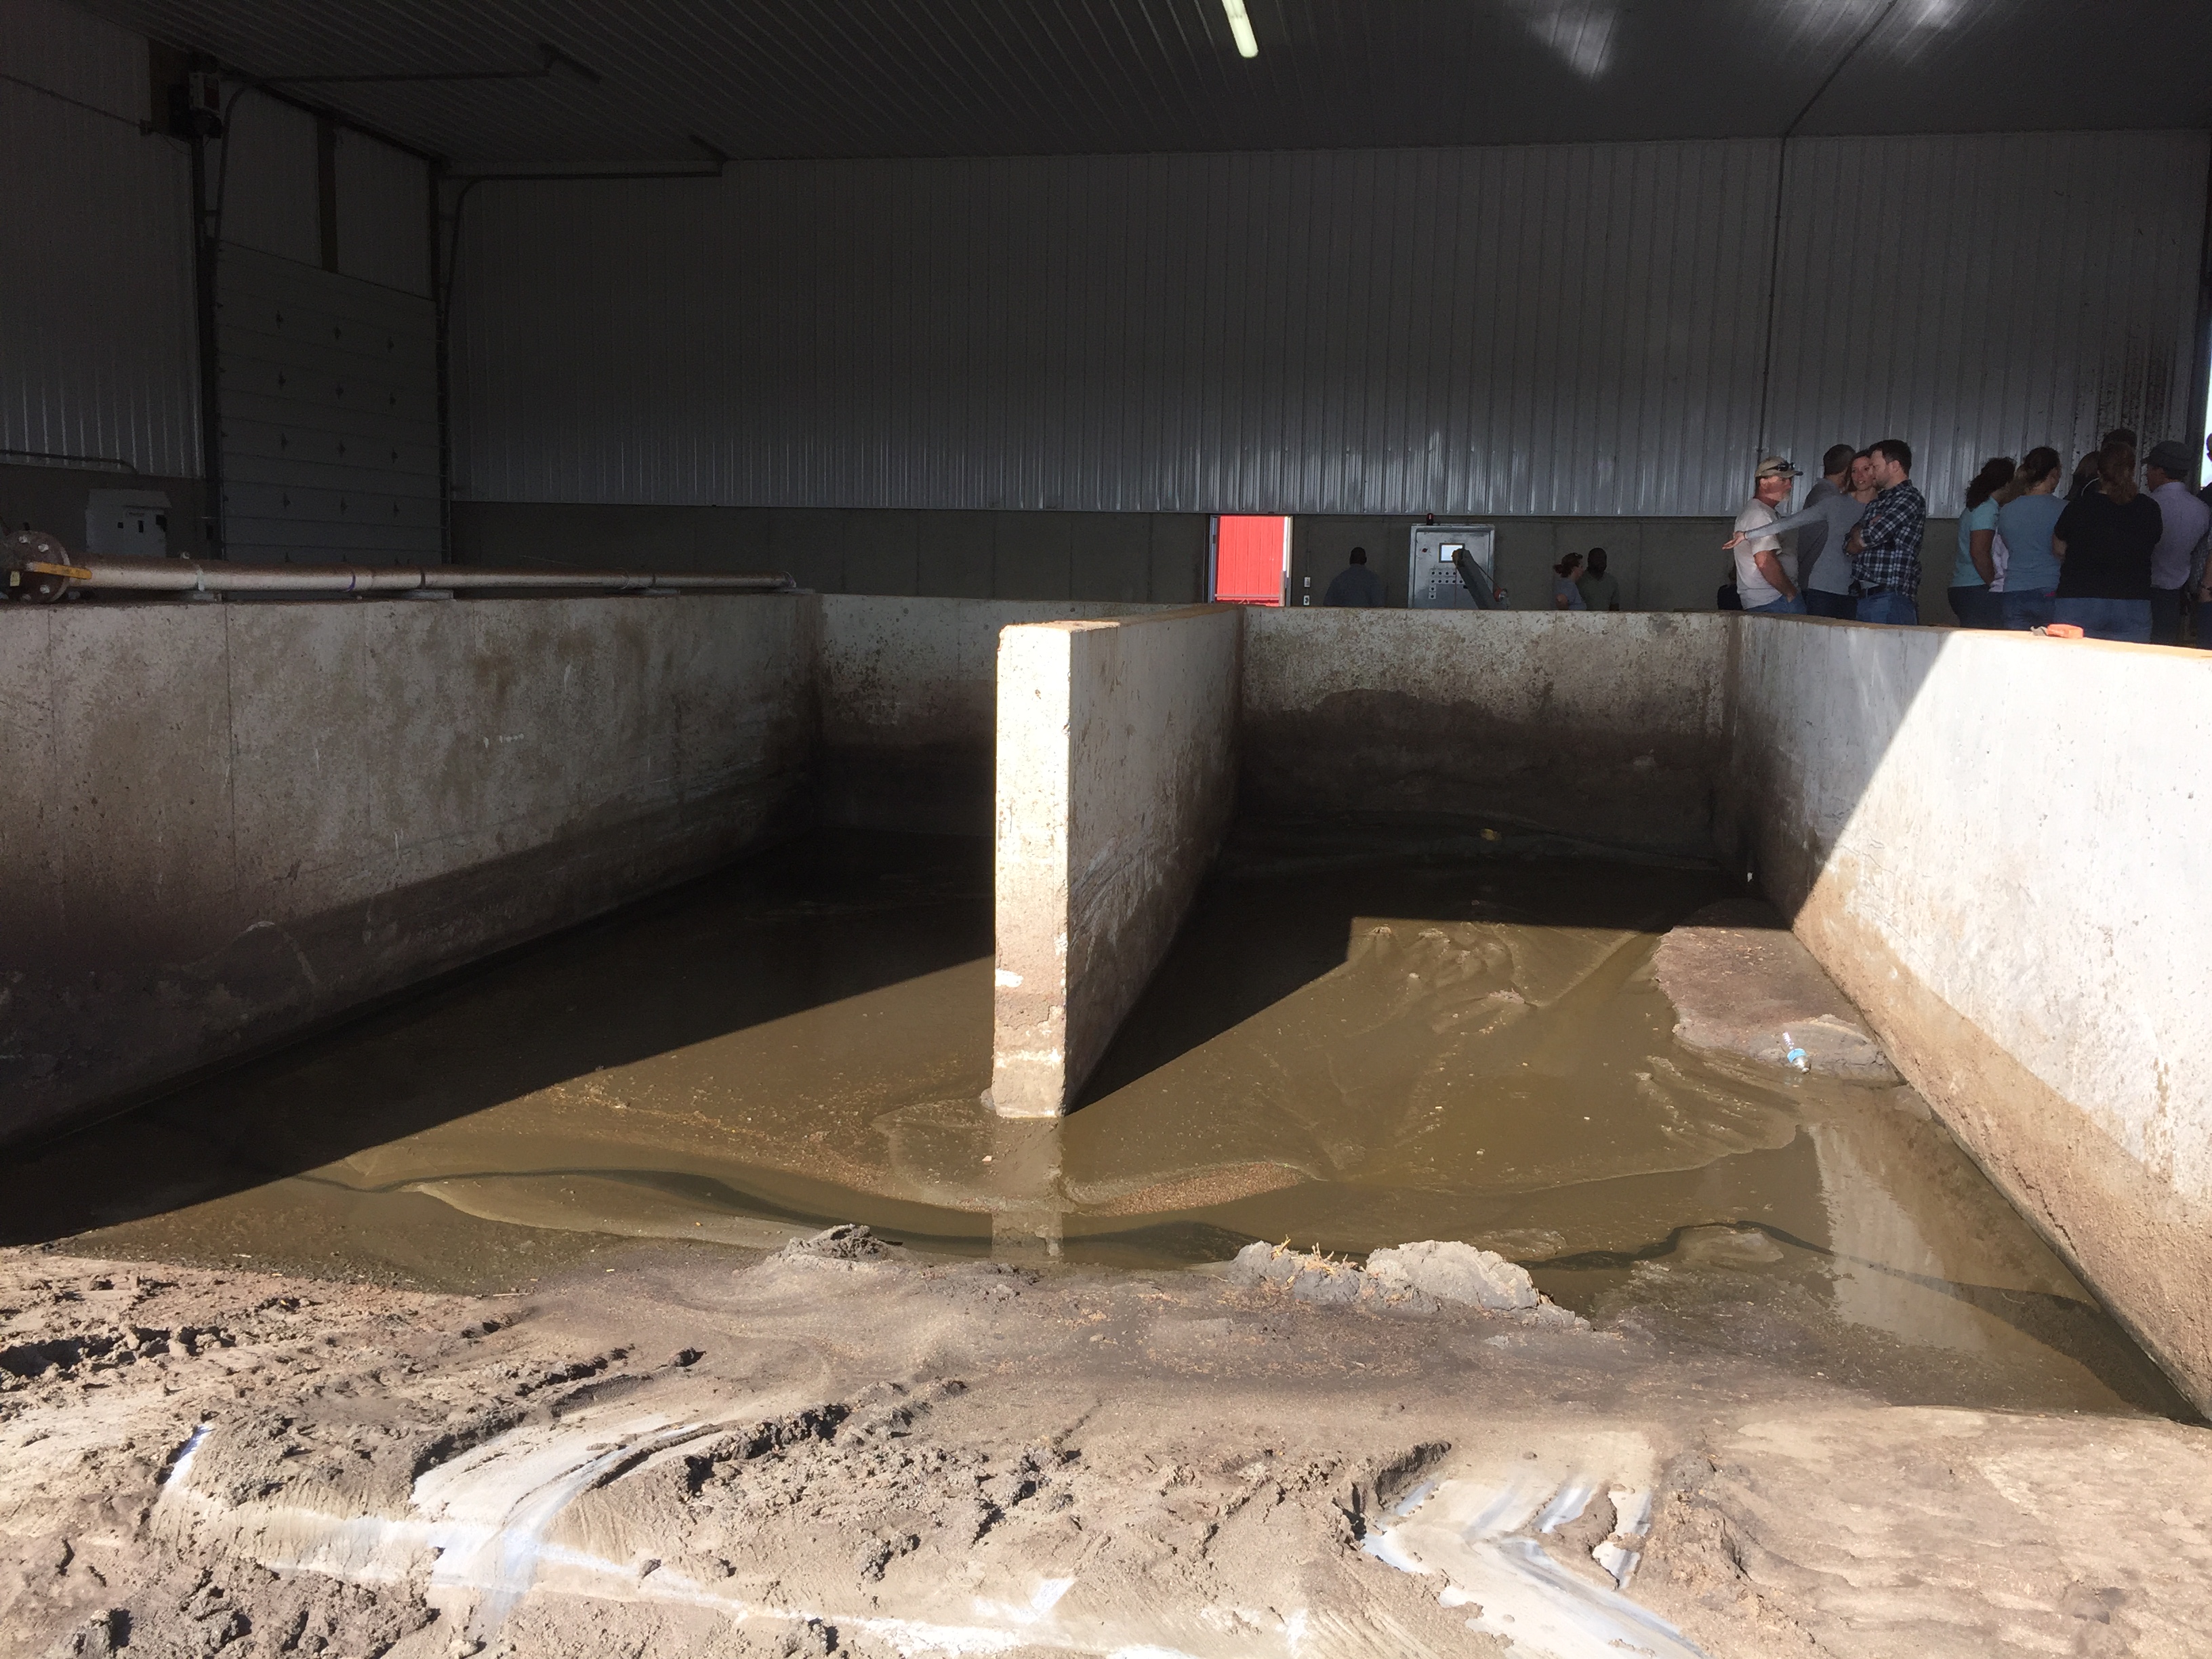
Slurry containment

Evaluating solid separation on the farmstead.

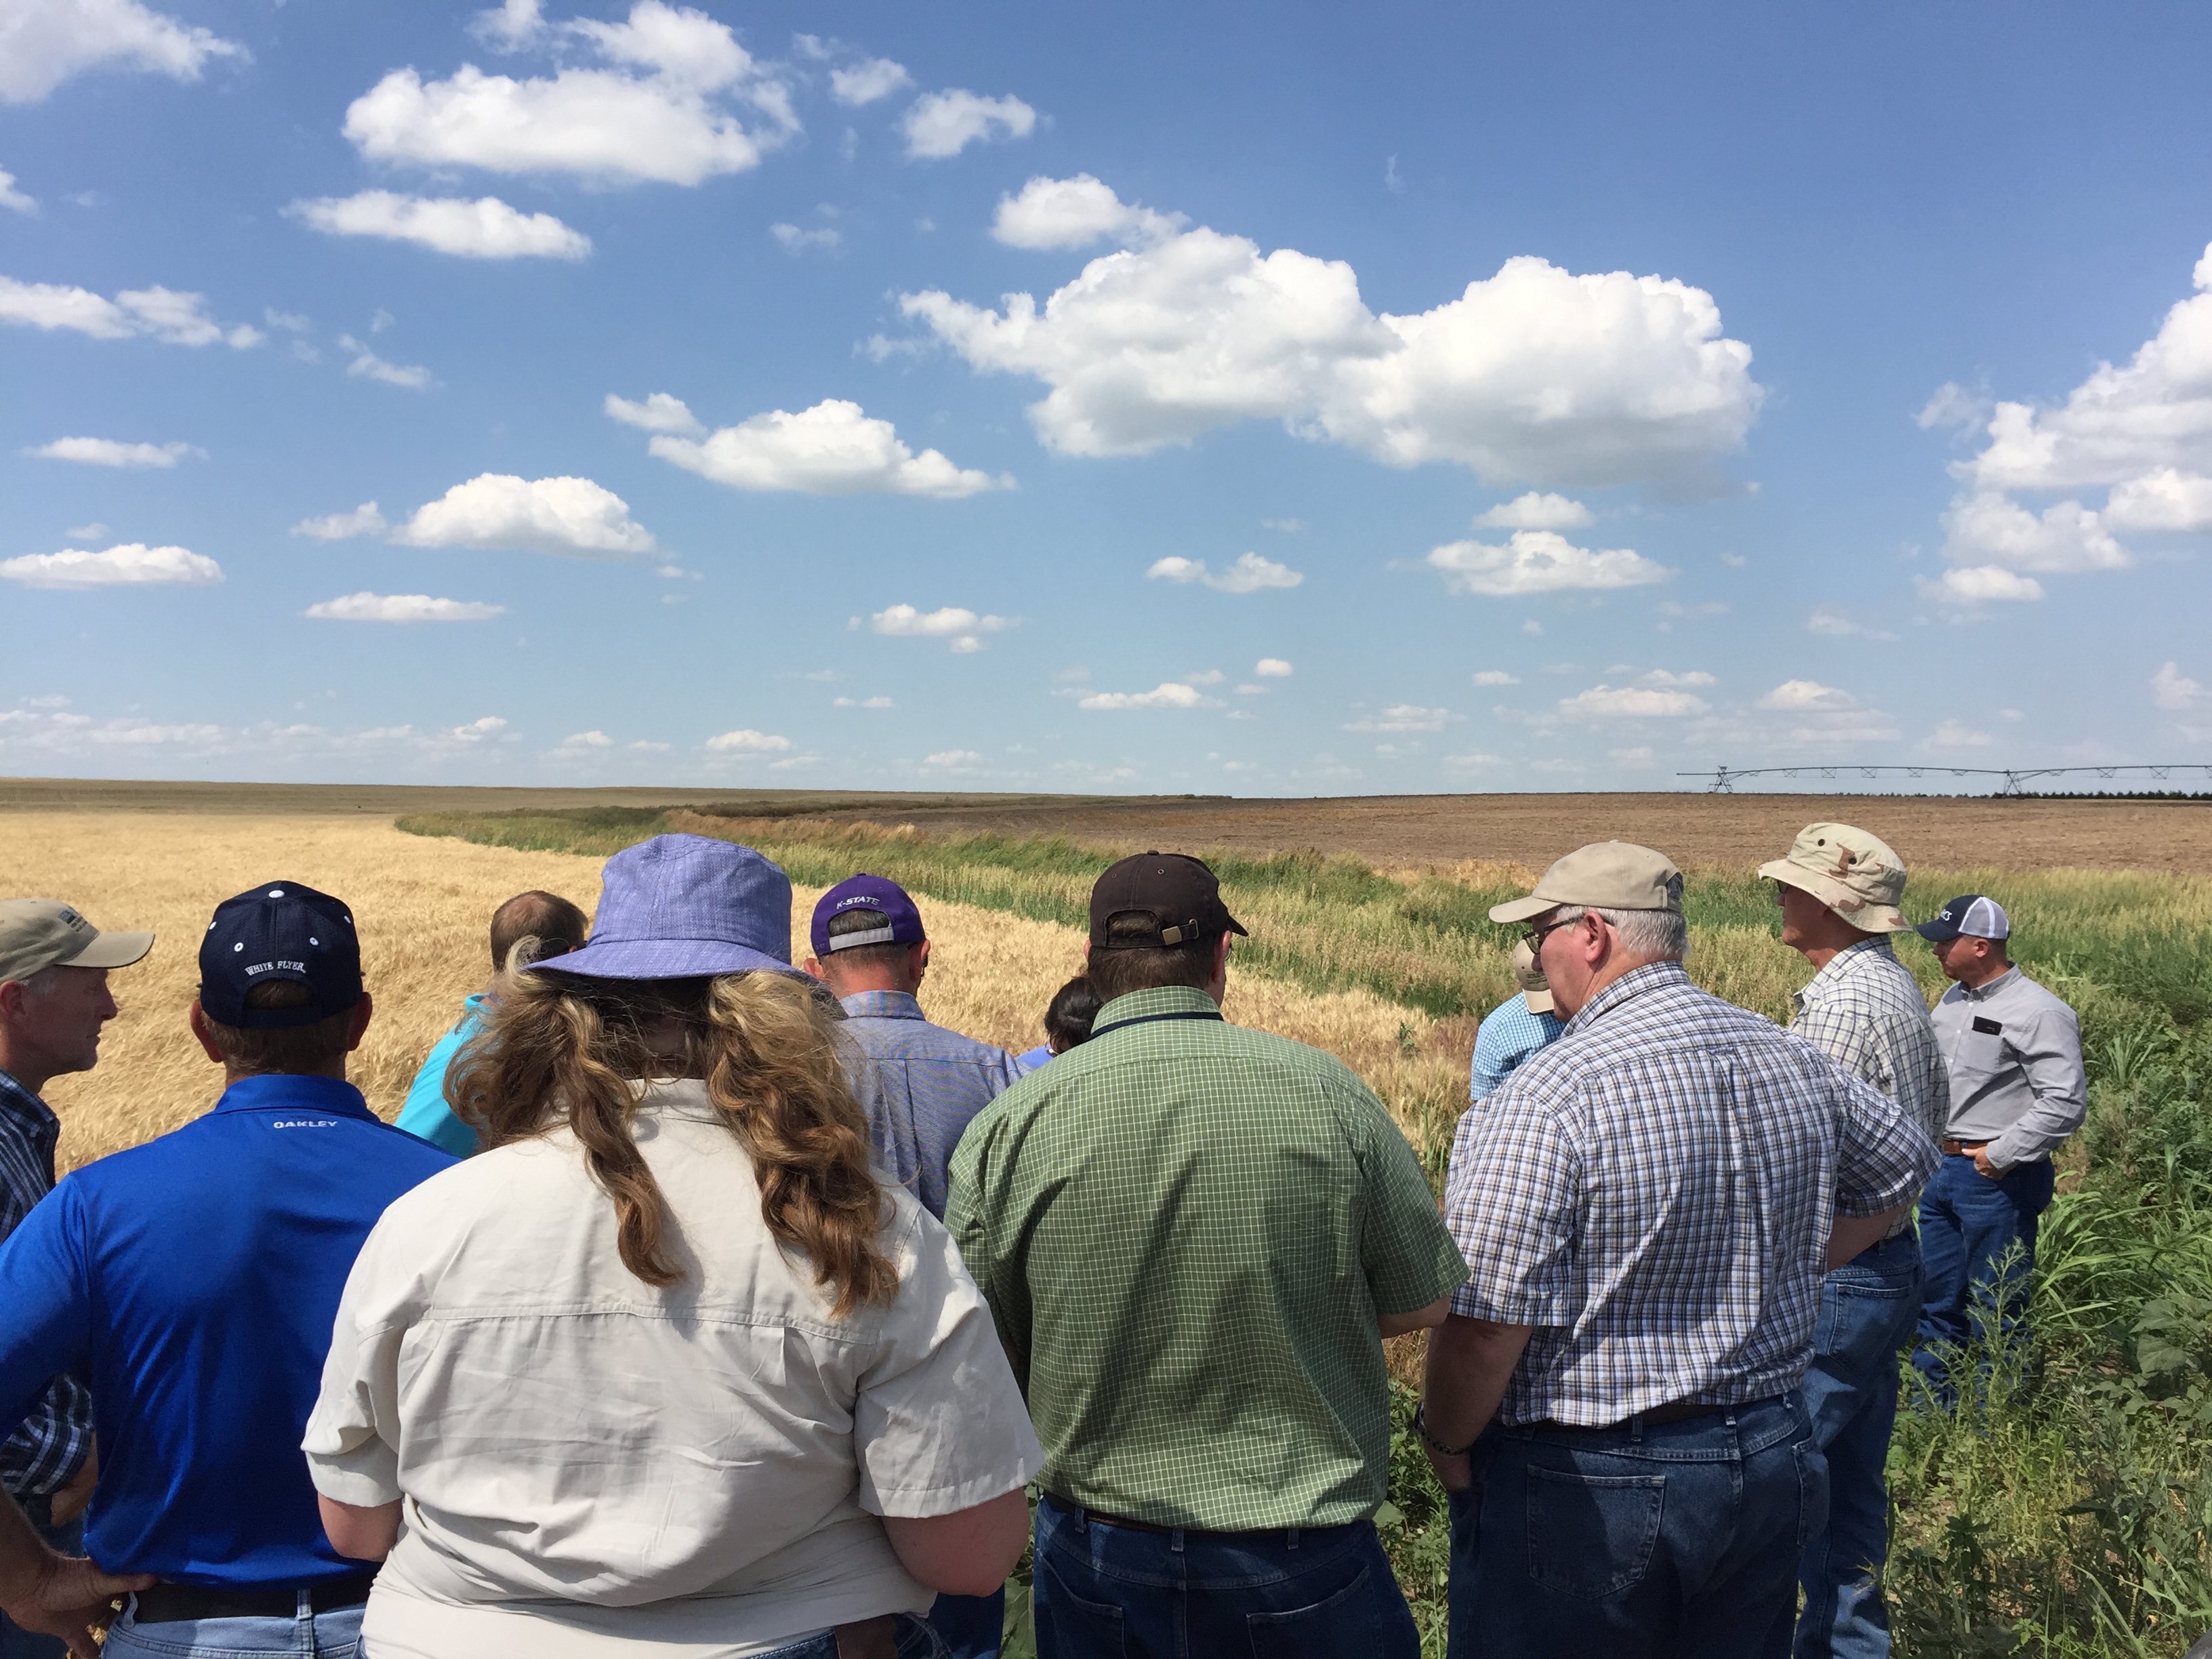
Picture of people in field at demo

Discussing crop rotation and setbacks.

Future Plans

States are currently integrating the new national format. The CNMP format will be reviewed periodically to make sure that the document stays on track as a usable management tool for the landowner.

Corresponding author, title, and affiliation

Sandy Means, Environmental Engineer, USDA Natural Resources Conservation Service, East National Technical Center, Greensboro, NC

Corresponding author email

Sandy.Means@gnb.usda.gov

Additional information

Resources:

NRCS General Manual, Title 190, Part 405 Comprehensive Nutrient Management Plans

The authors are solely responsible for the content of these proceedings. The technical information does not necessarily reflect the official position of the sponsoring agencies or institutions represented by planning committee members, and inclusion and distribution herein does not constitute an endorsement of views expressed by the same. Printed materials included herein are not refereed publications. Citations should appear as follows. EXAMPLE: Authors. 2017. Title of presentation. Waste to Worth: Spreading Science and Solutions. Cary, NC. April 18-21, 2017. URL of this page. Accessed on: today’s date.

Effectiveness of Livestock Exclusion in a Pasture of Central North Carolina


Proceedings Home W2W Home w2w17 logo

*Do not make slides downloadable

Purpose 

Jordan Lake (Reservoir), located in central North Carolina, is a 5,650-ha impoundment with a 436,860-ha watershed of which 18% was urban, 20% agricultural, and 56% forested. Like many lakes in the eastern U.S., the use of this water resource is being threatened by excessive nutrient inputs. A proposed nutrient reduction strategy set overall nitrogen (N) and phosphorus (P) load reduction goals for the watershed at 8-35% for N and 5% for P. Because much of the agricultural land in the watershed was used for pasture, the initial focus of reduction efforts was on pastures with livestock exclusion fencing identified as having the most potential. The objective of this project was to document the effectiveness of a combination of livestock exclusion fencing and nutrient management implemented on a beef cattle pasture typical of pastures in the Jordan Lake watershed and of the Piedmont region of NC.

What did we do? 

figure 1aThe paired watershed experimental approach used in this project, required simultaneous monitoring of two watersheds (treatment and control), during a calibration and a treatment period. The calibration period was from 12/30/07 to 10/5/11 and the treatment period was from 10/6/11 to 12/18/15. During both periods, the rainfall and quantity and quality of discharge were monitored continuously. Land use information (number of cattle, fertilization, soil test results) was collected at least annually. The treatment watershed (Past-treat) encompassed 54.5 ha all but 7.3 ha of which was used for beef cow pasture. The control watershed (Past-cont) encompassed 78.1 ha 39.5 ha of which was pasture, while most of the remainder (27.5 ha) was wooded.
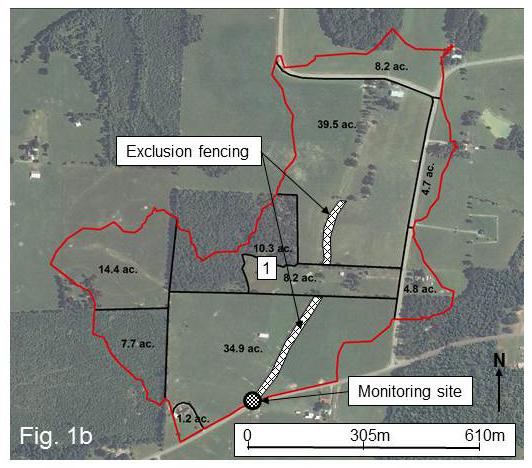
In the treatment watershed the exclusion fenceline was constructed in October, 2011 about 3 m from the top of the streambank on either side and was limited to the main stream channel only (fig. 1b). Nutrient management was also implemented which eliminated P application as soil tests showed that there was adequate P in the soil to support the growth of pasture grasses such as fescue. In the control watershed, beef cattle had unlimited access to the stream channel during the entire project (fig. 1a). Monitoring included collecting flow-proportional samples during storm events and analyzing them for total Kjeldahl (TKN), ammonia (NH3-N), and inorganic (NOx-N) nitrogen as well as total phosphorus (TP) and total suspended solids (TSS).

What have we learned?           

figure 1bStatistical analyses of storm event load data documented that during the post-fencing period, mass loading of TKN (34%), NH3-N (54%), TN (33%), TP (47%), and TSS (60%) was reduced significantly in the treatment relative to the control watershed, while storm discharge and NOx-N loads were not significantly different. These data showed that even a relatively narrow exclusion corridor implemented on only the main stream channel can significantly reduce the export of nitrogen, phosphorus, and sediment from a beef cattle pasture.

Future Plans   

Evaluate livestock exclusion fencing at another Piedmont site with a wider exclusion corridor.

Corresponding author, title, and affiliation       

Daniel Line, Extension Specialist at NC State University

Corresponding author email    

dan_line@ncsu.edu

Other authors  

Deanna Osmond, Professor, NC State University

Additional information              

Published in J. Environmental Quality 45:1926-1932

Acknowledgements      

This project received support from the National Institute of Food and Agriculture, U.S. Department of Agriculture, Integrated Water Quality Grant award 2011-0515 as well as funding from NCDEQ-DWR as pass-through funds from U.S. EPA 319.