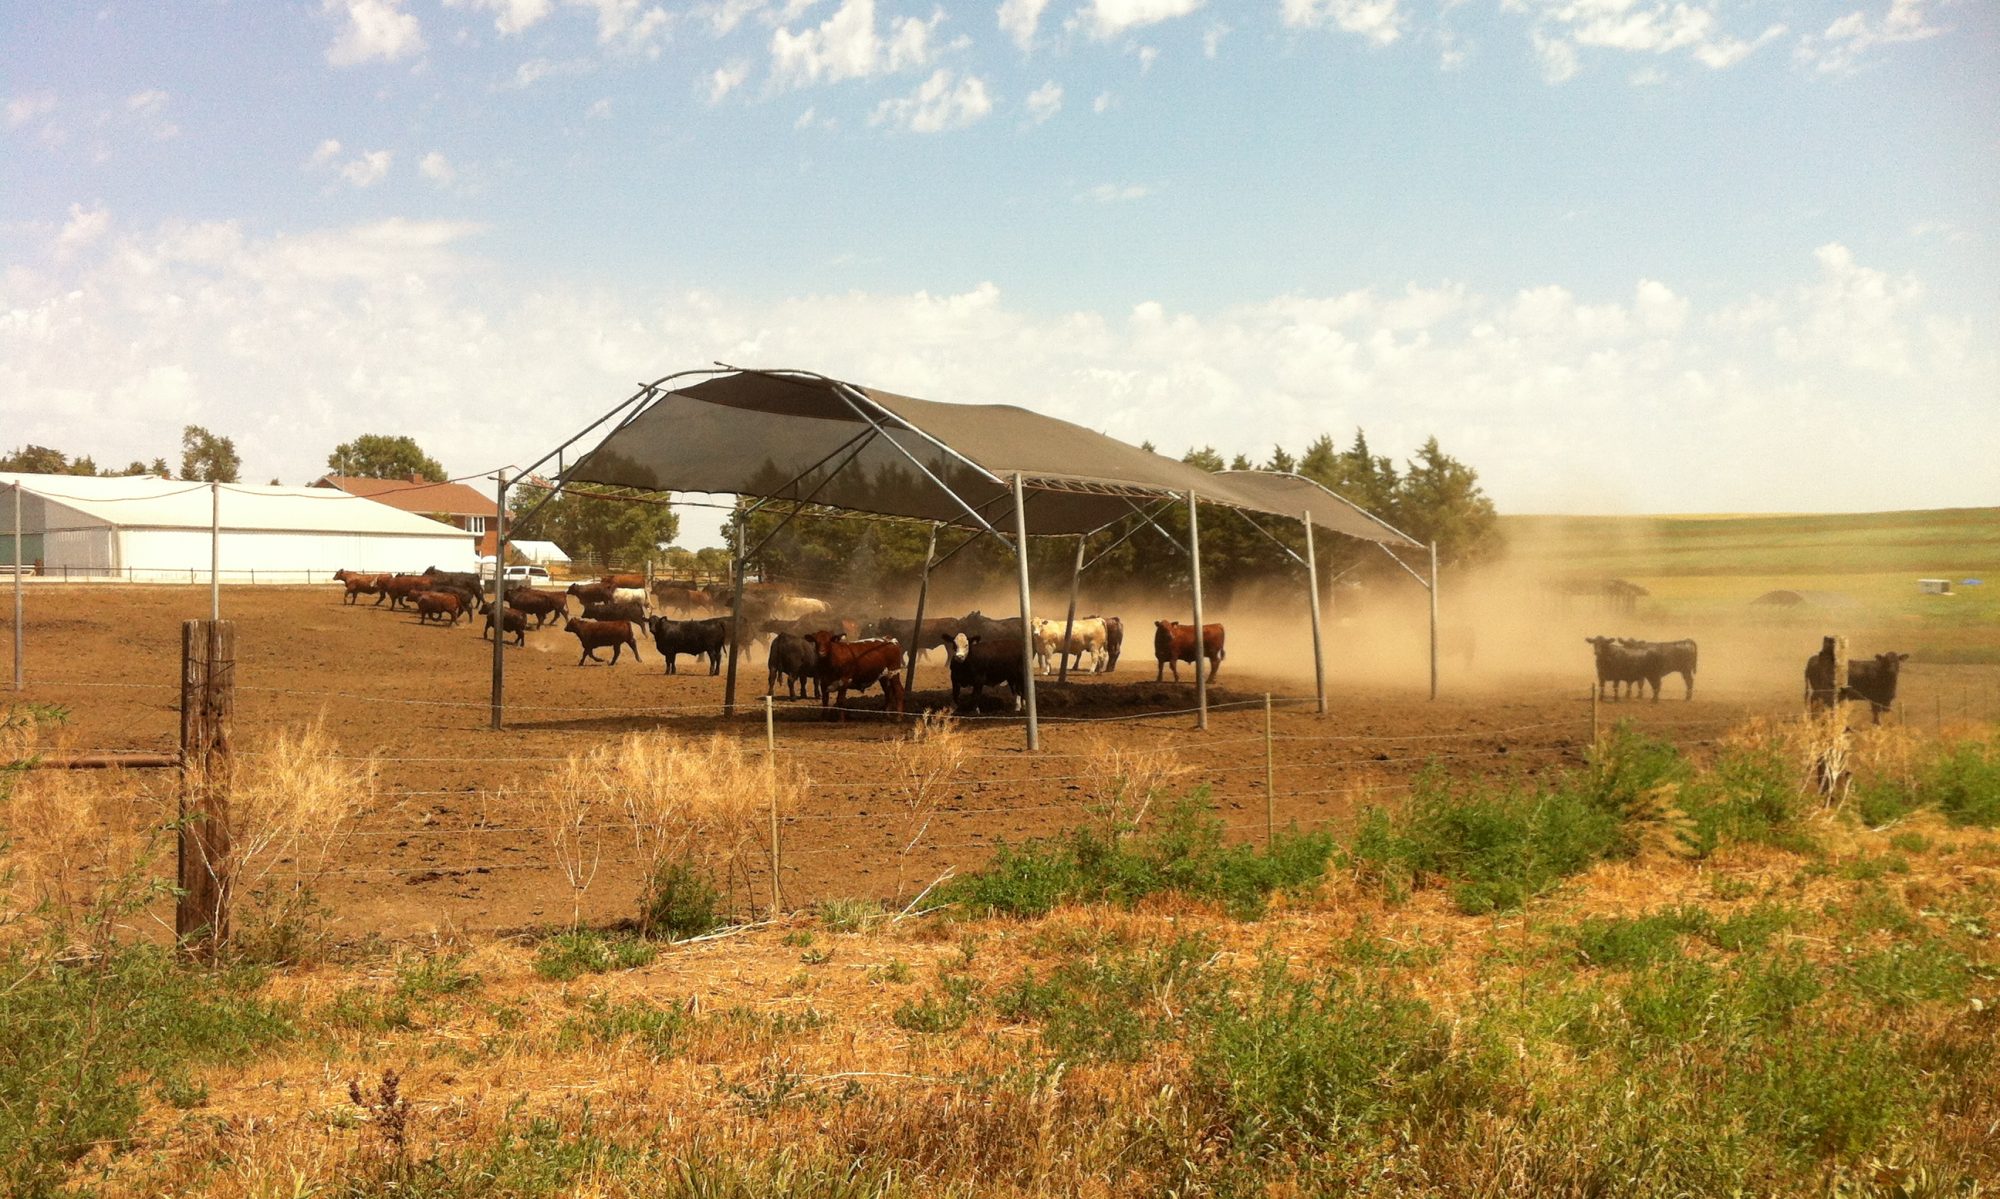
The purpose of this project was to collect local on-the-ground data to evaluate the effectiveness of different manure storage options installed on working farms in King County, Washington. Agricultural areas in King County receive over 40 inches of rain annually with most of it falling between the months of October through March. During this time, farms often store and compost their manure for spring and summer field application. Composting livestock manure and waste can produce a valuable resource for land managers. However, if managed improperly, manure leachate and runoff can contaminate ground and surface water resources posing a risk to humans and other wildlife.
The project aimed to collect data on water quality and manure quality under different solid manure storage options during the fall and winter months. During the project, we worked with two farms to monitor water quality and manure quality as well as held education and outreach events to engage with stakeholders about benefits and/or costs of adopting new manure management BMPs.
What Did We Do
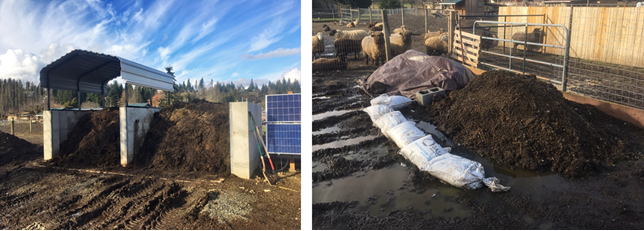
For the project, we worked with two farms and established four manure storage areas on each including: a concrete slab with walls and a roof, concrete slab with walls and no roof, a compacted soil areas with a tarp cover, and a compacted soil area with no cover. The manure piles were managed by the farmer following common winter practices and were turned and added to 2-3 times per month. We monitored the temperature of the piles over time to assess their composting activity, although it was not a primary focus of our study.
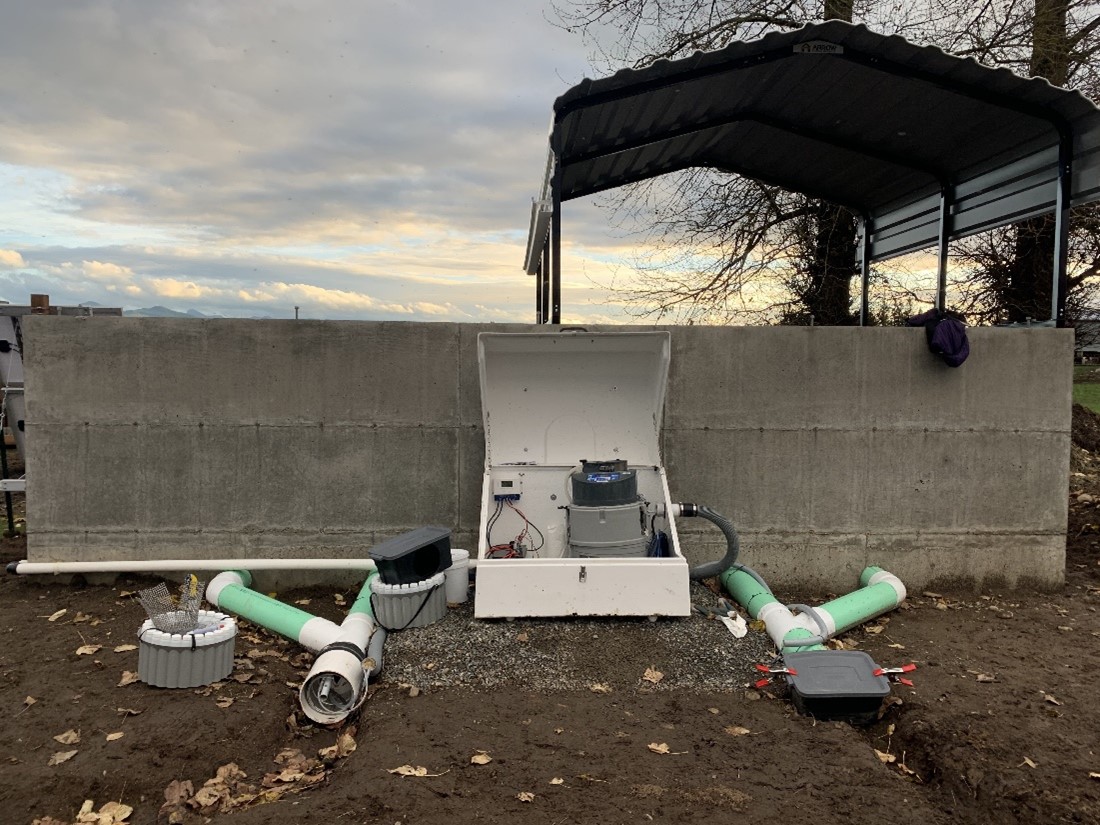
We collected samples of the manure from each storage area during the project to monitor changes over time. To assess nutrient loss and pollution via a stormwater runoff pathway, we collected runoff from the concrete slabs. To assess nutrient loss and pollution via a leaching pathway, we collected soil samples, from under the compacted soil areas. This monitoring allowed us to compare the storage options. The study was conducted over the course of eight months from October 2020 through May 2021. Below are photos of our study setup. Stormwater runoff water quality samples were collected using an ISCO automated sampler that was programmed to grab samples during rain events that generated runoff from the manure piles. Soil and manure samples were collected on a monthly basis.
Figure 1. Manure storage treatments. From left to right: slab covered, slab uncovered, soil covered, and soil uncovered.Figure 2. Stormwater runoff collection system from the concrete slabs.
What Have We Learned
The project results support the conclusion that the covering of solid manure piles had positive environmental benefits. Covered manure piles stored on a concrete slab have less stormwater runoff with lower loads of nutrients in the leachate than uncovered manure piles on a concrete slab. The covering of dry manure piles stored on compacted soil surfaces reduced the leaching of nutrient, particularly nitrate and nitrite, from manure piles into the soil. It also created a better manure end-product by allowing higher heat values to be reached and creating a drier end product. Additionally, the
placement of manure on a non-permeable, concrete surface eliminated the leaching of manure nutrients below the piles. Covered manure piles, whether stored on a concrete slab or dirt, tended to be drier and have higher temperatures, which results in a better composted manure product.
The results of this study demonstrated that the type of animal species and pile management (how often the pile was turned or added to) also greatly affected the nutrient composition of the leachate. For instance, at Site A, there was higher TP in the manure, and thus higher TP in the runoff water quality and in soil samples.
Future Plans
Due to the short duration of the project, we pursued and were awarded additional funding to extend the project and expand the data set to allow for more robust statistical analysis and conclusions. Partner agencies and organizations as well as the farmers have expressed support and interest in continuing this research, and the project Steering Committee members have also expressed interest in further participation.
In future studies, we intend to try to better quantify the flow volumes from manure piles stored on slabs. In addition, we intend to better assess leaching potential underneath the manure piles stored on soil by using lysimeters to measure leachate volumes.
Authors
Presenting Author
Scarlett Graham, Conservation Research Specialist, Whatcom Conservation District
Corresponding Author
Laura Redmond, Landowner Incentive Program Coordinator, King Conservation District
laura.redmond@kingcd.org
Additional Authors
Addie Candib, Pacific Northwest Regional Director, American Farmland Trust
The authors are solely responsible for the content of these proceedings. The technical information does not necessarily reflect the official position of the sponsoring agencies or institutions represented by planning committee members, and inclusion and distribution herein does not constitute an endorsement of views expressed by the same. Printed materials included herein are not refereed publications. Citations should appear as follows. EXAMPLE: Authors. 2022. Title of presentation. Waste to Worth. Oregon, OH. April 18-22, 2022. URL of this page. Accessed on: today’s date.
Manure is rich in essential elements, including nitrogen (N), phosphorus (P), and potassium (K), for plant growth. Although applying manure as a fertilizer at agronomic rates can restore organic matter and nutrients to the soil, over-application of manure may contribute to environmental issues such as eutrophication and water contamination. Manure nutrient prediction and variable rate application are promising new technologies to reduce the risk of over-application, however, the variability in manure nutrient concentrations and the time-lag caused by traditional chemical analysis of manure composition make precise nutrient application difficult to achieve.
Near-infrared (NIR) spectroscopy is a high-energy vibrational spectroscopy performed in the wavelength range between 750 to 2500 nm and has been proven to accurately determine total solid (TS), organic matter (OM), total nitrogen (TN), and ammoniacal nitrogen (NH4-N) of animal manure in several previous studies. A low-field nuclear magnetic resonance (NMR) device that is designed based on the absorption and emissions of energy in the radio frequency range of the electromagnetic spectrum is another potential method for predicting manure nutrients accurately. The main purpose of this manure sensing project was to determine if the NIR and NMR sensing techniques can provide robust prediction of manure nutrients and, therefore, improve the precision of field application.
What Did We D
We investigated NIR spectroscopy with reflectance and transflectance modes to predict micronutrients in dairy manure. In this study, 20 dairy manure samples were collected and spiked by dissolving a specific amount of ammonium chloride (NH4Cl) or Arginine to achieve incremental NH4-N and organic nitrogen (Org-N) concentrations, respectively. Each raw sample was spiked at four levels which were 1.25, 1.5, 2, and 4 times the NH4-N or Org-N concentrations of the raw manure as analyzed by a certified lab. All samples were scanned and analyzed using a NIR with a reflectance head sensor and a transflectance probe of three different optical path lengths. NIR calibration models were developed using partial least square regression analysis and the coefficient of determination (R2) and root mean square error (RMSE) were calculated to evaluate the models.
The accuracy and precision of a low-field NMR designated for manure nutrient prediction was assessed. Twenty dairy manure samples were collected and analyzed for TS, TN, NH4-N, and total phosphorus (TP) in a certified laboratory and using the NMR analyzer. Runtimes of 15 min to 90 min were tested to investigate their effects on accuracy and precision of NMR.
What Have We Learned
For the NIR study, the transflectance probe yielded calibrations that had higher R2 and RMSE for TS, ash, and particle size (PS), and reflectance sensor improved the accuracy of NH4-N and Org-N predictions. NIR sensors have the potential to predict N concentrations without being affected by the TS, ash content, and PS of the dairy manure.
The NMR predictions of TS, NH4-N, and TN were accurate for samples with relativley low TS, but not well correlated to the lab measurements for high TS samples. TP predicted by NMR was not affected by TS levels and the TP prediction was not precise and robust. The effects of runtime on the accuracy and precision of NMR prediction were not consistent.
Future Plans
Additional work is needed to improve the accuracy and precision of NIR calibration models. The procedure of spiking method in manure analysis using NIR techniques needs to be enhanced in order to be widely applied for preparing manure samples for NIR calibrations. Finally, further investigation of the methodology with other manure constituents such as P and K and conducting online variable rate application of organic fertilizer using NIR sensing system are needed to evaluate the potential effects of reducing the overall system variability.
Additional work to improve NMR prediction includes recalibrating the system based on specific manure samples and improving the accuracy and precision of TP prediction.
Authors
Xiaoyu Feng, Research Associate, University of Wisconsin-Madison
xfeng43@wisc.edu
Additional Authors
-Rebecca Larson, Associate Professor and Extension Specialist, University of Wisconsin-Madison; Matthew Digman, Assistant Professor, University of Wisconsin-Madison;
-Joseph Sanford, Assistant Professor, University of Wisconsin- Platteville
Additional Informaion
Feng, X.Y., R.A. Larson, and M. Digman. 2022. Evaluating the Feasibility of a Low-Field Nuclear Magnetic Resonance (NMR) Sensor for Manure Nutrient Prediction. Sensors 22(7):2438. https://doi.org/10.3390/s22072438
Feng, X.Y., R.A. Larson, and M. Digman. 2022. Evaluation of Near-Infrared Reflectance and Transflectance Sensing System for Predicting Manure Nutrients. Remote Sensing 14(4): 963. https://doi.org/10.3390/rs14040963
Acknowledgements
Support for this project was provided by the Wisconsin Dairy Innovation Hub.
The authors are solely responsible for the content of these proceedings. The technical information does not necessarily reflect the official position of the sponsoring agencies or institutions represented by planning committee members, and inclusion and distribution herein does not constitute an endorsement of views expressed by the same. Printed materials included herein are not refereed publications. Citations should appear as follows. EXAMPLE: Authors. 2022. Title of presentation. Waste to Worth. Oregon, OH. April 18-22, 2022. URL of this page. Accessed on: today’s date.
Due to increased demand for milk and milk products, the dairy industry has grown tremendously over the last several decades. This has resulted in an increase in the production of dairy manure. In recent years, the industry has also seen significant changes, such as a decrease in the number of dairy farms but an increase in the size of individual operations, and regional concentrations of dairy operations. Because of the regional concentrations of large dairies, large volumes of manure are produced in small geographical areas, raising concerns about the effects on local air, land, and water resources. Various dairy manure management technologies have been suggested ranging from anaerobic lagoons to membrane filtration. Many of these technologies, however, are not considered economically viable due to the high energy and labor requirements for sludge management.
Vermifiltration is on the other hand an emerging low-cost manure management technology, which is an aerobic wastewater treatment system that employs a community of microorganisms and earthworms in a filter bed media. The purpose of this research was to assess the effectiveness of this technology in reducing solids, organic strength, and nutrients (nitrogen and phosphorus) in dairy wastewater from a dairy operation with a manure-flush system. The treatment’s ultimate goal was to: (1) reduce the nutrient load of the wastewater so that it could be recycled via irrigation on nearby land, (2) recycling to flush fresh manure from the barns, and (3) recover the nutrients in the form of earthworm biomass and vermicasts.
What Did We Do
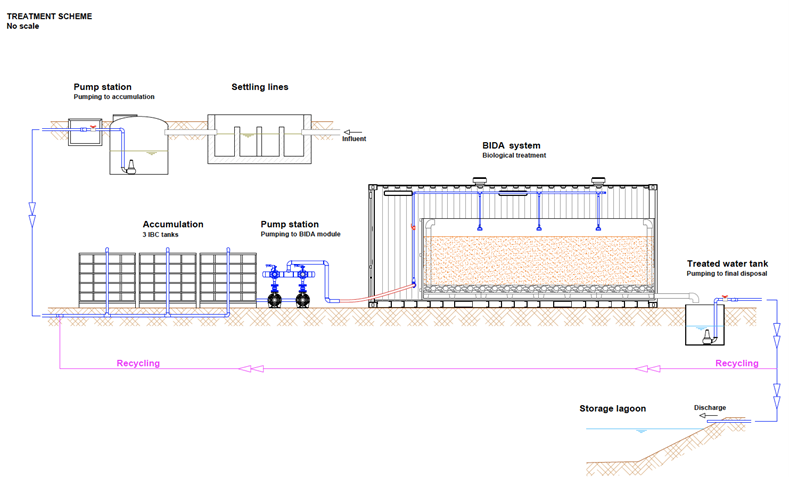
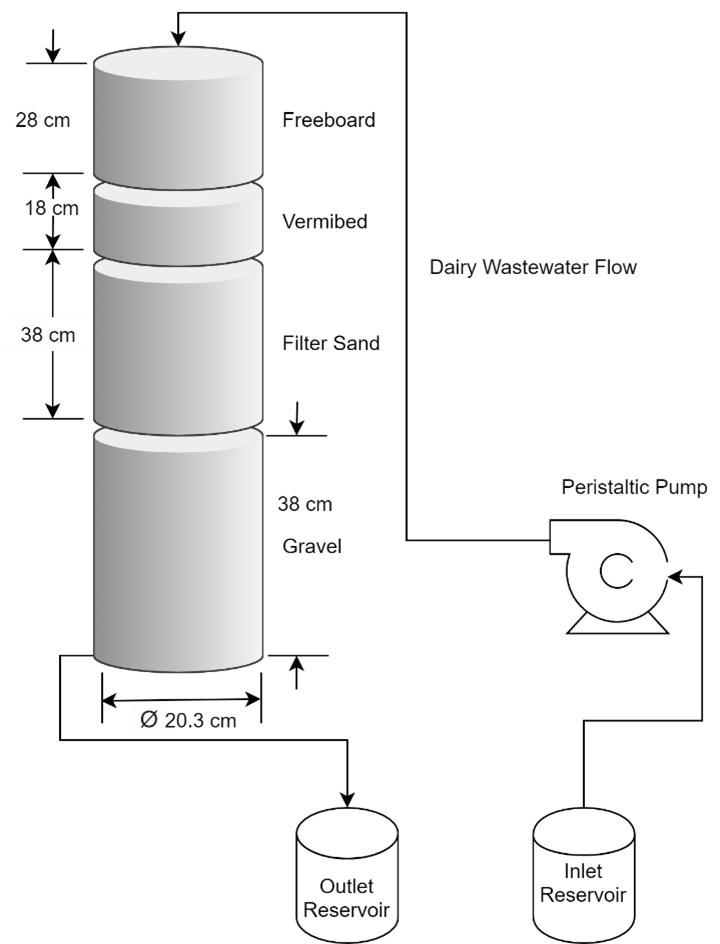
In this study, we assessed the efficacy of a vermifilter for treating dairy wastewater in terms of effluent quality and potential air emission reductions. For these tests, a pilot-scale vermifilter unit (Fig 1) was installed on a commercial dairy and monitored for 6 months. Additional lab-scale (Fig 2) studies looked into the effects of earthworm density, organic loading rate, and hydraulic loading rate on the vermifilter’s performance. Total solids, total suspended solids, chemical oxygen demand, total nitrogen, total ammonia-nitrogen, nitrate-nitrogen, total phosphorus, and orthophosphate were among the wastewater parameters of interest. A closed-loop dynamic chamber method was used to measure potential gas emissions (ammonia—NH3, methane—CH4, carbon dioxide—CO2, and nitrous oxide—N2O) from these samples. Lab scale Plexiglass vermifilters were also used to study the effect of earthworm density, organic and hydraulic loading rates.
Fig 1: Layout of the pilot scale vermifilter system (IIBC tanks for storage, BIDA is the vermifiltration system)Fig 2: Lab scale vermifilter system
What Have We Learned
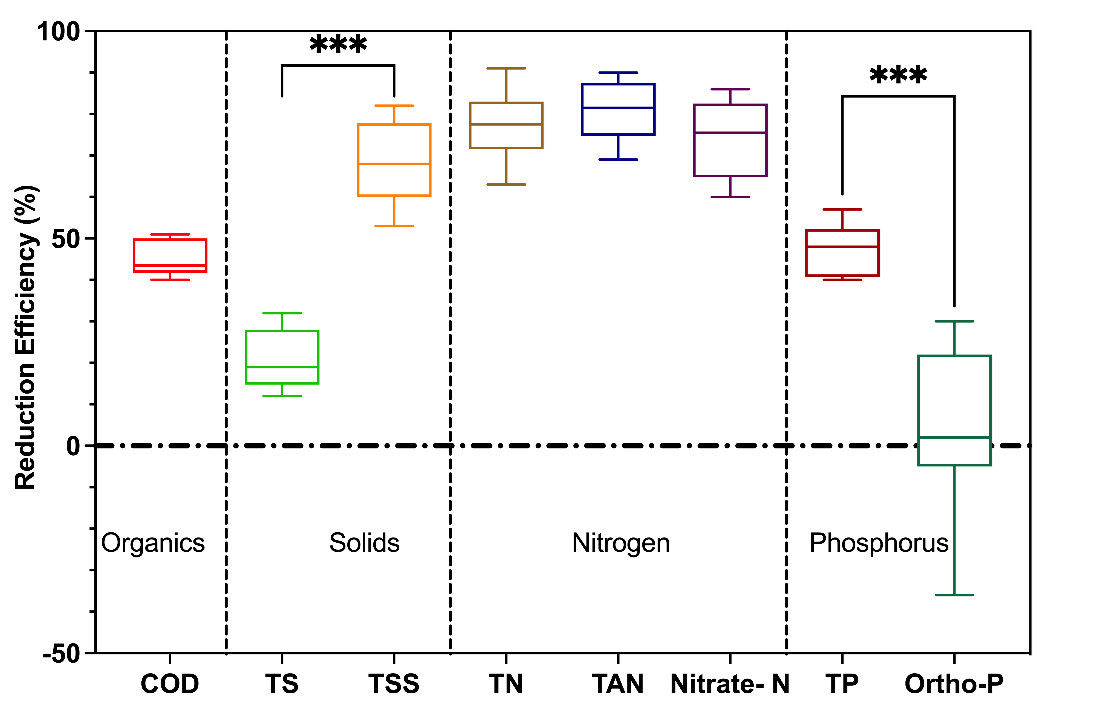
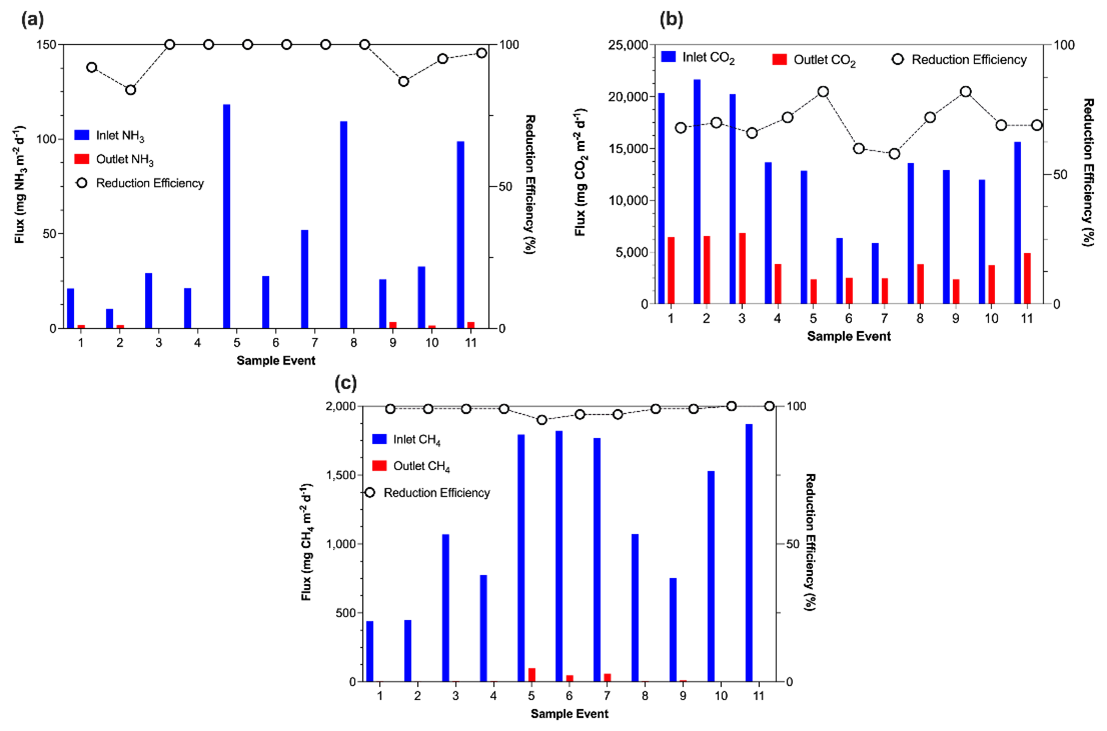
We observed that reduction efficiencies of up to 90% of inlet wastewater organics, nutrients, and solids can be achieved by the vermifilter (Fig 3). These results showed that vermifiltration has a high potential for reducing the concentrations of organics, nutrients, and solids in dairy wastewater. We also noted that the vermifilter system reduced emissions of gases by 84 – 100% for NH3, 58 – 82% for CO2, and 95 – 100% for CH4. Nitrous oxide emissions were mostly undetectable. We also learned that the vermifilter system reduced the global warming potential of untreated dairy wastewater by up to 100% and demonstrated the ability to generate carbon credits while maintaining a low carbon footprint. We further learned that vermifiltration at earthworm densities of 10,000 and 15,000 earthworms m-3 is best for treating dairy wastewater in terms of organic matter, nutrients, and solids concentration removal.
Fig 3: Reduction efficiencies of organics, solids, nitrogen and phosphorusFig 4: Influent, effluent gas fluxes through the vermifilter system
Future Plans
To enable effective scale-up, additional studies of a full-scale vermifilter system’s techno-economic and life cycle assessment are required. The techno-economic analysis will serve as a foundation for addressing vermifiltration optimization processes, as well as determining the system’s cost implications and economic performance. The life cycle assessment, on the other hand, will reveal potential environmental impacts associated with a full-scale vermifilter system.
Vermifiltration uses a variety of microbial pathways for nutrient conversion, including aerobic and anaerobic organic matter stabilization, ammonification, nitrification, immobilization, and denitrification. These pathways are heavily reliant on the system’s dominant microbiota, which has an impact on the system’s treatment efficiency. Genomic sequencing is required to better understand the microbiota present in dairy wastewater streams and vermifilter units, as well as how the introduction of earthworms affects the microbial communities. This will allow us to optimize the treatment and thus increase the vermifilter’s efficiency.
Authors
Gilbert Miito, Post Doctoral scholar, University of Missouri
gilbertjohn.miito@wsu.edu
Additional Authors
-Pius Ndegwa, Professor, Washington State University
-Femi Alege, Post Doctoral Fellow, University of California Berkeley
-Joe Harrison, Professor, Washington State University
Biofiltro, Organix Inc, Washington State University, Washington State Department of Agriculture
The authors are solely responsible for the content of these proceedings. The technical information does not necessarily reflect the official position of the sponsoring agencies or institutions represented by planning committee members, and inclusion and distribution herein does not constitute an endorsement of views expressed by the same. Printed materials included herein are not refereed publications. Citations should appear as follows. EXAMPLE: Authors. 2022. Title of presentation. Waste to Worth. Oregon, OH. April 18-22, 2022. URL of this page. Accessed on: today’s date.
Manure produced at livestock facilities contains plant essential nutrients, such as nitrogen and phosphorus, which is typically land applied as a fertilizer source for crops near where it is generated. However, in areas of high livestock density, due to the imbalance of nitrogen and phosphorus in manure compared to crop requirements, soil phosphorus concentrations have increased. This has resulted in soil phosphorus legacy issues throughout the Midwest, contributing to water quality issues in surrounding waterways. To reduce phosphorus application near livestock facilities, advanced manure management systems are needed to separate and concentrate manure nutrients, particularly phosphorus, to expand transport distances. In this study, we investigated converting separated anaerobically digested manure solids into biochar through pyrolysis to densify manure nutrients. In addition, we examined the availability of phosphorus from manure derived biochar in a soil incubation study to evaluate its fertilizer potential.
What Did We Do
We collected anaerobically digested manure solids from a screw press separator at a local dairy facility. Manure solids were dried and converted to biochar at two different temperatures (662°F and 932°F). The mass of the dried manure and biochar were determined and samples analyzed for total nitrogen, total phosphorus, and available phosphorus to evaluate densification of manure nutrients.
We additionally evaluated nutrient availability of manure solids and biochar in a soil incubation study. In the study manure solids and biochar were applied at equal agronomic phosphorus rates to two different soil textures (loam and sandy loam). Soils were then incubated for 182 days with samples collected and analyzed Every week for four weeks throughout the period to evaluate phosphorus release over time.
What Have We Learned
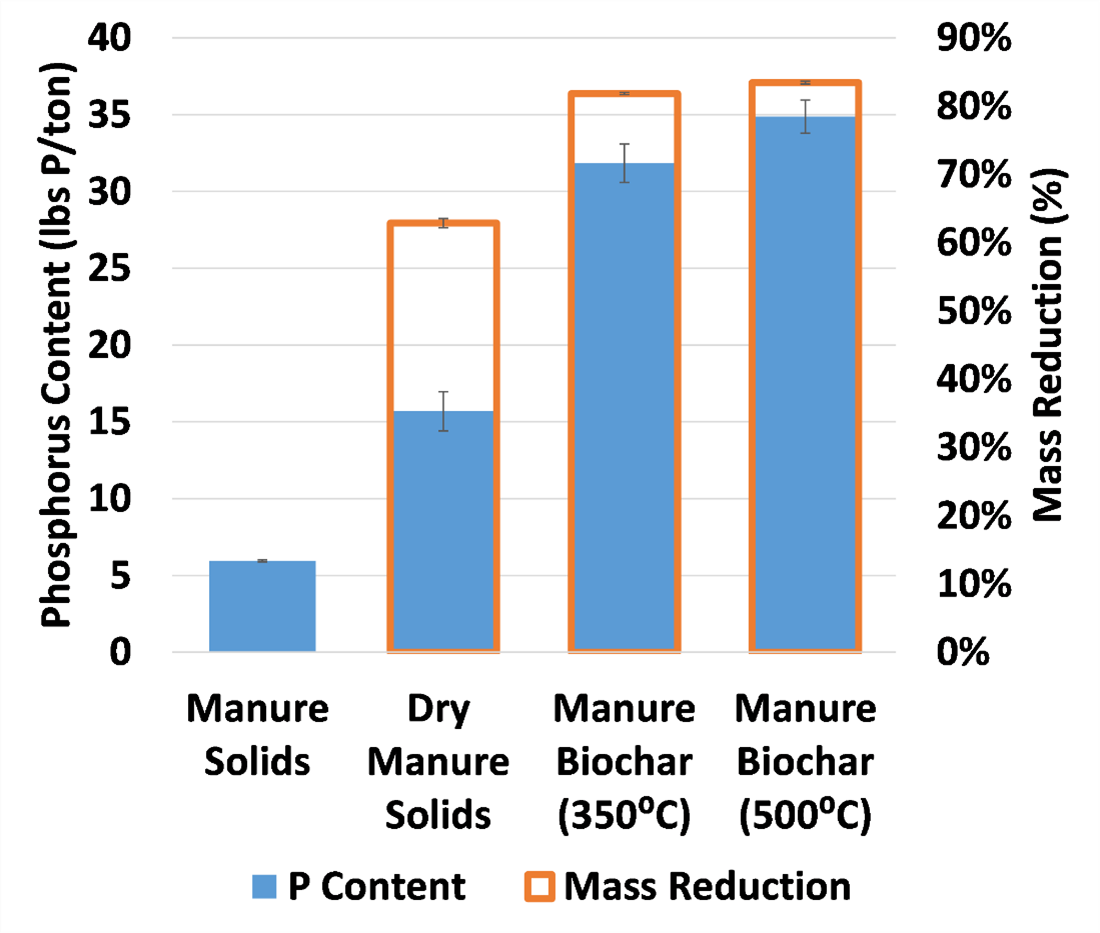
We found that converting manure solids to biochar is an effective method for reducing manure mass while retaining the original manure phosphorus content (as shown in Figure 1). However, manure derived biochar had lower available phosphorus following pyrolysis than the original separated manure solids, with the available P decreasing as the pyrolysis temperature increased.
Figure 1: Mass reduction and P content following drying and pyrolysis of manure.
During the soil incubation study, while soils with manure derived biochar application had lower available phosphorus at the start of the incubation period, within 28 days available soil phosphorus reached similar levels to those amended with separated manure solids in both soil textures. While nitrogen was applied at different rates, making comparisons difficult, there were minor changes in soil available nitrogen for manure derived biochar, suggesting no additional nitrogen availability during the incubation period.
Future Plans
We plan to further investigate manure derived biochar as a potential advanced manure processing pathway, by evaluating whether manure derived biochar can provide additional soil benefits, such as reducing nitrogen leaching when amended to agronomic soils and increasing crop yields in field studies.
Authors
Joseph R. Sanford, Assistant Professor and Wisconsin Dairy Innovation Hub Affiliate Researcher, School of Agriculture, University of Wisconsin-Platteville
sanfordj@uwplatt.edu
Additional Authors
Rebecca A. Larson, Associate Professor, Biological Systems Engineering, University of Wisconsin-Madison
Additional Information
Sanford, J., H. Aguirre-Villegas, R.A. Larson, M. Sharara, Z. Liu, & L. Schott. 2022. Biochar Production through Slow Pyrolysis of Animal Manure. University of Wisconsin-Extension, Publication No. A4192-006/AG919-06, I-01-2022.
Acknowledgements
This material is based on work that is supported by the National Institute of Food and Agriculture, U.S. Department of Agriculture, under award number 2017-67003-26055. Partial support was provided by the Wisconsin Dairy Innovation Hub. Any opinions, findings, conclusions, or recommendations expressed in this publication are those of the author(s) and do not necessarily reflect the view of the U.S. Department of Agriculture or Wisconsin Dairy Innovation Hub.
The authors are solely responsible for the content of these proceedings. The technical information does not necessarily reflect the official position of the sponsoring agencies or institutions represented by planning committee members, and inclusion and distribution herein does not constitute an endorsement of views expressed by the same. Printed materials included herein are not refereed publications. Citations should appear as follows. EXAMPLE: Authors. 2022. Title of presentation. Waste to Worth. Oregon, OH. April 18-22, 2022. URL of this page. Accessed on: today’s date.
The most common waste management practice on hog farms in Eastern North Carolina are anaerobic lagoons. Lagoons contain three zones: [1] sludge storage zone at the bottom, [2] treatment zone for incoming manure in near the middle, and [3] a liquid (supernatant) storage zone at the top. The supernatant is land applied throughout the year as a nutrient source for growing crops on farms while the middle (treatment) zone is required to remain full to ensure effective treatment.
Considering the risk that hurricanes pose to North Carolina and the hog sector (particularly during late summer months), close lagoon management is critical to avoid risk of overflow or breach. Currently, regulations allow swine growers to lower the effluent level in their lagoons by applying part of the treatment zone effluent. Conditional to this allowance, however, is that the treatment zone contains at least 4-feet of depth that is sludge-free. This condition aims to ensure applied effluent is safe for application.
While this condition is helpful to reducing the risk of applying higher concentration of phosphorus, zinc, and copper to crops, many producers do not meet this condition due to excessive sludge buildup and would not be able to lower the lagoon level which poses a significant risk during intense rainfall events.
This study aims to quantify the impact of the sludge-free depth in the lagoon on the quality of supernatant during the drawdown period. Findings will help with precision nutrient application from swine manure and allow for further drawdown during necessary storm events.
What Did We Do
This study used a dataset representing 27 swine operations in Eastern North Carolina between 2016-2021. The dataset includes:
1. Monthly effluent/waste sampling analysis,
2. Annual sludge surveys, as well as
3. Lagoon level readings.
This dataset was analyzed using statistical methods to quantify the impact of seasonality (time of year), farm type (sow, finisher, or farrowing), and sludge level on nutrient concentration in the effluent.
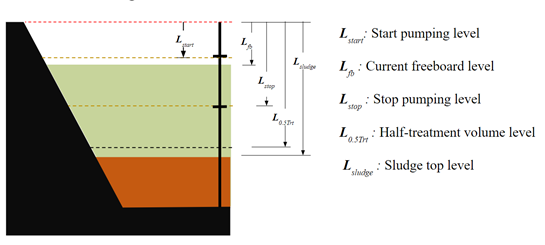
Most growers use depth, in inches, to report volumes applied or available for storage. However, when comparing lagoons with different designs, this can be a challenge. As such, we developed two parameters to facilitate cross-farm, cross-lagoon comparisons. The first is “freeboard ratio” (FBR), which refers to the relative “fullness” of the storage zone in the lagoon. FBR value between 0 and 1 indicates the lagoon is currently within the storage volume (between start and stop pumps), values greater than 1 indicate the lagoon is in drawdown, and negative values indicate the lagoon level exceeded the storage volume and is currently in the rainfall/storm storage zone and must be lowered promptly. The equation used to calculate FBR is as follows:
TBR=
LFB-Lstart
, variables defined in Figure 2.
Lstop-Lstart
The second variable is “sludge level ratio” (SLR), which refers to the relative treatment volume available compared to the 50% treatment volume required. SLR values greater than 1 indicate that more than 50% of the treatment volume is sludge-free in the lagoon and therefore drawdown can proceed, and no sludge removal is necessary. SLR values less than 1 indicate that less than 50% of the treatment volume is available and drawdown might not be feasible. The equation used to calculate SLR is as follows:
SLR=
Lsludge-Lstop
, variables defined in Figure 2.
L0.5. Trt-Lstop
Figure 2. Anaerobic lagoon zones used to calculate study parameters FBR and SLR
What Have We Learned
In analyzing the dataset we observed that only 2% of the samples were collected while the lagoon level exceeded storage level (above the start-pump level). This suggests the majority of studied operations were successful in managing effluent despite the wet years observed between 2016 and 2021. By comparison, 22% of the samples were collected while the lagoon was at a draw-down state (the entire storage volume is empty and the treatment zone is partially emptied).
Additionally, 38% of the samples collected were associated with lagoons that needed sludge removal (SLR < 1). These results are summarized in Table 1, with 12% of samples collected from lagoons in drawdown (FBR > 1) and in need of sludge removal (SLR < 1). This latter group of samples represent the primary concern for lagoon drawdown.
Table 1. Summary of FBR and SLR Interactions
Lagoon Sample Class
Sludge Level Ratio (SLR)
No Removal
Removal Due
Freeboard Ratio (FBR)
Above stop-pump
40%
26%
In drawdown
22%
12%
The season was a significant predictor of the lagoon level (p < 0.001), with the late irrigation season (July – Sept) showing the least effluent volume in the lagoon. On average, 91% of the storage volume was unoccupied. This compares to the winter months (Oct – Feb) and the early irrigation season (Mar – June) with 81 and 69% of the storage volume empty, respectively.
For all seasons the mean ratio of N : P2O5 : K2O in the supernatant is 4 : 1 : 8.2. There was less variability for N and K content with the lagoon level than for P, Zn, and Cu. This can be attributed to the N and K being primarily in soluble forms in the lagoon supernatant compared to P2O5, Zn and Cu which are mostly bound to solids.
The analysis showed a greater variability in Zn, Cu, and P levels with changes in solid concentration in the supernatant as well as the amount of suspended solids as a result of wind or active lagoon agitation/sludge removal.
Overall, the results showed lagoon drawdown and existing sludge reserves to have a combined effect on nutrient concentrations in the supernatant, particularly for phosphorus.
Future Plans
This study will inform ongoing research to predict temporal variability in nutrient content in the lagoon due to weather, operational decisions, and time of year. Near term, these observations will help guide application rates to ensure P levels meet crop demands particularly during late-season drawdown without significantly increasing soil P levels. In addition, this work will be part of a larger study to predict the performance of anaerobic treatment lagoons under future climate conditions.
Authors
Presenting Author:
Carly Graves, Graduate Research Assistant, North Carolina State University
Corresponding Author:
Dr. Mahmoud Sharara, Assistant Professor & Waste Management Extension Specialist, North Carolina State University
msharar@ncsu.edu
Acknowledgements
Thank you to Smithfield Foods, Inc. for funding this research and providing datasets of sludge surveys.
The authors are solely responsible for the content of these proceedings. The technical information does not necessarily reflect the official position of the sponsoring agencies or institutions represented by planning committee members, and inclusion and distribution herein does not constitute an endorsement of views expressed by the same. Printed materials included herein are not refereed publications. Citations should appear as follows. EXAMPLE: Authors. 2022. Title of presentation. Waste to Worth. Oregon, OH. April 18-22, 2022. URL of this page. Accessed on: today’s date.
In Ohio, the surface application of swine manure to soft red winter wheat in late March or early April is a common practice. This process makes good use of the ammonium nitrogen in the manure and provides an in-season window to apply manure to a growing crop. The savings in purchased nitrogen fertilizer can help offset most of the manure application expense.
The Maumee River in Northwest Ohio drains into the Western Lake Erie Basin and has been the ongoing focus of concern as phosphorus carried to the lake continues to be cited as a cause of harmful algal blooms. The surface application of manure, without follow up incorporation tillage, could be banned if water quality problems persist. This could jeopardize the application of manure to wheat and the application of manure to forages between cuttings. The purpose of this research project was to determine if manure could be subsurface applied to wheat using a Grassland Applicator toolbar and produce similar yields to surface applied manure or commercial fertilizer. If this method of manure application was successful, it could become a viable option for livestock farmers and commercial manure applicators wanting to apply manure to wheat in the Maumee River watershed.
Subsurface applied manure to wheat is not common practice in Ohio. Wheat plants and plant roots are damaged as the Grassland Applicator travels across the wheat field. This study sought to document yield losses if they occurred.
What Did We Do
This one-year study was designed to determine if manure could be subsurface applied to wheat and produce similar yields to surface applied manure or commercial fertilizer. Three livestock farmers with available wheat fields were contacted for on-farm manure plots. Each of the three farmers had slightly different comparison plots so we will refer to them as the Haselman Farm, the Maag farm, and the Leopold farm.
A 20-foot wide Grassland Applicator toolbar was attached to a 7,350 gallon manure tanker and used to subsurface apply manure to soft red winter wheat fields in early April. The manure tanker was owned by a commercial manure applicator and the livestock producers paid the commercial applicator for the manure application. The Grassland Applicator toolbar was owned by one of the livestock farmers.
The Haselman field compared subsurface applied manure to surface applied manure. Liquid swine finishing manure was both surface applied and subsurface applied in 40-foot (two 20-foot passes with the toolbar) treatments that were 1,050 feet long. Four treatments of subsurface applied manure were compared to four treatments of surface applied manure in a randomized block design. The surface application was accomplished by raising up the Grassland Application toolbar so that it just grazed the soil surface. This field was a certified organic field.
A history of manure samples showed 25 pounds of available nitrogen per 1,000 gallons in the swine finishing manure. The subsurface application involved slicing the soil every 7.5 inches to a width of approximately three eights of an inch and having a boot to place the manure over the soil opening. The soil slices were approximately three and a half inches deep. This field was organic and the wheat had been planted as a surface seeding and incorporated with shallow tillage the previous fall so there were no rows to follow. Due to the width of the dual tires on the application tractor and the flotation tires on the manure tanker, we estimated 40% of the wheat was flattened during the application process. The wheat was in the V4 stage of growth when the surface and subsurface manure treatments were applied. The field was harvested in early July using a John Deere combine with a 30-foot header.
On the Maag field, the subsurface manure treatment was compared to 100 pounds per acre of nitrogen applied as 28%Urea Ammonium Nitrate (UAN). On this field, the manure applicator traveled at a slight angle (approximately 10%) to the direction the wheat was planted to avoid having the toolbar follow the row. Both the manure and the 28%Urea Ammonium Nitrate treatments were applied the same day. As with the Haselman field, we estimated 40% of the wheat was flattened during the application process. This was the last of the three fields treated and the wheat was in the late V5 stage of growth due to weather delays and the commercial applicator having other manure application commitments. The 28% UAN was applied with an applicator with a 120 foot boom width.
The Leopold field involved wide-row wheat in a field that was transitioning into organic status. The wheat had been planted in twin rows that were five inches apart and left 22.5 inches for equipment to travel between the twin rows. The Grassland Application toolbar was connected to a smaller tractor and tanker with wheels designed to travel between the wheat rows. As a result, there was very little wheat run over and minimal plant damage from the application toolbar. Previous manure samples from this swine nursery indicated 17 pounds of available nitrogen per 1,000 gallons. The subsurface manure application rate was 6,000 gallons per acre to get 102 pounds of available nitrogen. This was compared to 6,000 gallons of surface applied manure.
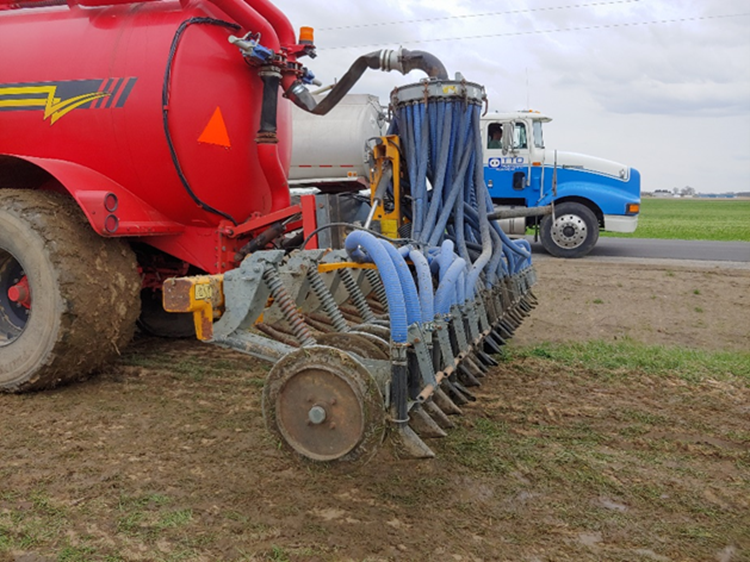
Figure 1: Closeup view of the Grassland Applicator toolbar.
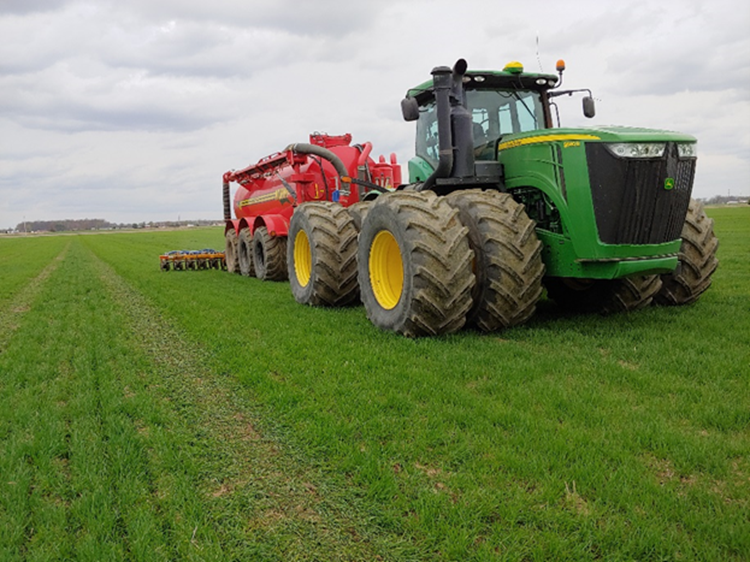
Figure 2: Manure application to V4 stage wheat.
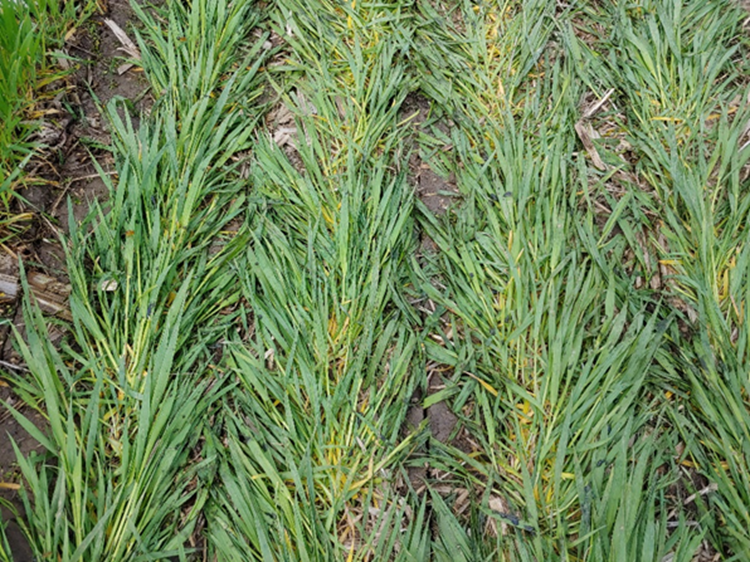
Figure 3: V5 stage wheat flattened by the manure tanker. Soil slices are the Grassland Applicator toolbar.
Figure 4: Wide-row wheat with subsurface nursery manure application.
Manure samples were collected and analyzed during the application process.
Table 1. Average nutrient analysis of swine manure applied.
Swine Finishing Manure
Swine Nursery Manure
Nutrient
Pounds per 1,000 gallons
Pounds per 1,000 gallons
Total Nitrogen
26.2
18.1
Ammonium Nitrogen (NH4)
24.4
16.5
Organic Nitrogen
1.2
1.0
Available Nitrogen
25.0
17.0
Phosphorus (P2O5)
7.1
4.3
Potash (K2O)
10.9
8.2
What Have We Learned
In the Haselman organic wheat field, the subsurface applied manure yielded less than the surface applied manure. The thought process is that the damage to the wheat plants and roots caused by the Grassland Applicator toolbar is responsible for this reduction. The wheat plants were in Feeks growth stage four and handled the tractor and tanker damage well. The tractor and manure tanker tracks through the field were visible but did not appear to cause much damage to the wheat.
In the Maag Farm where subsurface applied manure was compared to commercial fertilizer the subsurface applied yields were higher than the commercial fertilizer yields. This field was in Feekes growth stage five when the treatments occurred. The damage from the manure tanker tires was easy to see for over three weeks as plant growth was badly stunted. The size of the wheat heads in these tracks were much smaller than the undamaged areas of the field. Damage from the tractor tires seemed minimal even though the wheat was more advanced than we wanted.
In the Leopold field wide-row wheat plot, the incorporated manure outyielded the surface applied manure. The tractor tires and the Grassland Applicator toolbar caused minimal damage to the wheat plants. This field was also in Feekes growth four.
Table 2. Wheat yields for treatments comparing nitrogen applied as UAN at planting to side-dressed hog manure. Subscript letters a and b indicate yields that year were statistically different using ANOVA at 0.05 probability level.
Yield in Bushels per Acre
Treatments
Haselman Farm
Maag Farm
Leopold Farm
Subsurface applied finishing manure
95.4
102.6
Surface applied swine finishing manure
93.2
28% Urea Ammonia Nitrate
96.9
Subsurface applied swine nursery manure
82.1
Surface applied swine nursery manure
79.3
Least Significant Difference (0.05)
3.35
13.95
7.33
Coefficient of Variability
1.01
3.99
3.99
The subsurface application of manure using the Grassland Applicator produced wheat yields statistically similar to surface applied manure in the Haselman field. The surface applied manure had less damage to the wheat plants due to the applicator coulters not cutting into the soil.
In the Maag field the subsurface applied manure produces slightly higher yields (although not statistically higher) to the commercial fertilizer. The damage to the wheat field was severe where the tires of the tanker all but killed the wheat plants. The wheat was almost to elongation (Feekes growth stage six) and this field was the most advanced of the three fields studied. The damage from the tractor tires was not severe but the plant damage from the extreme weight of the tanker tires was evident. There was a delay in getting the commercial manure applicator to the field and this resulted in the wheat being more advanced than planned. Wheat heads from plants in the tire tracks were half the size of those where just the tractor track traveled. Wheat heads from the manured treatments also appeared to be larger than the wheat heads from the commercial fertilizer treatments.
In the Leopold field the surface applied manure was slightly less than incorporated manure. Since there was minimal plant damage to the wide-row wheat from the toolbar or the tractor, incorporating the manure may have saved more of the nitrogen compared to the surface applied manure.
Rainfall in the area of the three research fields from April 1st to June 15th was measured at 6.86 inches. Field conditions were unusually dry during application time which helped reduce damage from the tractor and manure tanker tires.
Future Plans
In this study the subsurface application of liquid swine finishing manure and liquid swine nursery manure produced wheat yields similar to surface applied manure and commercial fertilizer. We intend to continue this study in 2022 and 2023 with these farmers to gather additional data.
To avoid the damage from the manure tanker tires, a more ideal situation would be to connect the Grassland Applicator tool bar to a drag hose. This would be a more efficient method to apply manure and cause less field damage and compaction. We also plan to use the toolbar to eventually apply manure to forages between cuttings.
Authors
Arnold, G., Field Specialist, Manure Nutrient Management Application, Ohio State University Extension
Additional Information
Sundermeier, A. (2010). Nutrient management with cover crops. Journal of the NACAA, 3(1). Retrieved from https://www.nacaa.com/journal/index.php?jid=45
Vitosh, M. L., Johnson, J. W., & Mengel, D. B. (2003). Tri-state Fertilizer Recommendations for Corn, Soybeans, Wheat and Alfalfa. Purdue Extension, Lafayette, IN.
Zhang, W., Wilson, R. S., Burnett, E., Irwin, E. G., & Martin, J. F. (2016). What motivates farmers to apply phosphorus at the “right” time? Survey evidence from the Western Lake Erie Basin. Journal of Great Lakes Research, 42(6), 1343–1356. https://doi.org/10.1016/j.jglr.2016.08.007
Facebook Page: Ohio State University Environmental and Manure Management
The authors are solely responsible for the content of these proceedings. The technical information does not necessarily reflect the official position of the sponsoring agencies or institutions represented by planning committee members, and inclusion and distribution herein does not constitute an endorsement of views expressed by the same. Printed materials included herein are not refereed publications. Citations should appear as follows. EXAMPLE: Authors. 2022. Title of presentation. Waste to Worth. Oregon, OH. April 18-22, 2022. URL of this page. Accessed on: today’s date.
The overall purpose of this research was to demonstrate the volume, weight and moisture reduction from composting pen pack cattle manure so that organic nutrients can be transported farther from the livestock barn. Simultaneously, through laboratory analysis, the goal was to measure the nutrient density of the compost from the start of the process to the finish. The reduction in volume will allow cattle farmers to store more manure in their dry stack (manure) barns to be land-applied at more ideal times, thus avoiding winter application on frozen and/or snow-covered ground.
Due to the overwhelming weight and volume logistics of unprocessed (raw) manure in general, often the manure is land-applied to fields relatively close to the livestock barn. This phenomenon has historically resulted in some fields or areas within fields that have high or luxury levels of soil test phosphorus and potassium. Manure is a great source of nutrients and organic matter for crop production. Avoiding application of manure on fields that are farther from the livestock barn can result in lower soil health and missed economic opportunity for these fields. Once a drier, more nutrient-dense compost is created, a second purpose of the research is to promote transfer of the compost to fields that are farther from the livestock barn or to fields with lower soil test phosphorus or potassium levels.
A final purpose of the research is to utilize compost in corn production systems to evaluate its benefit when applied at the same nutrient rate as its raw manure or commercial fertilizer counterparts. When manure or compost are added to a crop production system, the health and biology of the soil are improved.
What Did We Do
The study began by working with local cooperators who currently raise cattle and manage manure nutrients. This peer learning group included five (5) cooperators. Each cooperator was asked to build at least one windrow of pen pack (solid, dry bedded) manure removed from their cattle barn. The windrow was not to exceed 6 feet in height by 12 feet in width and could be of any length. All manure was weighed at the start of the composting process and then at the end of the process to measure weight reduction. To measure volume, windrows were measured (height x width x length) at the start and finish; cooperating farmers recorded ‘trucks in’ and ‘trucks out’. The five cooperators built eight (n=8) windrows for the purpose of this study.
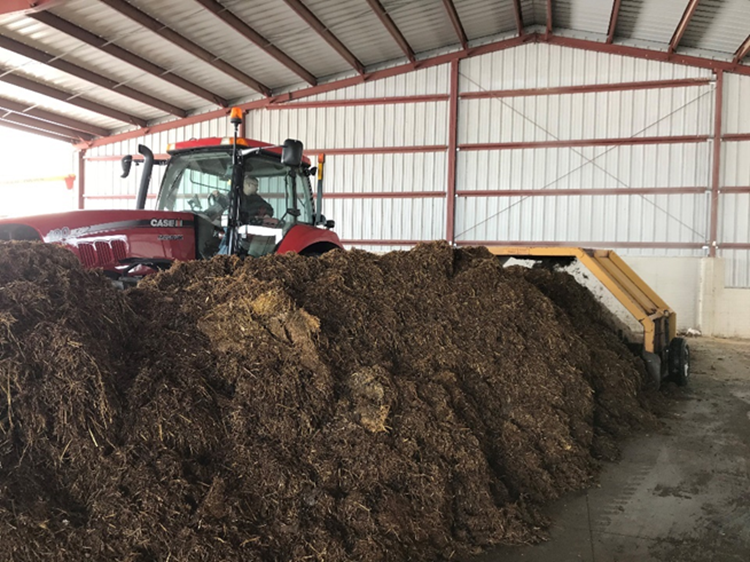
For baseline data, all cooperators were asked to dedicate one windrow for weekly mechanical compost turning inside a dry stack barn for eight (8) weeks. Any additional windrows composted were to address research questions raised by cooperators. Two ‘additional’ windrows were turned every 2 weeks and a third ‘additional’ windrow was turned weekly, but in an outdoor setting. Mechanical composting was achieved with an HCL Machine Works pull-type compost turner (Figure 1). The compost turner accomplished two key things: consistently mixing compost ingredients (manure, sawdust, wheat straw), and adding oxygen into the composting system. The compost turner was pulled by a Case IH 190 Magnum tractor equipped with a continuously variable transmission (CVT). The CVT allowed for critical ultra-slow speeds (.05-.15 mph) necessary for early mixing passes with the compost turner and raw ingredients.
Figure 1. A pull-type compost turner (6 foot x 12 foot) used for this study
Another significant part of the research was manure nutrient analysis. Every windrow site (n=8) had 3 samples pulled for analysis: once at the start of composting, after every compost turn (6-8 turns on average) and when the compost was land applied or at the last turn. Key nutrients analyzed were nitrogen, phosphorus, potassium, sulfur and calcium. Additionally, temperatures were monitored using a 36” dial compost thermometer (Figure 2) prior to every turn to ensure adequate composting temperatures (120-140 deg F ideally) were maintained. Each windrow also had a HOBO temperature logger inserted in the center of the pile for temperature logging every 15 minutes for the duration of the process.
Figure 2. Compost thermometers (36”) were used to double-check pre-turn temperatures each week
Finally, cooperators were asked to work with the researcher to develop a replicated field trial in field corn utilizing the finished compost product from their farm. Generally, the goal of the field trials were to compare a ‘normal’ rate of manure against a half rate of compost (Figure 3). Yield and moisture data from field trials were collected and analyzed.
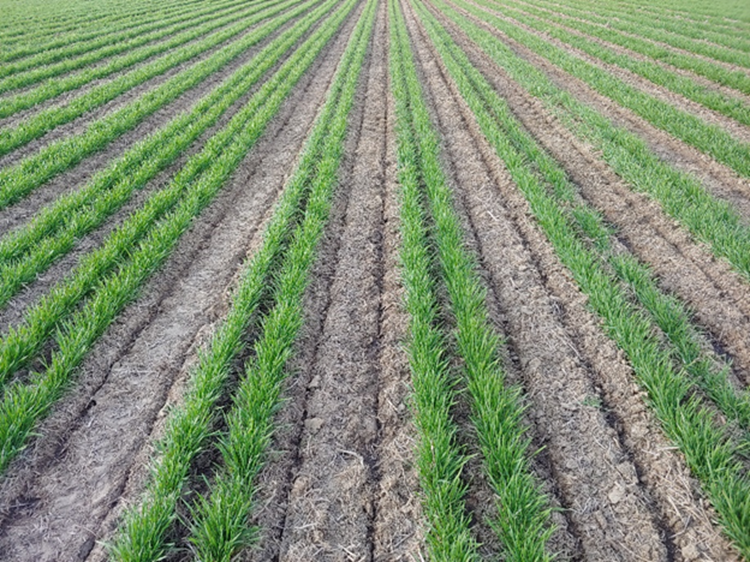
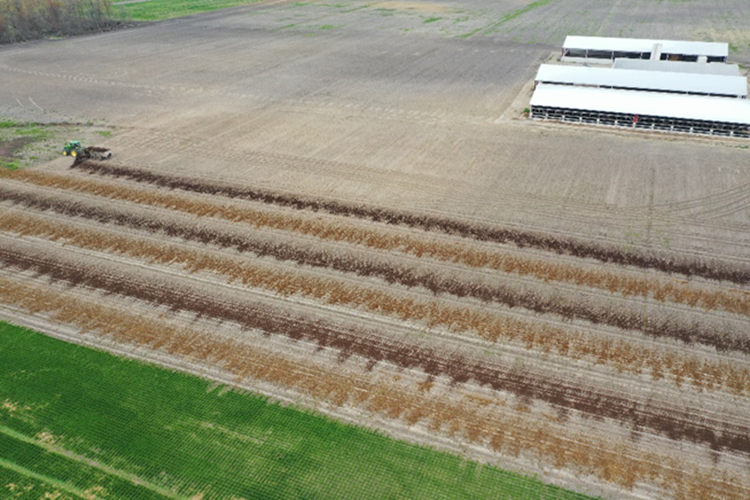
Figure 3. Land application of manure (light in color) and compost (dark in color) for replicated strip trials in corn.
What Have We Learned
This research began with an aggregated 258 tons of unprocessed (raw) pen pack cattle manure among 8 sites (windrows) and yielded 121 tons of finished compost, a 53% reduction in weight. However, the volume reduction was less significant than the reduced weight. The number of ‘trucks in’ versus ‘trucks out’ resulted in 28% reduction in volume. The average initial moisture of raw manure was 66% as compared the average final moisture of 48%.
Cooperators turned compost for a minimum of five weeks with some turning up to eight weeks. The average number of turns was seven weeks for each of the eight windrow sites.
The starting nutrient analysis of the manure on a per ton basis was 8 lbs total nitrogen (TKN), 8 lbs phosphorus (P), 14 lbs potassium (K), 1.5 lbs sulfur (S), and 4.5 lbs Calcium (Ca). The finished compost averaged 7.5 lbs TKN, 20 lbs P, 31 lbs K, 3 lbs S, and 12 lbs Ca per ton. Except for total nitrogen, nutrient density more than doubled for these key nutrients as a result of the composting process (Figure 4). It is assumed that nitrogen was consumed in the composting process resulting in increased organic matter and organic carbon.
Figure 4. Density of key nutrients doubled for phosphorus, potassium, sulfur and calcium from the start of composting to the finished product (n=8 sites)
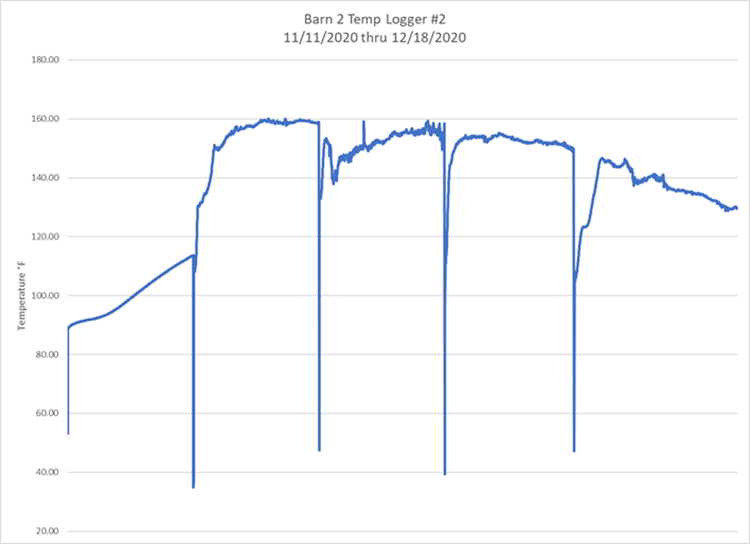
Temperatures were monitored weekly and temperature data indicated that only one windrow dropped below 100 degrees Fahrenheit during the 8-week process. This windrow was smaller than the others and the compost was happening in below freezing temperatures that occurred in the month of February 2021.
Figure 5. Buried temperature loggers monitored compost temperatures throughout the research. Temperature drops resulted when loggers were removed for compost turning and then replaced
Finally, three replicated field trials were conducted in field corn to compare full rates of manure versus half rates of compost (Tables 1, 2, 3). One more comprehensive trial included a university recommended fertilizer rate as well (Table 4). On average, the compost was hauled 4.5 miles from the livestock barn, thus giving some promise to improved transport of manure/compost to farther field locations. The results below are from one year of data at each respective site and should be interpreted as such.
Table 1: Site 1 – Corn for grain
Treatments
Harvest Moisture (%)
Yield (bu/acre)
10 tons/ac MANURE
17.5
252 a
5 tons/ac COMPOST
17.8
245 a
LSD: 11.5, CV 2.0
Table 2: Site 2 – Corn for grain
Treatments
Harvest Moisture (%)
Yield (bu/acre)
Check (no manure or compost)
18.0
258 a
6 tons/ac MANURE
17.9
259 a
3 tons/ac MANURE
18.1
258 a
LSD: 9.7, CV 2.1
Table 3: Site 3 – Corn for silage
Treatments
Harvest Moisture (%)
Yield (bu/acre)
10 tons/ac MANURE
57.8
23.8 a
5 tons/ac COMPOST
57.8
22.7 a
LSD: 1.7, CV 3.1
Table 4: Site 4 – Corn for grain
Treatments
Harvest Moisture (%)
Yield (bu/acre)
Fertilizer (22-52-120-12s/ac)
17.6
190 b
10 tons/ac MANURE
17.7
213 a
5 tons/ac MANURE
17.5
202 ab
LSD: 14.9, CV 4.3
Future Plans
Future plans include adding 4-5 more windrow sites before this 2023 grant expires. In 2022 and 2023, the hope is to compare static windrows versus those that are turned mechanically. In the first 8 sites, compost turning was based on time (weekly or bi-weekly turn). In the future, oxygen level or temperatures should be evaluated to help determine timing of turning. From a crop yield perspective, measuring soybean yields in the year following corn where the compost, manure or fertilizer was applied would be informative for growers as they make decisions about improving placement (transport) of manure or compost further from the livestock barn or to fields that have low soil test phosphorus or potassium. Finally, a complete economic analysis of the composting plus further transport needs to be conducted via a case study model.
Authors
Eric A. Richer, Assistant Professor and Extension Educator, Ohio State University Extension
richer.5@osu.edu
Additional Authors
-Jordan Beck, Water Quality Extension Associate, Ohio State University Extension
-Glen Arnold, Field Specialist, Manure Nutrient Management, Ohio State University Extension
This work is supported by a Great Lakes Sediment and Nutrient Reduction Program grant. Thanks to the five cooperating farmers who participated in this research study with Ohio State University Extension. Thanks to Stuckey Brothers Farms for use of compost turner and Redline Equipment for rental of Case IH 190 Magnum tractor.
The authors are solely responsible for the content of these proceedings. The technical information does not necessarily reflect the official position of the sponsoring agencies or institutions represented by planning committee members, and inclusion and distribution herein does not constitute an endorsement of views expressed by the same. Printed materials included herein are not refereed publications. Citations should appear as follows. EXAMPLE: Authors. 2022. Title of presentation. Waste to Worth. Oregon, OH. April 18-22, 2022. URL of this page. Accessed on: today’s date.
The purpose of this presentation is to provide a complete overview of ODA’s Division of Livestock Environmental Permitting (“ODA-DLEP”). ODA-DLEP regulates any livestock facility in Ohio that has the following number of animals or greater:
700 mature dairy cows
1,000 beef cattle or dairy heifers
2,500 swine weighing more than 55 pounds
10,000 swine weighing less than 55 pounds
82,000 layers
125,000 broilers or pullets
500 horses
55,000 turkeys
What Did We Do
Ohio Department of Agriculture’s Division of Livestock Environmental Permitting (“ODA-DLEP”) regulates the siting, construction, and operation of Ohio’s largest livestock facilities, referred to as Concentrated Animal Feeding Facilities (“CAFF”). ODA-DLEP’s primary objective is to minimize any water quality impacts, including both surface and ground waters, associated with the construction of new or expanding CAFFs, as well as implementation of best management practices once a CAFF becomes operational. These best management practices include management of manure, insect and rodent control, mortality management, and emergency response practices. ODA-DLEP issues Permits to Install (for construction) and Permits to Operate (for operations).
In addition, ODA-DLEP conducts routine inspections of each CAFF at least once a year, responds to complaints, and participates in emergency response. Inspections are conducted to review a CAFF’s compliance with Ohio Revised Code 903 and Ohio Administrative Code 901:10, the laws and regulations governing Concentrated Animal Feeding Facilities.
Finally, ODA-DLEP administers the Certified Livestock Manager program. Any individual in the State of Ohio that manages 4,500 dry tons of solid manure or 25 million gallons of liquid manure is required to be a Certified Livestock Manager (“CLM”).
What Have We Learned
Livestock operations continue to get larger and more concentrated and as a result, regulations are necessary to ensure proper handling and management of manure, particularly with land application of manure.
Future Plans
Over the past several years, DLEP has started to see more interest in manure treatment technologies. This could include, but is not limited to, anaerobic digestion, nutrient recovery, solids separation, and wastewater treatment. Technologies like this could greatly alter the landscape of the livestock industry by fundamentally changing the way manure is handled and how nutrients from manure are applied. DLEP does have regulations in place to account for manure treatment technologies. However, regulations, and specifically changes to regulations, cannot maintain the same pace as these technological advancements.
Authors
Samuel Mullins, Chief of ODA-Division Livestock Environmental Permitting
Samuel.mullins@agri.ohio.gov
The authors are solely responsible for the content of these proceedings. The technical information does not necessarily reflect the official position of the sponsoring agencies or institutions represented by planning committee members, and inclusion and distribution herein does not constitute an endorsement of views expressed by the same. Printed materials included herein are not refereed publications. Citations should appear as follows. EXAMPLE: Authors. 2022. Title of presentation. Waste to Worth. Oregon, OH. April 18-22, 2022. URL of this page. Accessed on: today’s date.
Dairy farmers and their key advisors, the balance of the dairy value chain, policy makers, government officials, non-governmental organizations (NGOs), and astute consumers value best available information about the greenhouse gas (GHG) emissions associated with milk production. In 2020, the Innovation Center for US Dairy set three 2050 environmental stewardship goals spanning from cradle to processor gate, including GHG neutrality. Further, they committed to reporting on progress towards the goals every five years starting in 2025.
Dairy farming economics will continue to drive production consolidation, a trend that substantially began in the 1960s. Consolidation results in fewer total farms yet only somewhat fewer total cows overall; thus, the number of cows per farm has substantially increased. The best management practice of long-term manure storage (LTS) was developed by USDA NRCS decades ago to protect water quality due to manure runoff and infiltration. The number of farms with LTS increased as the number of cows per farm increases. Overall, LTSs are largely anaerobic, resulting in the emission of methane (CH4) and in some cases nitrous oxide (N2O). It is generally understood that the 2nd largest cradle to farm gate CH4 emission source is LTS. Continued industry consolidation will result in more LTS over time.
Continued use of (LTS) to protect water quality, coupled with today’s use of manure treatment practices on-farm and the US dairy and other GHG reduction goals set are important reasons to quantify manure-based GHG emissions.
What Did We Do
To help dairy farmers and others understand the relative impact manure management (MM) has on GHG emissions, seven integrated MM systems that are utilized by farmers in the Northeast/upper Midwest were analyzed. The approach was to calculate the GHG emission impacts using best available information and procedures. The seven systems analyzed, each shown in process flow order, were:
1. Long-term storage (LTS)
2. Solid-liquid separation (SLS), LTS
3. SLS, LTS with cover/flare (CF)
4. Anaerobic digestion (AD) of manure only, SLS, LTS
5. AD, SLS, LTS with CF
6. AD of manure/food waste, SLS, LTS with CF
7. AD of manure/food waste, SLS, LTS with cover/gas utilization
The resulting net GHG emission values were compared to the baseline MM practice of daily spreading.
Impact of systems on GHG emissions associated with LTS and offsets from net energy production and landfill organics diversion (anaerobic digestion systems only) were included. Results were normalized on a metric ton of carbon dioxide equivalent (CO2e) per cow-year basis. A 100-year global warming potential (GWP100) value of 25 and a 20-year GWP20 (84) were used for comparative purposes in calculating CO2e. A sensitivity analysis was conducted to understand the impact of volatile solid (VS) biodegradability on GHG emissions and anaerobic digester system biogas leakage.
What Have We Learned
Not surprisingly, results show that the largest GHG reduction opportunity was from anaerobic co-digestion of dairy manure with community substrate (7. above). The net GHG emission from this system was -16 (GWP100) and -43 (GWP20) metric tons CO2e per cow-year (GHG avoidance). This is compared to the GHG emission of 1.9 (GWP100) and 5.6 (GWP20) metric tons CO2e per cow-year from the LTS (1. above). Sensitivity analysis results showed manure VS degradability had meaningful impact on GHG emissions, particularly for Scenario 4, and for the co-digestion scenarios, the most significant impact – 5% – resulted in a leakage increased from 1% to 3%. While using SLS with an impermeable cover and flare system on a separated liquid manure LTS reduces CH4 emissions as compared to uncovered long-term liquid manure storage, the practice does not provide an opportunity to achieve net zero or better manure enterprise GHG footprint because the energy in the biomass is wasted and diversion of organics from landfills cannot be effectively included.
Future Plans
Next step is to develop additional results for integrated MM systems that included advanced manure treatment technologies that further reduce the organic loading on LTSs. Further parallel work will focus on quantifying these same advanced manure treatment technologies on their partitioning of digester effluent nutrients for off-farm export.
Authors
Curt A. Gooch, Sustainable Dairy Product Owner, Land O’Lakes – Truterra
cgooch@landolakes.com
Additional Authors
-Peter E. Wright, Extension Associate, Cornell PRO-DAIRY Dairy Environmental Systems Program
-Lauren Ray, Extension Support Specialist III, Cornell PRO-DAIRY Dairy Environmental Systems Program
The Coalition for Renewable Natural Gas and the New York State Department of Agriculture and Markets provided financial resources to support this work.
The authors are solely responsible for the content of these proceedings. The technical information does not necessarily reflect the official position of the sponsoring agencies or institutions represented by planning committee members, and inclusion and distribution herein does not constitute an endorsement of views expressed by the same. Printed materials included herein are not refereed publications. Citations should appear as follows. EXAMPLE: Authors. 2022. Title of presentation. Waste to Worth. Oregon, OH. April 18-22, 2022. URL of this page. Accessed on: today’s date.
Approximately, 11% of the poultry operations in the United States are in the five-state region of the Chesapeake Bay Watershed (Bay), representing 7,000 family farms and generating about $1.1B in revenues. The Bay states have identified a variety of manure management practices and programs to help meet the nutrient reduction targets set in the Bay-Total Maximum Daily Load plan. Poultry-litter fueled on-farm thermal conversion processes (PL-TCP) can be used to generate renewable thermal energy for heating poultry houses. Additionally, PL-TCP can potentially enhance nutrient management alternatives by concentrating the phosphorus- and potassium-rich ash co-products to enable reaching more distant markets more efficiently. However, due to PL fuel properties, scale- and setting-appropriate emission abatement has been a challenge for on-farm PL-TCP.
What Did We Do
This project assessed total particulate matter (TPM) emissions for two PL-TCP systems on two poultry farms, S1 and S2, and at a technology provider facility (S3). S1 is located in Pennsylvania on a 60-acre farm with two 24,000 sq. ft poultry houses. The farm raises certified-organic broilers on approximately six-week flock cycles resulting in an average of five flock cycles per year per house. The biomass boiler and heat distribution systems were installed by Total Energy Solutions (TES) to provide heating for two poultry houses and an adjacent mechanical shop in 2012. The system specified by TES uses a biomass boiler (model CGS-225 and rated at 1.5 MMBtu/hr) marketed through Triple Green Products (TGP), Morris, Manitoba. S2 is also located on a poultry farm in Pennsylvania with three 24,000 square foot poultry houses for antibiotic free broilers, with an average of six-and-a-half flock cycles per year per house. In 2015, the farmer installed two Bio-Burner BB-500 heating units from LEI Products, a firm now doing business as OrganiLock, to heat two of the poultry houses. The heating units are each rated 0.5 MMBtu/hr and were installed in a mechanical room located between two poultry houses. S3 is located at the OrganiLock corporate headquarters in Kentucky where a bioenergy unit, similar to that at S2, is used for testing purposes.
The TPM emissions were assessed using EPA source testing methods. Seventy-eight emission tests were completed for 15 different system configurations. First, we established the baseline TPM emissions and shared this information with collaborating technology providers to inform their modifications to the TPM-emission abatement control systems to meet the stated project TPM reduction goal of at least 70%. Base case emission factors were estimated as 3.851 and 2.885 TPM-lb/MMBtu for S1 and S2, respectively. Abatement system upgrades consisted of cyclones with a bag filter system at S1, a wet scrubber at S2, and filtration media at S3. Three levels of a fuel additive were used during seven source emission tests in the bioenergy unit at S3. The fuel additive consisted of an aluminosilicate mineral product and dosed with the poultry litter fuel at 2%, 5%, and 10%, by weight (w.b.). Additionally, farmers were interviewed to share their experiences operating the on-farm bioenergy units for use in broader outreach dissemination.
What Have We Learned
The abated emission factor for the S1 system was 0.187 TPM-lb/MMBtu, a 95% reduction relative to the base case. While the abated emission factor for the S2 system was 1.887 TPM-lb/MMBtu, a 35% reduction relative to the base case. The use of the mineral additive at S3 at a 10% fuel mix reduced the emission factor for that system from 2.885 to 1.098 TPM-lb/MMBtu, a 61% reduction. Three educational videos were developed from recorded farmer interviews to document and share actual experiences operating these on-farm bioenergy systems. The intent of these videos is to help inform potential future adopters of these technologies on the first-hand operational experiences shared by the technology host farmers managing these on-farm poultry little-to-energy technologies.
Future Plans
Future areas of work include: develop a techno-economic assessment to understand the economic viability of fully-abated systems, including farmer/service provider time requirements and to compare to other nutrient and energy management strategies; optimize abatement systems to evaluate options for lower capex/opex abatement strategies; evaluate fuel additives to replicate emission reductions and assess impacts to broader system performance; benchmark fuel properties to characterize the range of highly variable PL more suitable for thermal conversion processes; and assess the key factors for broader adoption.
Authors
John Ignosh, Extension Specialist, Dep. Biological Systems Engineering, Virginia Tech, Harrisonburg, VA, USA
Jignosh@vt.edu
Additional Authors
Jactone Ogejo, Associate Professor & Extension Specialist, Dep. Biological Systems Engineering, Virginia Tech, Blacksburg, VA, USA
The authors are solely responsible for the content of these proceedings. The technical information does not necessarily reflect the official position of the sponsoring agencies or institutions represented by planning committee members, and inclusion and distribution herein does not constitute an endorsement of views expressed by the same. Printed materials included herein are not refereed publications. Citations should appear as follows. EXAMPLE: Authors. 2022. Title of presentation. Waste to Worth. Oregon, OH. April 18-22, 2022. URL of this page. Accessed on: today’s date.
Manage Cookie Consent
To provide the best experiences, we use technologies like cookies to store and/or access device information. Consenting to these technologies will allow us to process data such as browsing behavior or unique IDs on this site. Not consenting or withdrawing consent, may adversely affect certain features and functions.
Functional
Always active
The technical storage or access is strictly necessary for the legitimate purpose of enabling the use of a specific service explicitly requested by the subscriber or user, or for the sole purpose of carrying out the transmission of a communication over an electronic communications network.
Preferences
The technical storage or access is necessary for the legitimate purpose of storing preferences that are not requested by the subscriber or user.
Statistics
The technical storage or access that is used exclusively for statistical purposes.The technical storage or access that is used exclusively for anonymous statistical purposes. Without a subpoena, voluntary compliance on the part of your Internet Service Provider, or additional records from a third party, information stored or retrieved for this purpose alone cannot usually be used to identify you.
Marketing
The technical storage or access is required to create user profiles to send advertising, or to track the user on a website or across several websites for similar marketing purposes.