Confinement and concentration of livestock and poultry production decades ago exacerbated nuisance and health effects caused by emissions of odor, particulate matter (dust) and gases from animal manure. Concern about health effects on animals and farm workers are due to potential exposure to high concentrations of various noxious gases and particulate matter. People downwind of production facilities and land application of manure are concerned about both nuisance odor and health effects, resulting in lawsuits, community protests, government regulations, and state and federal consent decrees and agreements. Besides the chronic issue of odor, livestock production’s emissions of ammonia, hydrogen sulfide, volatile organic compounds, greenhouse gases, and bioaerosols have also created potential problems depending on livestock species, site location, and facility design, and management. Major technical air quality issues facing livestock producers are: 1) obtaining suitable sites for new facilities, 2) selecting effective and practical mitigation methods, if necessary, 3) obtaining reliable and economical on-farm measurements of pollutant concentrations and emissions, 4) estimating pollutant emission rates at their farms, and 5) managing manure to minimize impacts of pollutant emissions.
The authors are solely responsible for the content of these proceedings. The technical information does not necessarily reflect the official position of the sponsoring agencies or institutions represented by planning committee members, and inclusion and distribution herein does not constitute an endorsement of views expressed by the same. Printed materials included herein are not refereed publications. Citations should appear as follows. EXAMPLE: Authors. 2022. Title of presentation. Waste to Worth. Oregon, OH. April 18-22, 2022. URL of this page. Accessed on: today’s date.
Odor emissions from animal feeding operations (AFOs) remain a significant nuisance issue. Some neighboring communities of AFOs have complained that odor degraded their quality of life and well-being. Odor is a subjective response of humans, and the perception of odor varies significantly among people. Farmers may have been used to the farm smells and do not feel odor offensive. However, people with no farming background may be sensitive to odor and experience many different physiological and psychological responses to odor.
Unbiased scientific assessments are needed to resolve conflicts among farmers and neighboring communities and make objective and informed decisions about best management practices for odor mitigation in animal productions. Due to the complication and high cost of odor measurement, limited odor data are available to facilitate scientific understanding and develop effective mitigation of the odor concerns. The presentation reports on-farm odor sampling methods, measurement of odor concentrations in labs, and estimation of odor emission rates (ERs) for representative animal production farms in Ohio.
What Did We Do
Over the past decades, we have developed many research and extension projects to evaluate air quality and emissions at typical Ohio farms through seasonal on-farm sampling and monitoring measurement. The farms include swine, dairy, and poultry layer farms. Odorous air was sampled into 10-L Tedlar bags using a SKC-Vac-U-Chamber (SKC Inc., 863 Valley View Road, Eighty-Four PA 15330). The odor samples were shipped to the odor lab at Purdue University within 30 h of collection for measurement of odor concentrations (OUE m-3) using a dynamic olfactometer (AC’SCENT International Olfactometer, St. Croix Sensory, Inc., Stillwater, MN, USA).
When it was feasible to measure ventilation rates of animal facilities, the ventilation rate data along with the odor concentration data were used to estimate odor emission rate from the animal facilities. Further, the odor concentration and emission data were analyzed to identify correlation with environmental conditions and other air pollutant emissions, such as ammonia emission, to seek effective management practices for odor control.
What Have We Learned
Odor sources are animals and their manure and therefore can be physically associated with animal buildings, manure storages, and fields of manure land application. Different animal operations result in significantly different odor levels and liquid manure management practices are associated with higher odor levels.
The odor characteristics of layer house exhaust air were strongly associated with layer manure characteristics. The annual mean odor concentration was quantified as 355 ± 112 OUE m-3, and the annual mean odor emission rate was estimated as 0.14 ± 0.11 OUE s-1 hen-1for two manure-belt layer houses in Midwest region.
Significant seasonal variations were observed in odor concentrations inside the layer houses with high concentrations in summer and winter. The odor emission rates were the lowest in spring, but not significantly different in summer, fall, and winter.
House ventilation rate significantly affected odor emission rates, with higher ventilation rates corresponding to higher odor emissions. Ammonia concentration and emission rate inside the layer houses were significantly and positively correlated with the odor concentrations and emission rate.
Odor concentrations decrease exponentially as distances from the sources increase. Odor dispersion is affected by many factors. The data analysis also indicated seasonal and spatial variations in odor levels on farms, and the times and places that effective mitigation is needed. Measurements of odor are fundamentally important to understand odor concerns, develop estimation tools and effective mitigation.
Future Plans
Continue to develop odor mitigation management practices and technologies and tools to predict odor emission and dispersion from animal feeding operations.
Authors
Lingying Zhao, Professor and Extension Specialist, The Ohio State University
zhao.119@osu.edu
Additional Authors
-Glen Arnold, Assoc. Professor and Extension Field Specialist, The Ohio State University
-Mike Brugger, Faculty Emeritus, The Ohio State University
-Roger Bender, Former OSU Extension Educators. The Ohio State University
-Gene McClure, Former OSU Extension Educators. The Ohio State University
-Eric Immerman, Former OSU Extension Educators. The Ohio State University
-Albert Heber, Professor Emeritus, Purdue University
-JiQin, Ni, Professor, Purdue University
Additional Information
Airquality.osu.edu
Zhao, L.Y., L.J. Hadlocon, R. B. Manuzon, M. J. Darr, X. Tong, A.J. Heber, and J.Q. Ni. 2015. Odour concentrations and emissions at two manure-belt egg layer houses in the U.S. J.Q. Ni, T.T. Lim, C. Wang (Eds.). In Animal Environment and Welfare–Proceedings of International Symposium (pp 42-49). Rong Chang, China, October 23-26th.
Acknowledgements
The air quality survey studies on Ohio farms were supported by the internal SEED grants of the Ohio Agricultural Research and Development Center, College of Food, Agricultural and Environmental Sciences, The Ohio State University.
The poultry layer house study was supported by the National Institute of Food and Agriculture, U.S. Department of Agriculture, under award number 2005-35112-15422.
Appreciation is also expressed to the participating producers and staff for their collaboration and support.
The authors are solely responsible for the content of these proceedings. The technical information does not necessarily reflect the official position of the sponsoring agencies or institutions represented by planning committee members, and inclusion and distribution herein does not constitute an endorsement of views expressed by the same. Printed materials included herein are not refereed publications. Citations should appear as follows. EXAMPLE: Authors. 2022. Title of presentation. Waste to Worth. Oregon, OH. April 18-22, 2022. URL of this page. Accessed on: today’s date.
The United States Department of Agriculture-Natural Resources Conservation Service (USDA-NRCS) works in a voluntary and collaborative manner with agricultural producers to solve natural resource issues on private lands. One of the key steps in formulating a solution to those natural resource issues is a conservation planning process that identifies the issues, highlights one or more conservation practice standards that can be used to address those issues, and allows the agricultural producer to select those conservation practices that make sense for their operation. In this conservation planning process, USDA-NRCS looks at natural resource issues related to soil, water, air, plants, animals, and energy (SWAPA+E). This presentation focuses on the resource concerns related to the air resource.
What Did We Do
In order to facilitate the conservation planning process for the air resource, USDA-NRCS has focused on five main issues: emissions of particulate matter (PM) and PM precursors, emissions of ozone precursors, emissions of airborne reactive nitrogen, emissions of greenhouse gases, and objectionable odors. Each of these resource concerns are further subdivided into resource concern components that are mainly associated with different types of sources or activities found on agricultural operations. By focusing on those agricultural sources and activities that have the largest impact on each of these air quality and atmospheric change resource concerns, USDA-NRCS has developed a set of planning criteria for determining when a resource concern exists. We have also identified those conservation practice standards that can be used to address each of the resource concern components.
What Have We Learned
Our focus on the agricultural sources and activities that have the largest impact on air quality has helped to evolve the conservation planning process by adding resource concern components that are targeted and simplified. This approach has led to a clearer definition of when a resource concern is identified, as well as how to address it. For example, the particulate-matter focused resource concern has been divided into the following resource concern components: diesel engines, non-diesel engine combustion equipment, open burning, pesticide drift, nitrogen fertilizer, dust from field operations, dust from unpaved roads, windblown dust, and confined animal activities. Each of these types of sources can produce particles directly or gases that contribute to fine particle formation. In order to know whether a farm has a particulate matter resource concern, a conservation planner would need to determine whether one or more of these sources is causing an issue. Once the source(s) of the particulate matter issue is identified, a site-specific application of conservation practices can be used to resolve the resource concern.
We expect that increased clarity in the conservation planning process will lead to a greater understanding of the air quality and atmospheric change resource concerns and how agricultural producers can reduce air emissions and impacts. Simple and clear direction should eventually lead to greater acceptance of addressing air quality and atmospheric change resource concerns.
Future Plans
USDA-NRCS will continue to refine our approach to addressing air quality and atmospheric change resource concerns. As we gain a greater scientific understanding of the processes by which air emissions are generated and air pollutants are transported from agricultural operations, we can better target our efforts to address these emissions and their resultant impacts. Internally, we will be working throughout our agency to identify those areas where we can collaboratively work with agricultural producers to improve air quality.
Authors
Greg Zwicke, Air Quality Engineer, USDA-NRCS National Air Quality and Atmospheric Change Team
greg.zwicke@usda.gov
Additional Authors
Allison Costa, Air Quality Engineer, USDA-NRCS National Air Quality and Atmospheric Change Team
Additional Information
General information about the USDA-NRCS can be found at https://www.nrcs.usda.gov. An overview of the conservation planning process is available at https://www.nrcs.usda.gov/wps/portal/nrcs/detail/national/programs/technical/cta/?cid=nrcseprd1690815.
The USDA-NRCS website for air quality and atmospheric change is https://www.nrcs.usda.gov/wps/portal/nrcs/main/national/air/.
The authors are solely responsible for the content of these proceedings. The technical information does not necessarily reflect the official position of the sponsoring agencies or institutions represented by planning committee members, and inclusion and distribution herein does not constitute an endorsement of views expressed by the same. Printed materials included herein are not refereed publications. Citations should appear as follows. EXAMPLE: Authors. 2022. Title of presentation. Waste to Worth. Oregon, OH. April 18-22, 2022. URL of this page. Accessed on: today’s date.
Rising chloride contamination in ground and surface waters is a growing concern in Minnesota. Previous studies estimate 87% of the chloride load originated from road salts, fertilizers, and wastewater treatments plants, and 6% from livestock manure. However, these estimates may be outdated as the livestock industry and manure application practices have evolved since these estimates of manure chloride concentrations were calculated in 2004. It also remains unclear how varying soil types affect the movement of chloride leaching following manure application. The aim of this study is to understand the movement of manure-based chloride from liquid and solid manures in Minnesota soils through a series of intact core leaching studies. Specifically, this project examines the magnitude of chloride leaching from swine and turkey manure application and compares it with synthetic potassium chloride fertilizer and a no nutrient control. The soil cores represent fine and medium textured soil.
What Did We Do?
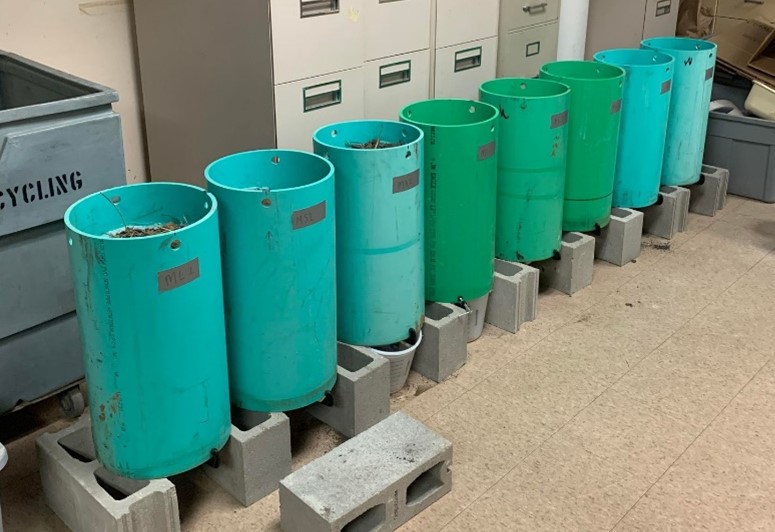
Collected 24 12-inch soil columns from medium and fine-textured soils in Minnesota (Figure 1).
Collected swine and turkey manure from Minnesota farms
Analyzed soil pre- and post-leaching study for nutrient analysis (Cl−, Bray P, NH4+, NO3−, K, Organic Matter, pH, and Exchangeable Ca, Mg, Na, K)
Analyzed manure samples for nutrient analysis pre-application (Total N, P2O5, K2O, Cl−)
Added water to cores until they reached field capacity
Applied manure using N-based application rates, and fertilizer using a K-based rate to 3 replicates
Simulated 2-in rainfall events on days 4, 12, and 18 post nutrient application
Collected and analyzed leachate for Cl−, NH4+-N, and NO3−-N
Figure 1: Setup of 12-inch PVC soil cores for leaching study
What Have We Learned?
How chloride concentration varies based on manure type and species
How the total amount of chloride applied via fertilizer application to cores varies by treatment
How manure-based chloride moves through soil
How fine and medium textured soil influences the movement of manure-based chloride
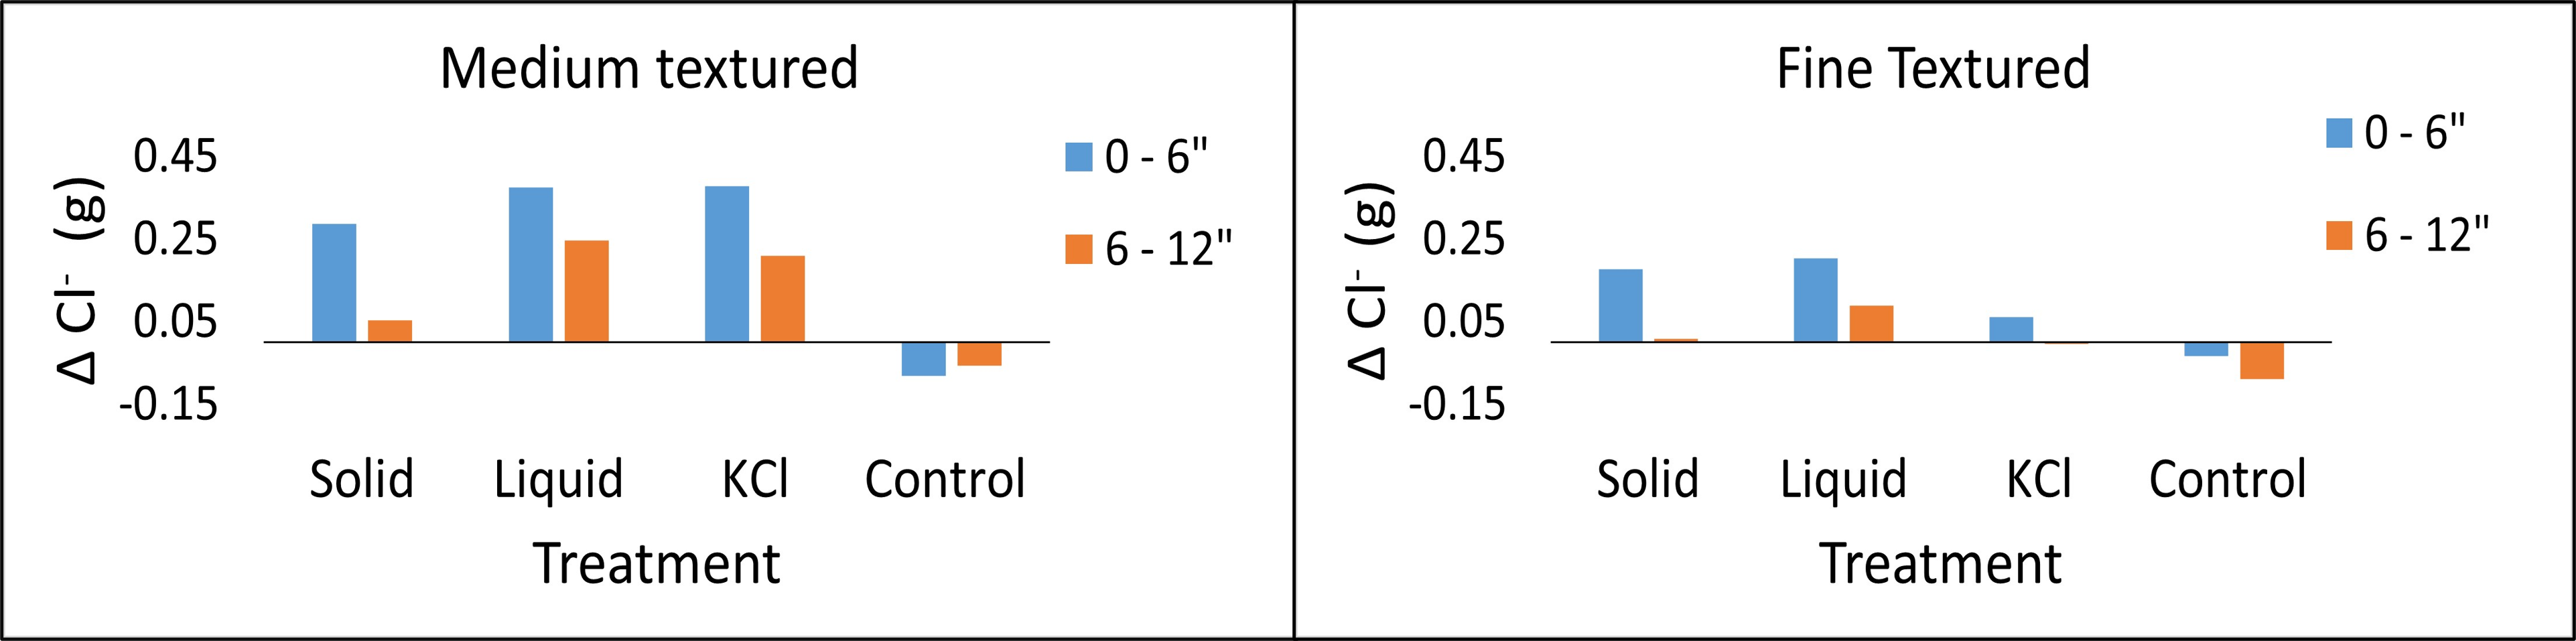
How chloride storage changed by soil type following the experiment (Figure 2)
Medium textured soils had a greater change in chloride storage in both top and bottom layers compared to fine textured soils
Manure additions increased chloride storage in both medium and fine textured soils
Control soil cores experienced a loss in chloride storage following leaching
Figure 2: Change in soil chloride storage in each medium textured (left) and fine textured (right) soils by treatment. Positive values indicate a net gain in soil chloride, while negative values indicate a net loss in soil chloride following leaching.
Table 1: Total Cl− concentration of liquid swine manure (lbs/1000 gallons), solid turkey litter, and synthetic KCl (lbs/ton) followed by total weight (g) of Cl− added per core via application.
Treatment
Cl− (lbs/1000 gallons)
Cl− (lbs/ton)
Cl− added per core (g)
Liquid
26
–
1.49
Solid
–
2.7
0.179
KCl
–
940
0.576
Control
–
0
0
Future Plans
Our group would like to complete a second round of this study the following year on newly identified liquid and solid manure and an additional coarse textured soil type. Future attempts in creating chloride-based mass balances for the state of Minnesota will benefit from this study.
Authors
Matthew Belanger, Graduate Research Assistant, Dept of Soil, Water, and Climate, University of Minnesota
This project is funded through the University of Minnesota Water Resource Center’s Watershed Innovation Grants Program. We’d also like to thank Scott Cortus, Eddie Alto, Todd Schumacher, Dr. Pedro Urriola, and Thor Sellie for their assistance.
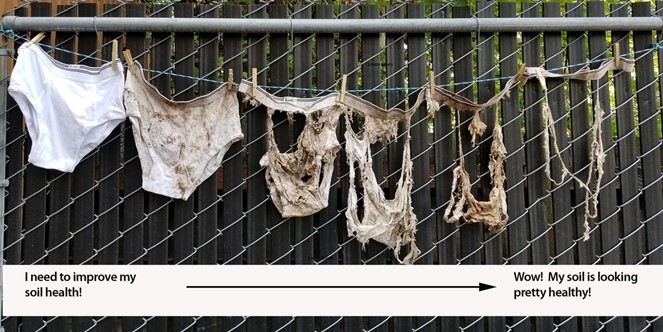
The use of livestock manure as a soil amendment to benefit soil health by improvements to soil physical, chemical, and biological properties, has been documented. However, quantification of the impact of improved soil health metrics on nutrient cycling has lagged. The soil your undies experiment has been implemented in the past to visually demonstrate microbial activity (Figure 1). However, this demonstration is seldom quantified, and does not have the capacity to statistically show that the effects of different management practices are distinct. The goal for this study was to quantify the degradation of fabric on a similar experiment, using cotton fabric on agricultural soils through photographic editing software. This study was designed to assess a visual method for quantifying carbon cycling in soil, observed through the degradation of buried organic materials.
Figure 1. Soil your undies soil health demonstration. Credit Clackamas Soil and Water Conservation District.
What Did We Do?
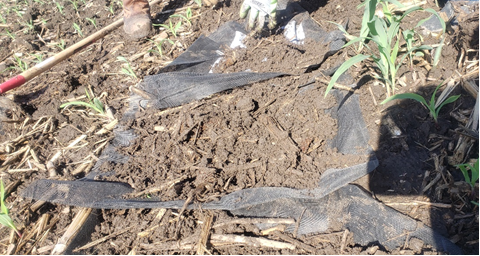
White, 100% cotton fabric cloths were cut into 29.21 × 29.84 cm (871.62 cm2) (11.5 x 11.75 in, 135 in2) pieces and placed flat inside a non-degradable mesh bag (48 cm × 48 cm, 18.9 in x 18.9 in). Sixty of the mesh bags were buried at 5 cm (2 in) depth in a field planted with corn in May of 2021 (Figure 2). The sixty bags were arranged in 12 plots to which one of three soil treatments (swine slurry, swine slurry + woodchips, and control plots with no amendments) with four replications per treatment were also applied. Swine slurry was applied at a rate of 39,687.06 L-ha-1 (4,242 gal-ac-1) and woody biomass was applied at a rate of 21.52 Mg-ha-1 (9.6 tons-ac-1).
Figure 2. Fabric and mesh bag burial in research plots
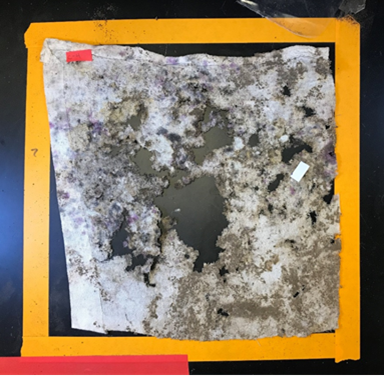
Five times during the growing season (25, 54, 81, 99 and 128 days after establishment), one bag was retrieved from each plot and returned to the lab for analysis. For each bag, soil was gently removed from the surface of the mesh and then the bag was cut open to observe the cotton fabric remaining. All the fabric pieces were photographed after retrieval. Photographs of the fabric were taken with an iPad mounted on a tripod. Fabric samples were photographed in a premeasured area of 29.21 × 29.84 cm (11.5 x 11.75 in) on a black surface (Figure 3).
Figure 3. Fabric sample placement inside pre-measured area (29.21 × 29.84 cm) for photographing
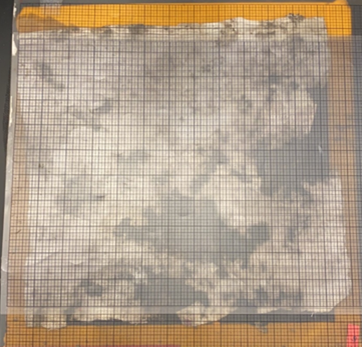
Manual evaluation of percent fabric degradation for each sample was performed by overlaying a clear plastic grid (Figure 4) with primary graduations (darker lines) of 2.54 cm (1 in) and secondary graduations (lighter lines) of 6.4 mm (0.25 in) on fabric samples and counting grid squares that were void of fabric.
Figure 4. Grid overlayed on fabric sample for manual evaluation of percent fabric degradation
Each photograph was assessed using Adobe Photoshop 2020 and the free license program ImageJ. Briefly, each image was opened in the respective program and the initial fabric area (871.62 cm2) (135 in2) was delineated in the program, based on the premeasured area included in the photo to set a scale for the degradation measurement. The image was converted to black and white, and brightness and contrast were adjusted as needed to remove glare on the black background that might be misread by the program as fabric. Then, all the pixels within a specific color range – which was previously defined as fabric – were selected using the native editing tools in the two programs and this area was compared to the pixels in the initial fabric area to determine the percentage of fabric remaining.
What Have We Learned?
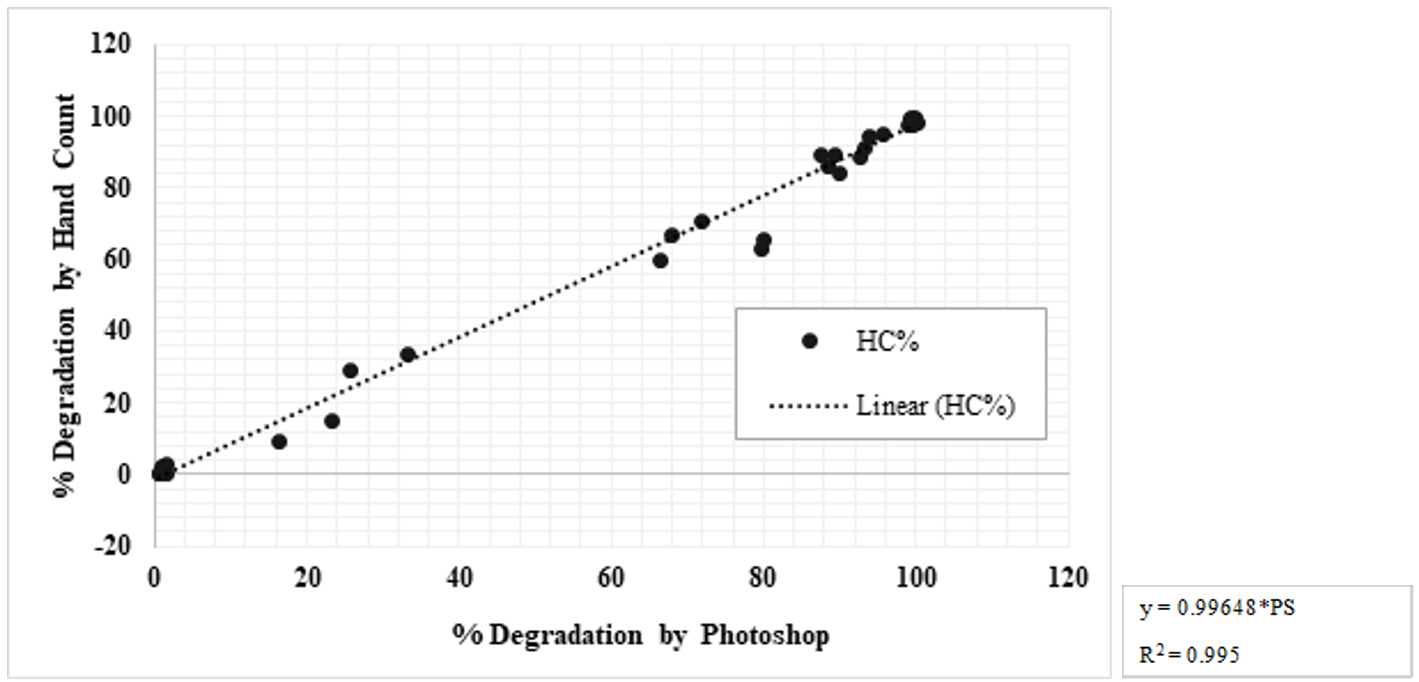
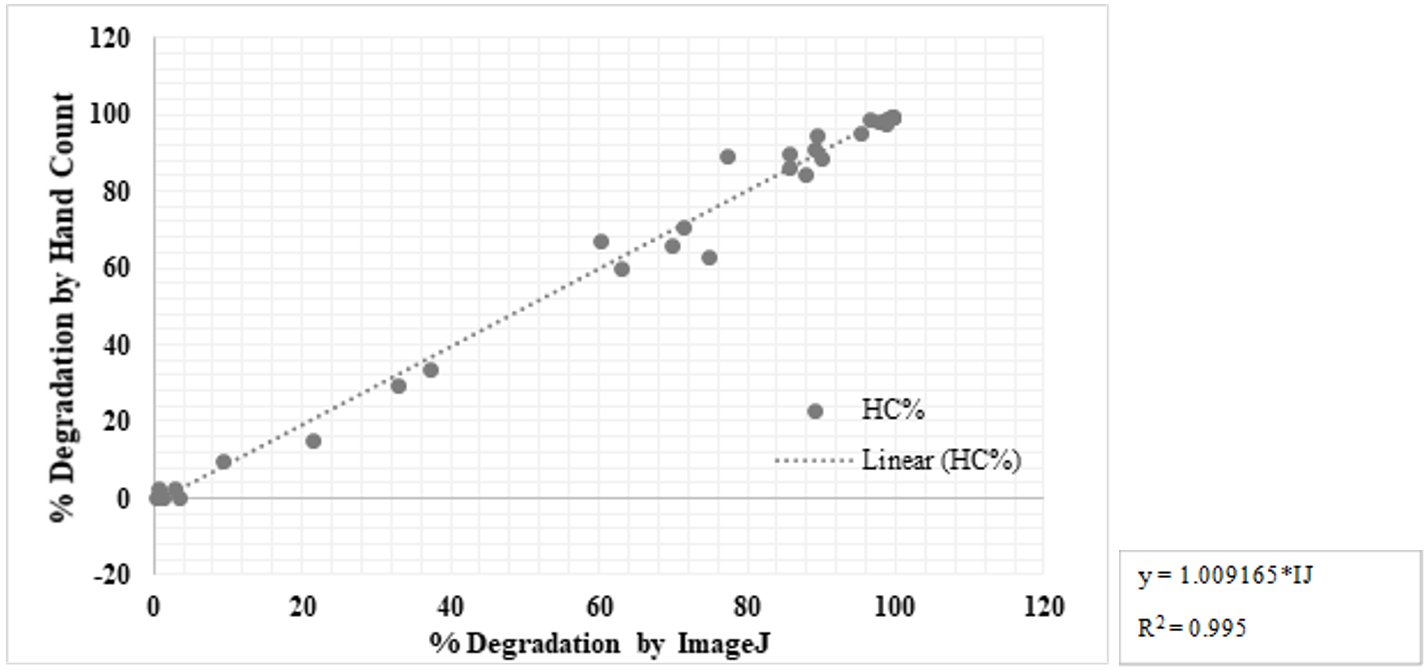
The three methods for estimating the area of the fabric did not show significant differences among each other, which means estimates of fabric degradation obtained with Photoshop and Image J accurately reflect manual hand counts, suggesting that these are reliable visual methods for determining the area of the remaining area of fabric (Figure 5, 6).
Figure 5. Linear regression model for degradation estimation via Photoshop relative to degradation value obtained by hand countFigure 6. Linear regression model for degradation estimation via ImageJ relative to degradation value obtained by hand count
Future Plans
Future work will seek to validate this method according to standard measures of soil health and biological activity and ensure that the method has enough sensitivity to demonstrate statistical differences between soil treatments. Future studies should also focus on making the process of area estimation with the software an easier, less laborious process. Creating a cellphone app to determine degradation quickly and without the need for a computer could increase the adoption of the fabric degradation assessment method in field settings.
Authors
Amy Schmidt, Associate Professor, University of Nebraska-Lincoln
Karla Melgar Velis, Graduate Research Assistant, University of Nebraska-Lincoln
Mara Zelt, Research Technologist, University of Nebraska-Lincoln
Andrew Ortiz Balsero, Undergraduate Research Assistant, University of Nebraska-Lincoln
Acknowledgements
Funding for this study was provided by the Nebraska Environmental Trust and Water for Food Global Institute at the University of Nebraska-Lincoln. Much gratitude is extended to collaborating members of the On-Farm Research Network, Nebraska Natural Resource Districts, Nebraska Extension Agents and Michael Hodges and family for providing the land, manure, and effort for this research project. Much appreciation to members of the Schmidt Lab who supported field and laboratory work: Juan Carlos Ramos Tanchez, Nancy Sibo, Andrew Lutt, Seth Caines and Jacob Stover.
Manure lagoon systems are designed to hold and treat animal farm wastewater for a predetermined period and remain popular in many livestock farms. If the lagoon is properly designed and built, many years can go by without any significant maintenance requirements outside of water management, pumps and valves. Depending on the capacity and maintenance, additional manure solid removal is often required to reduce the amount of manure solids entering the lagoon storage. When excessive solids build-up or sludge was found, significant odor and low quality/quantity of flushing water would be the issues.
This study documents experience to prepare for and complete land application of lagoon effluent with heavy solids from a flush dairy lagoon in central Missouri. The free stall barn uses mattress bedding with supplemental cedar shavings and houses 140-160 lactating cows. Preparation included measuring lagoon sludge depth and lab analysis of sludge characteristics and scouting for crop fields for land application prior to contacting contractors for a bidding process. A contractor team utilized specialized equipment to dilute, agitate, pump and land apply approximately 8 million gallons of diluted lagoon solids in less than nine working days. Lagoon effluent was sampled throughout the process to monitor the mass of nutrients applied to specific plots of land. For effective lagoon solids removal and land application, proper preparation, specialty equipment and trained professional, timing of the crop fields, and adequate field working days are critical. Simple, non-mechanical technologies are available for even small to midsize dairy farms to reduce the cost of lagoon maintenance by preventing the bulk of solids from entering the lagoon.
What Did We Do?
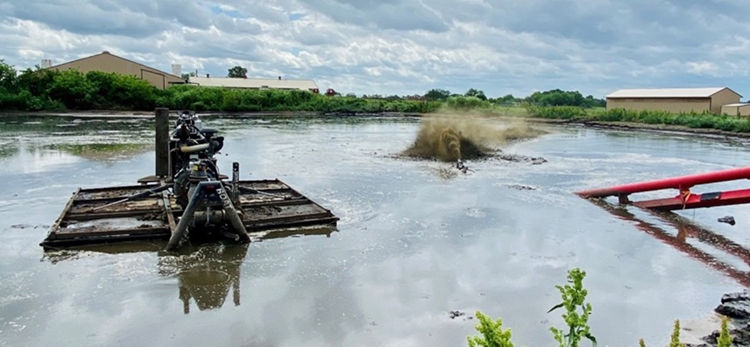
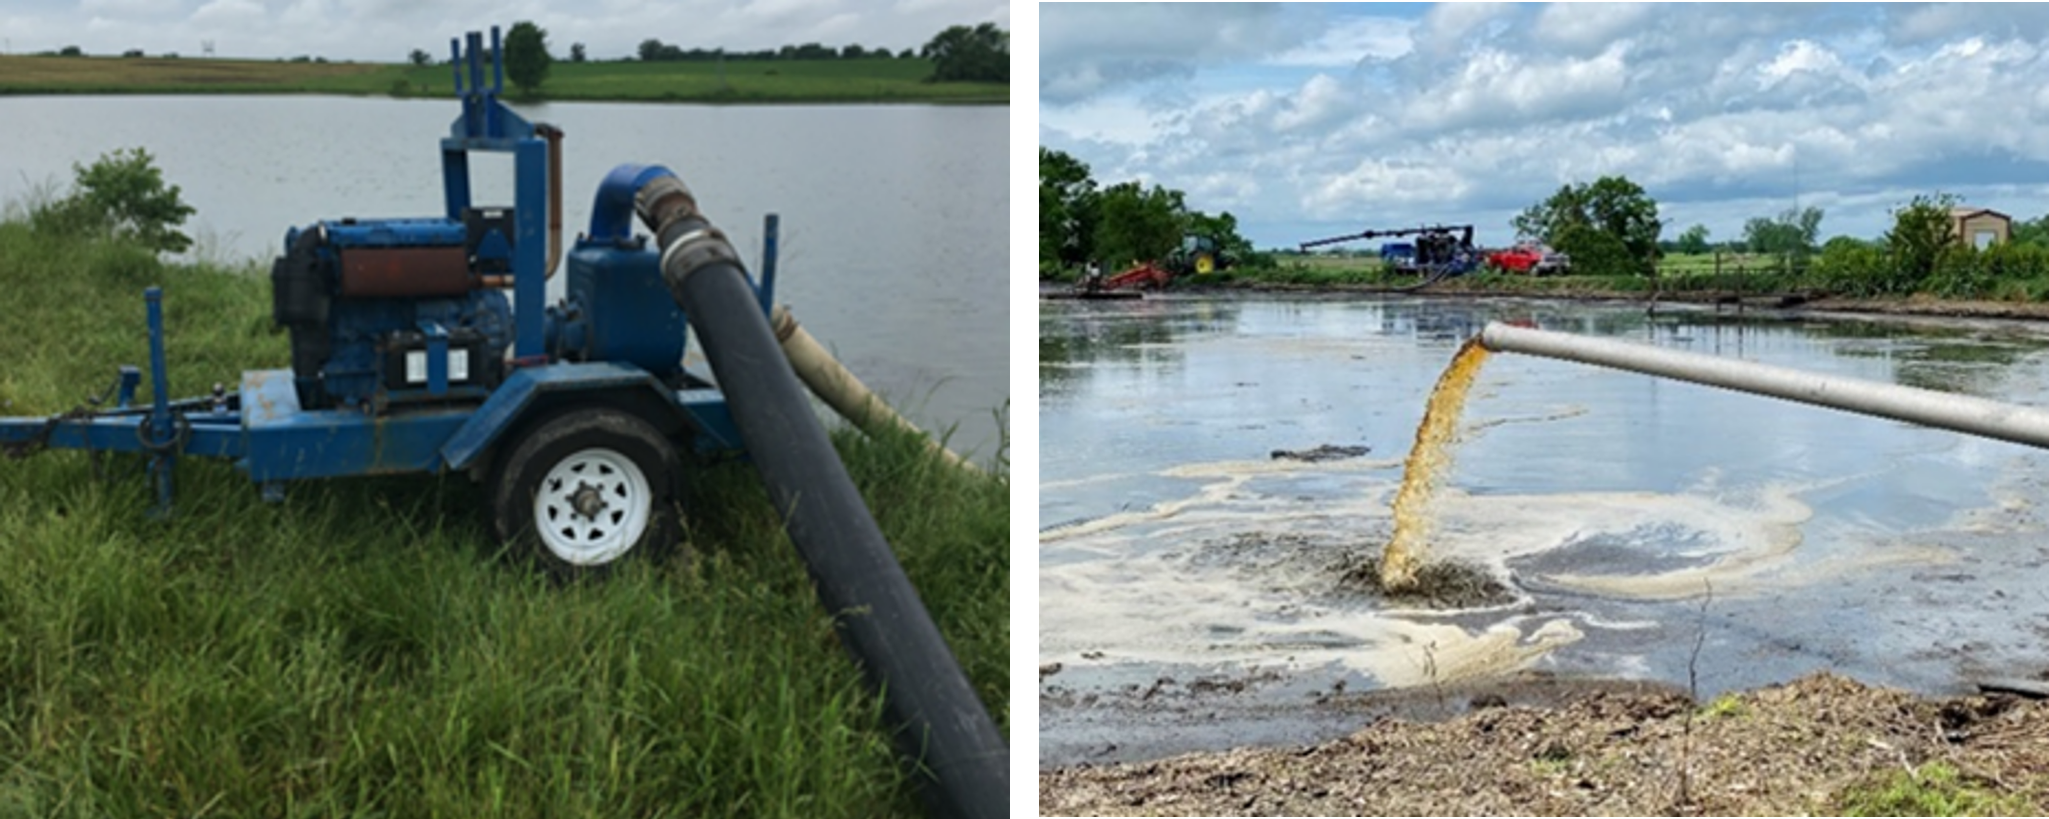
We documented the process of lagoon solids removal for land application, considering the preparation (sludge and effluent sampling), specialty equipment and trained professionals, timing of the crop fields, and adequate field working days. The barn was flushed two to three times per day, with three times per day being typical. There was, at one time, an elevated screen that helped remove the large solids from the flush, but the screen system fell into disrepair several years ago and was abandoned. Solids in the lagoon were agitated and pumped out from May 21, 2020, through June 8, 2020, Figures 1 and 2. A total of 8 million gallons over 280 acres was applied to fields further away from the lagoon, including neighbor’s crop fields that were 1.5 miles away. Equipment needs and specifications were documented (Canter et al., 2021) and being prepared for an Extension publication.
Figure 1. PTO-drive lagoon agitators and agitation boat in operation.Figure 2. A dilution pump was used to pump water from the nearby lake (left) to the dairy lagoon (right) with agitation boat and lagoon agitation working in the background.
Daily lagoon effluent samples were taken multiple samples throughout the day on June 2 to gauge the consistency of nutrient concentrations. Results suggest that once completely mixed via agitation, the applied nutrient concentration from a single sample is a reliable estimate within a working day if the moisture content is consistent. The initial slurry had a 10-13 percent solids content, so a significant amount of dilution water was needed to dilute the solids content to the target range. The exact amount of dilution water used was unknown. Figure 3 shows the concentration and moisture data. In general, the higher the moisture content (less solids) in the slurry samples, the higher the concentrations of the important manure nutrients are. The team evaluated potential technologies based on historical experience and first-person interviews. A pull-plug sediment basin (PPSB) was selected after reviewing cost and visiting with a farmer who operated a PPSB and was satisfied with the overall operation and performance (Canter et al., 2021). The application rate of important manure nutrients did show variation during the several days of land application, suggesting an improvement to the real-time effluent nutrient measurement and land application rate adjustment could be improved to provide more consistent nutrients to the crop fields.
Figure 3. Concentrations and moisture content of slurry samples from the lagoon.
What Have We Learned?
Manure management can be a burden for animal feeding operations, which can potentially become a significant threat to the profitability and management of farms if not proactively managed. Owners would be well-advised to survey their lagoon yearly to track solid inventory and plan ahead for the amount of land needed for solids application. Proper solids removal from the lagoon, particularly if regular and effective solids removal has been neglected, requires specialized equipment to reduce liquid supernatant on an annual or semiannual basis. There can be significant variability of nutrient concentration and resulting mass applied. Testing for nutrient concentrations in the lagoon, whether supernatant or sludge, or both, can be misleading due to variance in concentrations due to moisture content as the applicators dilute and concentrate the solids during the land application process.
Daily sampling during land application could help but may not be practical due to the analysis time generally required by labs (5-10 business days). Sensors and probes are available that return instantaneous values and have been used in municipal and industrial wastewater treatment for over a decade. Companies have offered integrated sensors for land application equipment, combining them with their GPS and flow control system to give a complete and accurate summary of nutrient application. Simple, non-mechanical technologies are available for even small to midsize dairy farms to reduce the cost of lagoon maintenance by preventing the bulk of non-degradable solids from entering the lagoon. Implementation of a coarse solids separation system such as the PPSB could significantly reduce the long-term cost of manure management by allowing the operator to use more common equipment (e.g., a loader and spreader) to remove solids from the manure management system.
Future Plans
Continuous monitoring of the lagoon sludge level at a minimum of annual basis is needed to closely monitor the lagoon solid accumulation and performance of the PPSB. The authors are collaborating with NRCS team to improve the PPSB and ways to monitor the lagoon sludge level.
Authors
Teng Lim, Extension Professor, Agricultural Systems Technology, University of Missouri
Corresponding author email address
Limt@missouri.edu
Additional authors
Timothy Canter, Extension Specialist, Agricultural Systems Technology, University of Missouri
Joseph Zulovich, Extension Assistant Professor, Agricultural Systems Technology, University of Missouri
Additional Information
Canter, T., Lim, T.-T., and J. A. Zulovich. 2021. Field Experience of Removing and Land Application of Dairy Lagoon Solids. In International Symposium on Animal Environment and Welfare. Rongchang, Chongqing, China.
Lim, T.-T. 2022. Lagoon Solids Removal, Lessons Learned. Cleanout for Lagoons and Anaerobic Digesters, Jan 21, 2022. Webinar of Livestock and Poultry Environmental Learning Community (LPELC). https://lpelc.org/cleanout-for-lagoons-and-anaerobic-digesters/
Canter, T., Lim, T.-T., Chockley, T. 2021. Considerations of Pull-Plug Sedimentation Basin for Dairy Manure Management. University of Missouri Extension Publication. Retrieved September 25, 2021. https://extension.missouri.edu/publications/eq302.
Acknowledgements
USDA NIFA, Water for Food Production Systems Program A9101, for supporting the project. It is titled “Management of Nutrients for Reuse”, a multi-faceted project that involves professionals from the University of Arkansas, University of Nebraska, Colorado School of Mines and Metallurgy, Case Western University, and University of Missouri.
Joe Harrison, Professor, Livestock Nutrient Management program, Washington State University
Gilbert Miito, Postdoctoral Fellow, Agricultural Systems Technology, University of Missouri
Richard Stowell, Biological Systems Engineering, University of Nebraska
Farm crew and custom applicator team for their help.
Antimicrobial resistant (AMR) infections are a significant threat to public health. That is why a nationwide coordinated effort among university outreach programs to convey science-based knowledge on AMR dynamics to stakeholders, was established using the moniker the iAMResponsible (iAMR) project in 2019. The project title, “iAMResponsible”, is intended to convey that everyone has an obligation to understand AMR and learn how they can adapt to using science-based practices to mitigate AMR and preserve the efficacy of antibiotics for future generations. The iAMR project seeks to cooperate with related efforts to leverage resources and amplify dissemination of AMR-related educational information. The objectives of the iAMR project are to: (i) increase nationwide capacity to develop AMR related educational content, (ii) facilitate the dissemination of research-based materials through a national network of project members and collaborators, (iii) effectively engage audiences of disparate backgrounds on a shared responsibility for AR, and (iv) empower behavioral change among different audience groups that preserves the efficacy of antibiotics. While the activities of the iAMR team are varied, this study assesses the network building and communication efforts of the iAMR Project on social media.
What Did We Do?
The use of social media to build communication capacity for AMR outreach was measured by the following metrics: total followers and frequency of keywords in search of follower profiles using tools from Followerwonk.com.
For this study the efficacy of social media dissemination was measured in the total impressions (number of users who saw a post) earned by outputs, and the geographical spread of follower locations. Both impressions and follower location are measured by native analytics tools available on various social media.
This study uses the engagement rate, provided by social media analytics to measure audience interest in published materials (engagement rate is the percentage of audience who saw the post and interacted with the post in some way–interactions include retweets, likes, link clicks, follows, media opens, etc.). Native (available from the social media platform) analytics data also allowed us to assess the relationship of engagement rate to specific message factors. To measure audience interest in specific topics, engagement rate was determined for tweets containing keywords and symbols.
To assess the use of social media for motivating behavioral change in the audience, the team developed a 20-question survey with questions on attitudes towards antibiotics, AMR, and the iAMR project. Beginning in the spring of 2020, the team has promoted the same survey annually on different social media platforms to determine attitude changes over time.
What Have We Learned?
Total following for iAMR social media accounts is now just over 4000 (4096 as of Feb 7, 2022). Looking at the most frequently appearing keywords appearing in follower profiles provides some insight into who the followers are (Figure 1). Preeminent among these keywords are “public health,” “antimicrobial resistance,” “infectious diseases,” and “PhD student.” Given this collection of terms we can infer that the iAMR audience likely has a strong interest in and awareness of public health threats like AMR. This would indicate that while iAMR has been effective at building a network among interested, engaged and knowledgeable people in scientific fields, but less adept in reaching audiences with little awareness of AMR or those working in agriculture or food safety fields.
Figure 1: Word cloud of terms included in the biographies of iAMResponsible’s social media followers. Created by Followerwonk.com
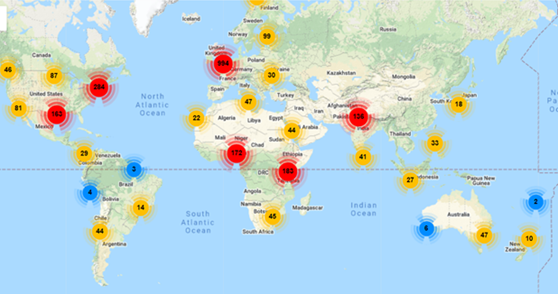
iAMR posts have earned roughly 1,000,000 total impressions (948,266 as of Feb 7, 2022) on 720 total posts, or roughly 1300 impressions per post. Impressions measure only the times a user has seen a post they are not a measure of audience engagement. Therefore, while impressions function as a measure of dissemination they are not a reliable measure of the communication impact. In the examination of the geographical reach of iAMR followers (Figure 2) it is evident that iAMR has a larger international than domestic audience, with a particularly large node in Great Britain.
Figure 2: iAMR’s global social network. Node colors indicate size of the nearby audience, blue (1-9), yellow (10-99), red (100-999). Total >4000 worldwide
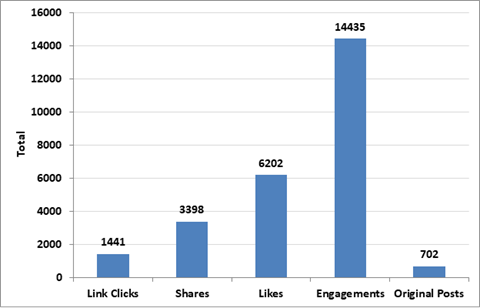
Overall engagement by audience members with posts from iAMR activity are illustrated in (Figure 3). For the 702 (as of Feb 7, 2022) posts iAMR generated roughly 21 engagements per post, of those engagements roughly 2 were link clicks, about 5 were shares, and 9 were likes. In the context of the per tweet average for impressions (1350) these numbers seem very low but in fact the overall engagement rate of 1.53% is above average (in 2020 average engagement was 0.07% on Twitter, 0.27% on Facebook, 1.16% on Instagram).
Figure 3: Overall engagement by audience members with posts from iAMR, as of Feb 7,2022
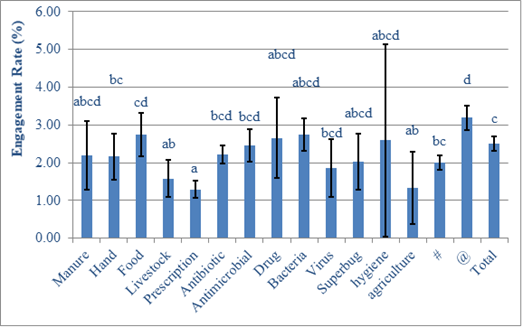
To examine what topics were of particular interest to the audience the engagement rate data was broken down by keywords contained in the body of iAMR’s posts, the mean engagement and 95% confidence interval for posts containing the keywords are illustrated in Figure 4. In this examination of user engagement based on post characteristics, the highest engagement was associated with posts containing an “@” symbol. Whereas users were less likely to engage with posts containing the words livestock, agriculture or prescription when compared to the overall engagement with iAMR’s posts.
Figure 4: Average engagement rates for iAMR’s social media content containing keywords or symbols; error bars indicate a 95% confidence interval for mean engagement rate.
Audience engagement with AMR attitude and behavior survey has been low and because most participants respond to only some of the survey questions of the 335 total responses which have been logged during the past 3 years, many key questions have response numbers as low as 9. As a result, we do not have enough data to statistically assess our survey results and present the following as results as instructional rather than conclusive (Table 1).
Table 1: Proportion of Social Media Audience Responding Affirmatively to Selected Web Survey Questions
40% (n=40)
Have a medical, doctoral or veterinary degree.
90% (n=51)
Expressed concern about growing AMR
65% (n=63)
Said they regularly tell others about AMR.
100% (n=23)
Said they considered iAMR a reliable source for information on AMR.
Future Plans
Based on audience profiles and content engagement the iAMR account has done a poor job reaching agricultural audiences, or audiences not already engaged with AMR. Accordingly, future work will need to identify outlets, outside of social media, for engaging new-to-AMR audiences. However, there is value in cultivating the current account audience of engaged and expert users who could join the growing network of iAMR contributors and provide some level of expertise on outreach projects going forward. Moreover, survey results indicate that the current audience has developed trust in the iAMResponsible brand and the educational materials that the team has developed, which provides additional opportunities for dissemination of content into audience communication networks that might not be picked up by the analytical approach used in this assessment.
The iAMResponsible project team will continue efforts to identify educational needs, produce and curate research-based content intended to improve public awareness about AMR, and improve access among producers, consumers, and stakeholders to research-based information about potential AMR-related food safety risks
Authors
Mara Zelt, Research Technologist, University of Nebraska
Juan Carlos Ramos Tanchez, Graduate Research Assistant, University of Nebraska; Amber Patterson, Extension Assistant, University of Nebraska; Amy Schmidt, Associate Professor, University of Nebraska
Funding for the iAMR Project was provided by USDA-NIFA Award Nos. 2017-68003-26497, 2018-68003-27467 and 2018-68003-27545. Any opinions, findings, conclusions, or recommendations expressed in this publication are those of the author(s) and do not necessarily reflect the view of the U.S. Department of Agriculture.
The goal of this study was to identify areas that were prone to nutrient transport from land application of manure-based on environmental conditions including length of streams and flood hazard potential in those areas. Additionally, the study aimed at developing an economic utility for producers in transporting manure in the Maumee Watershed in North-west Ohio targeted at reducing the potential environmental impacts that may arise from over application.
What Did We Do?
The initial basic feasible solution of the Hitchcock transportation model (Derigs, U. 1988. The Hitchcock Transportation Problem. In: Programming in Networks and Graphs. Lecture Notes in Economics and Mathematical Systems, vol 300. Springer, Berlin, Heidelberg.) was used to simulate the distribution of manure from 31 dairy and swine concentrated animal feeding facilities to agricultural census block groups (soybeans and corn) in the Maumee Watershed within NW Ohio. The model considered the supply and demand capacity of nearby livestock operations (origin) and agricultural census block groups (destinations) respectively. The second objective was to identify areas that were prone to nutrient transport as determined from the model results based on environmental conditions related to floodplain and length of streams dataset using the Getis-Ord GI* statistic. Finally, using the objective function of the transportation problem, the transportation costs associated with hauling manure from the source to the destinations were calculated.
What Have We Learned?
The distribution of manure showed an unbalanced transportation problem such that available farmland that could receive manure exceeded the supply of the livestock operations. The findings suggest there is adequate agricultural land for manure distribution in the watershed. Additionally, areas indicating clustering in the distribution of manure were further examined to determine the potential for nutrient transport off the land and into nearby water bodies based on the environmental conditions used. Approximately 98% of receiving agricultural census block groups fell in the EC-1 classification, which indicates a very low potential for environmental conditions to influence nutrient movement off farmland receiving manure from the 31 CAFFs studied. Approximately 2% and 1% of total acres receiving manure had a moderate to high potential for flooding respectively and were found in Upper Maumee and St. Joseph sub-basins. The identified sub-basins are recommended target areas for best management practices in reducing nutrient runoff. In using the Getis-Ord GI* statistic in ArcMap, Auglaize, Upper Maumee, Lower Maumee, and Cedar-Portage sub-basins were identified as critical areas of concern with high total acres showing high clustering of stream length.
Future Plans
The transportation problem is a type of linear programming problem where goods and services are transported from one set of sources to one set of destination points to minimize transportation costs. There are two phases to the transportation problem – finding the initial basic feasible solution while the second phase involves optimizing the initial basic feasible solution. This study focused on finding the initial basic feasible solution for manure distribution and application in the Maumee River Watershed. Future research could include optimization of the initial basic feasible solution per the transportation problem process to test the robustness of the results from the first phase.
Secondly, the transportation model coded for this dissertation was based on the manure supply of permitted livestock facilities engaged in only swine and dairy production. The model could be refined to include the supply of all livestock operations in the watershed in addition to all destination agricultural lands. With transportation costs being a major overhead cost for producers, the model can also be calibrated based on minimal travel time as an economic utility for producers and farmers.
Furthermore, given the costs involved in the construction of manure storage facilities and the regulations surrounding manure application as identified in Ohio State Bill 1, locations for ‘manure- sheds’ can be identified for manure storage during off seasons for application. A GIS optimal model can be developed to determine the minimum cost and distance efficient for the location of the proposed ‘manure-sheds’ where both small and medium facilities with limited storage facilities can transport their manure to a centralized location for storage, while also serving as the point of distribution and utilization for farmers.
Manure from beef feedlot productions can be managed through a diversity of strategies. When choosing from the possible scenarios the main factors influencing the decision are financial, logistical or from a regulatory fulfillment focus, however it is necessary to consider the environmental impact generated from the manure management system in order to generate less burdens on behalf of meat production. One of the most reliable methodologies for this matter is Life Cycle Assessment (LCA), which considers every input and output throughout the process and will calculate environmental emissions quantitatively. In this study we compared various LCA studies of beef lot manure management processes, with the aim of understanding the different systems´ hotspots and global emissions so that these can be considered when establishing a manure management system in similar facilities.
What Did We Do?
We gathered LCA studies published from peer-reviewed scientific journals that assessed the environmental impact of beef manure management. The search terms taken into account were “LCA and beef manure” and “LCA and feedlot manure”. To enable comparison between studies the following criterion were considered for inclusion: a) manure collected from intensive feedlot facilities b) results reporting at least global warming potential.
In order to categorize emissions generated from the entire manure life cycle we established four stages of manure management: Feedlot, transport, storage/transformation and use/disposal. Next, we identified which of these stages were taken into account in each study and if emissions were reported for stages individually as well as globally. Lastly, a comparison between LCAs was conducted for which we converted the functional units reported in the references to 1 ton of manure (dry basis). With this we can visualize the emissions generated from every ton of dry manure that enters the system despite the functionality to which it´s destined.
What Have We Learned?
The final review included 14 references which resulted in 19 scenarios evaluated, ranging from 2007 to 2021. Initially we noted that the system with the greatest number of evaluations performed was the transformation of manure into an energetic resource (E), with 12 of the 19 scenarios being focused on energy generation through manure treatment processes, emphasizing that the current trends are not only leaning towards a better manure use but also cleaner energy sources. On the counter part, composting (C) and stockpiling (SP) are the two least evaluated scenarios through LCA (just once in the articles present in this review). Manure composting and stockpiling aren´t perceived as innovative solutions when aiming to mitigate emissions, but shouldn´t be left aside when performing evaluations, since they´re the most applied techniques for feedlot manure management.
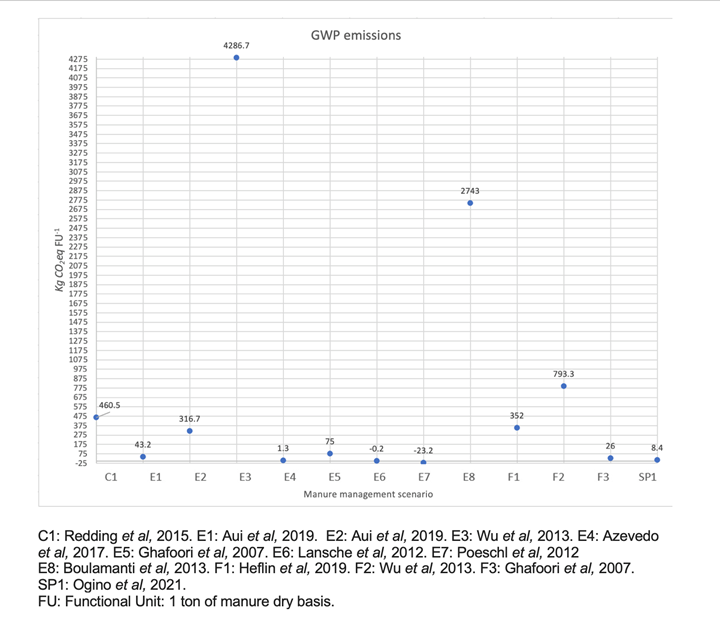
The energetic evaluations represented both, the most (E3) and the least emissions (E7) through the whole process. This is because bioenergetic sources, such as the one generated from manure transformation, frequently are given environmental credits and therefore negative emission values considering the substitution of other energetic resources. In this review 10 of the 12 energetic scenarios considered emission reduction by substitution, but not because the actual process generated less amount of greenhouse gases in itself. Energy production from manure is, in many cases assessed as a life cycle for transformation and excluding other stages of the entire management system. In fact, apart from the kind of treatment only 21.4% of all the LCAs considered in this study included all four stages. Since two of them (Lansche et al, 2012; Van Stappen et al, 2016) mentioned that the best mitigation emission option was to reduce storage time, and one (Giwa et al, 2017) reported the largest emissions coming from transportation we can assume that both, storage and transport are important stages when looking at sources of emissions and should not be left aside.
The difference between emissions between different manure management systems can be as extreme as 4,000X depending on system boundaries, allocation procedures, emission factors, environmental credits, amongst others. When evaluating a manure management system, it is necessary to consider every stage and so that emission reduction can be addressed in the whole process hotspots and not only during the transformation of organic matter.
Future Plans
To conduct an attributional LCA of beef feedlot manure management system as a case study. With this we will contribute more data to contrast composting or stockpiling scenarios and address the weight of the different manure management in a feedlot facility. Also, we will report eutrophication potential and water depletion, as their importance in the environmental impacts of manure management is well known and should be considered when decisions are being made.
Authors
Andrea Wingartz, National Autonomous University of Mexico
Corresponding author email address
anwiot@gmail.com
Additional author
PhD. Rafael Olea Pérez, National Autonomous University of Mexico
Livestock and poultry manure are valuable sources of organic material and nutrients for crop production and pasture growth. Nonetheless, the trend away from diversified farms has disrupted the natural nutrient recycling of manure-fertilized cropping-systems. Meanwhile, inorganic fertilizer sales in Nebraska during 2020 reached a thirty-year high. This importation of nutrients, especially nitrogen and phosphorus fertilizer to areas rich in organic fertilizer products leaves an excess of nutrients that still must be utilized and leads to higher risk for nutrient contamination of surface and groundwater sources that would reduce quality of the water.
In areas where there is a high density of livestock production, utilization of manure nutrients may require additional cropland outside the livestock operations. Moreover, the transportation and application of manure has logistical challenges that remain critical to address to motivate the local recycling of organic nutrient amendments by crop producers and livestock owners.
The present research aims to bridge this gap of knowledge by developing a clearer understanding of nutrient utilization and supply capacities through exploration of county level geospatial data.
This analysis will have two main objectives:
Quantify livestock inventories, associated manure production, inorganic fertilizer imports, and potential crop nutrient utilization, and calculate nutrient surpluses or deficits in five Nebraska counties.
Identify and describe the suitable land for manure applications in each of the five target counties.
What Did We Do?
The research team selected five Nebraska counties (Scottsbluff, Cuming, Custer, Nemaha, and Antelope) for their agricultural importance and diverse geographical location and characteristics. The analysis of nutrients was realized using publicly available geospatial data and governmental databases.
Objective 1. Quantify livestock inventories, associated manure production, inorganic fertilizer imports, and potential crop nutrient utilization, and calculate nutrient surpluses or deficits in five Nebraska counties.
For this research, “livestock” includes poultry, pigs, and cattle (beef and dairy). The team used data from the USDA National Agricultural Statistics Service (NASS) (Table 1) to estimate the total animal units within each category based on NASS data for sales and end-year inventory.
The scope of this assessment was limited to include only commercial production livestock operations, which were operations with at least three animal units or with more than $2,000 in sales of livestock products. To obtain an annual average number of animal units at county-level two important assumptions, based on Kellog, Lander, Moffit, & Gollehon (2000) research: (1) different cycles of confinement for each animal category (according to its spans form birth to market) ; and (2) that sales throughout the year did not have seasonal variation. Algorithms for estimating animal units, average amount of recoverable manure, and its consequent rate for nitrogen and phosphorus levels were calculated using as reference the formulas and conversion factors adapted from Kellog, Lander, Moffit, & Gollehon (2000) and Gollehon, Kellog, & Moffitt (2016).
Table 1. Input data and formulas
Data/formula
Date
Source
Hogs and pigs inventory and sales.
2017
USDA- NASS
Cattle and Calves inventory and sales.
2017
USDA-NASS
Poultry inventory and sales.
2017
USDA-NASS
Estimated nutrients from commercial fertilizers.
2016
NUGIS- The Fertilizer Institute
Crop production Layer
2020
USDA-NRCS-NASS
Balance of nutrient
[Eq. 1]
Balance = Farm fertilizer nutrient used + Recoverable manure nutrient use – Nutrient in harvested crops
The balance of nutrients was thus determined using Eq 1 (Table 1); where farm fertilizer is estimated by fertilizer imports at county level (NuGis database, 2016). The nutrient in harvested crops is estimated with the yield report (USDA-NRCS-NASS), and average phosphorus and nitrogen uptake and fixation rate based on literature review [1].
Objective 2. Identify and describe the suitable land for manure application for each of the five target counties.
Six suitability factors were identified for manure application: land cover, potential for phosphorus uptake, proximity to road and streets, proximity to urban areas, slope, and proximity to water bodies (Table 2). Each factor class was weighted for their impact on manure application feasibility using the Analytic Hierarchy Process (AHP) and pairwise comparison method described by Doegan, Dodd, & McMaster (1994) where factors were given scores on nine objectives (A- Reducing surface water pollution, B-Reducing ground water pollution, C- Reducing soil contamination, D- Reducing runoff loss of nutrients, E- Reducing leaching loss of nutrients, F- Avoiding excessive use of manure, G-Increasing nutrient use efficiency, H-reducing cost of manure application, I- Reducing bad odor) through an objectives-oriented comparison (OOC) which values were adapted form Basnet, Apan, & Raine (2001) (Table 3).
Table 2. Input factors and constraints.
Input Factors
Data type
Excluded land
Land cover
National Land Cover Database
Other land cover besides cropland
Potential uptake of cropland-P2O5
Cropland Data Layer (CDL)
Grasslands, pastures, developed spaces, natural ecosystems.
Proximity to developed/urban areas
National Land Cover Database
Area less than 100 ft
Proximity to road and streets
TIGER Primary and secondary roads and streets
> 35 ft
Slope
DEM of Nebraska’s County
> 10%
Proximity to water bodies
National Hydrography Dataset
> 35 ft
Table 3. Weight distribution using an AHP process.
Land cover
Criteria Weight
Potential uptake of cropland-P2O5
36
Proximity to developed/urban areas
6
Proximity to road and streets
6
Slope
20
Land cover
26
Proximity to water bodies, rivers and streams
6
*Consistency ratio of weight distribution= 0.00 (This range is a measure if the reliability of the comparison and should be <0.1)
[1] (Warncke, Dahl, & Zandstra, Nutrient Recommendations for Vegetable Crops in Michigan, 2004)(Kang, et al., 2020)(Meena, Kumar, Dhar, Paul, & Kumar, 2015)(Grains Research & Development Corporation, 2018)(Fertilizer Canada, 2001)(Grains Reseach & Development Research, 2018)Manitoba Government. (2009).(Barker, 2019) and ((Barker, 2017)(Warncke, Dahl, & Jacobs, 2009)(Sullivan, Peachey, Heinrich, & Brewer, 2020)(Grains Research & Development Corporation, 2018)(Sullivan, Peachey, Heinrich, & Brewer, 2020)International Plant Nutrition Institute (2013)).
What Have We Learned?
Objective 1.
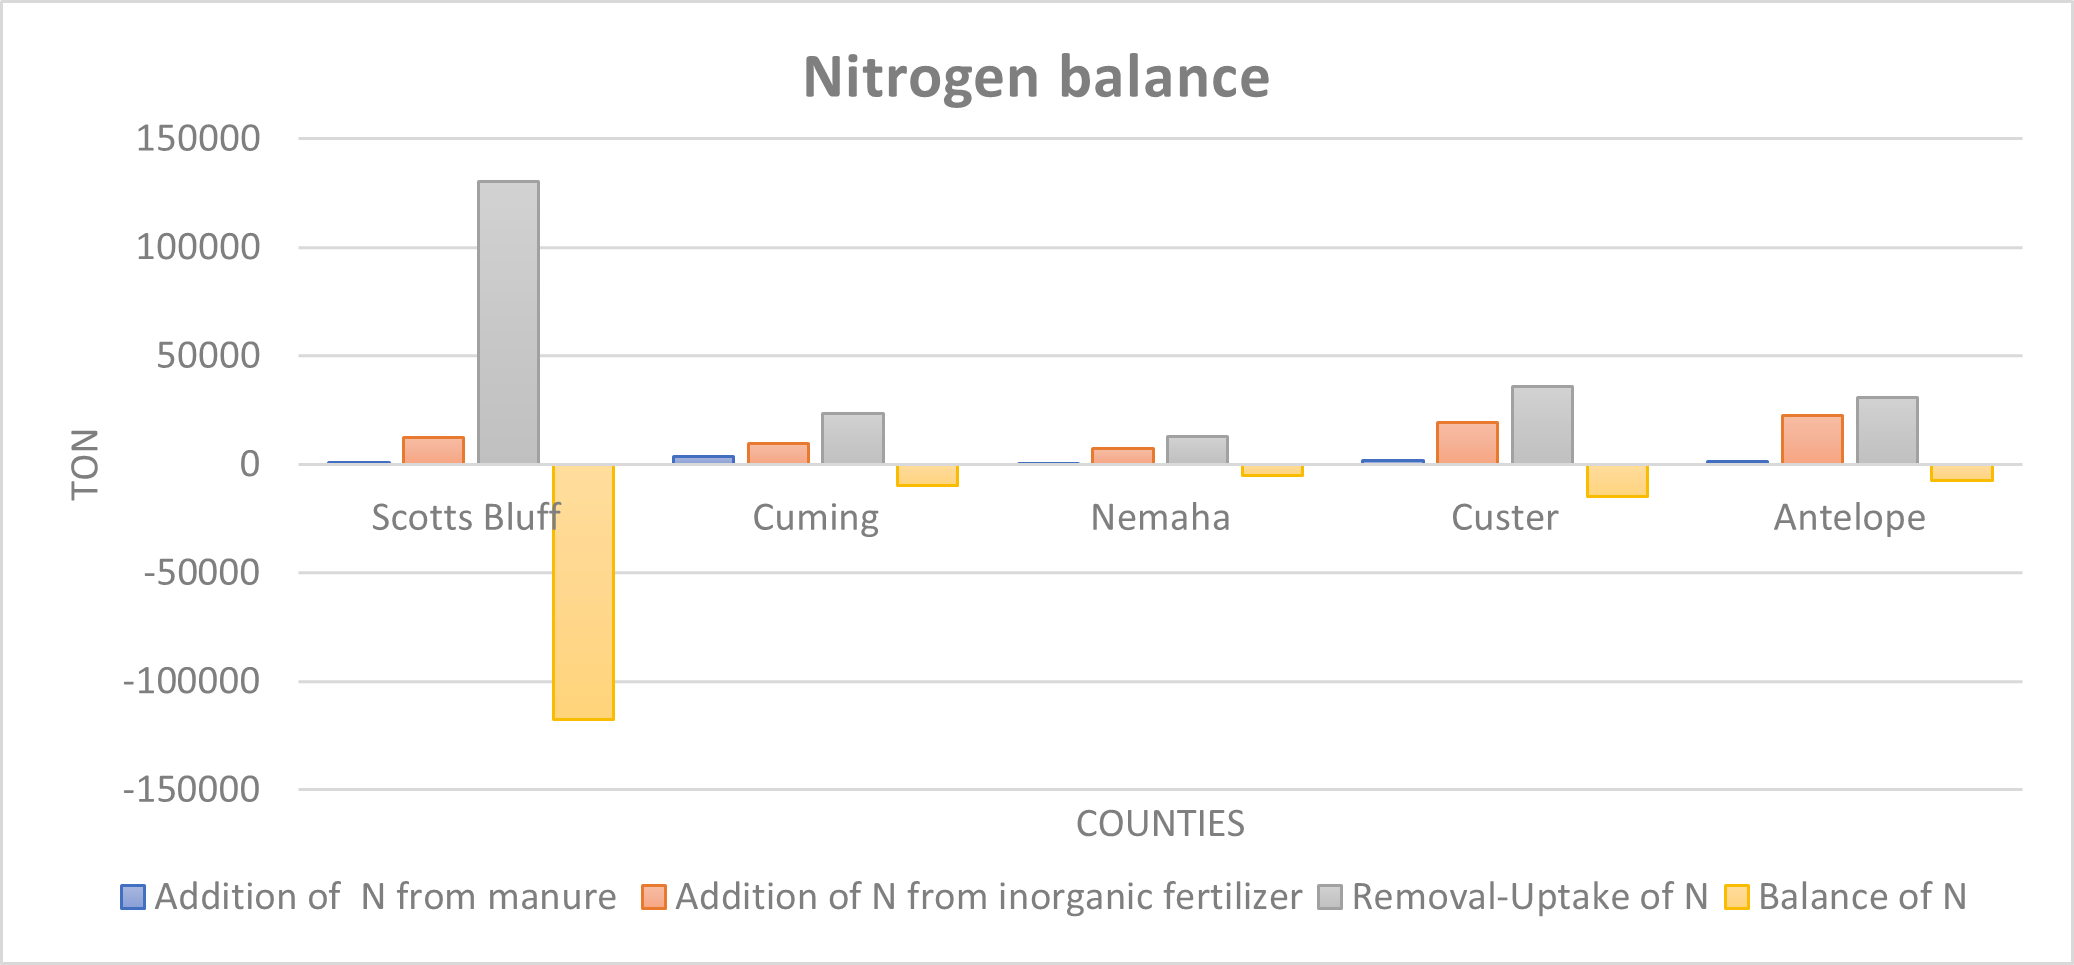
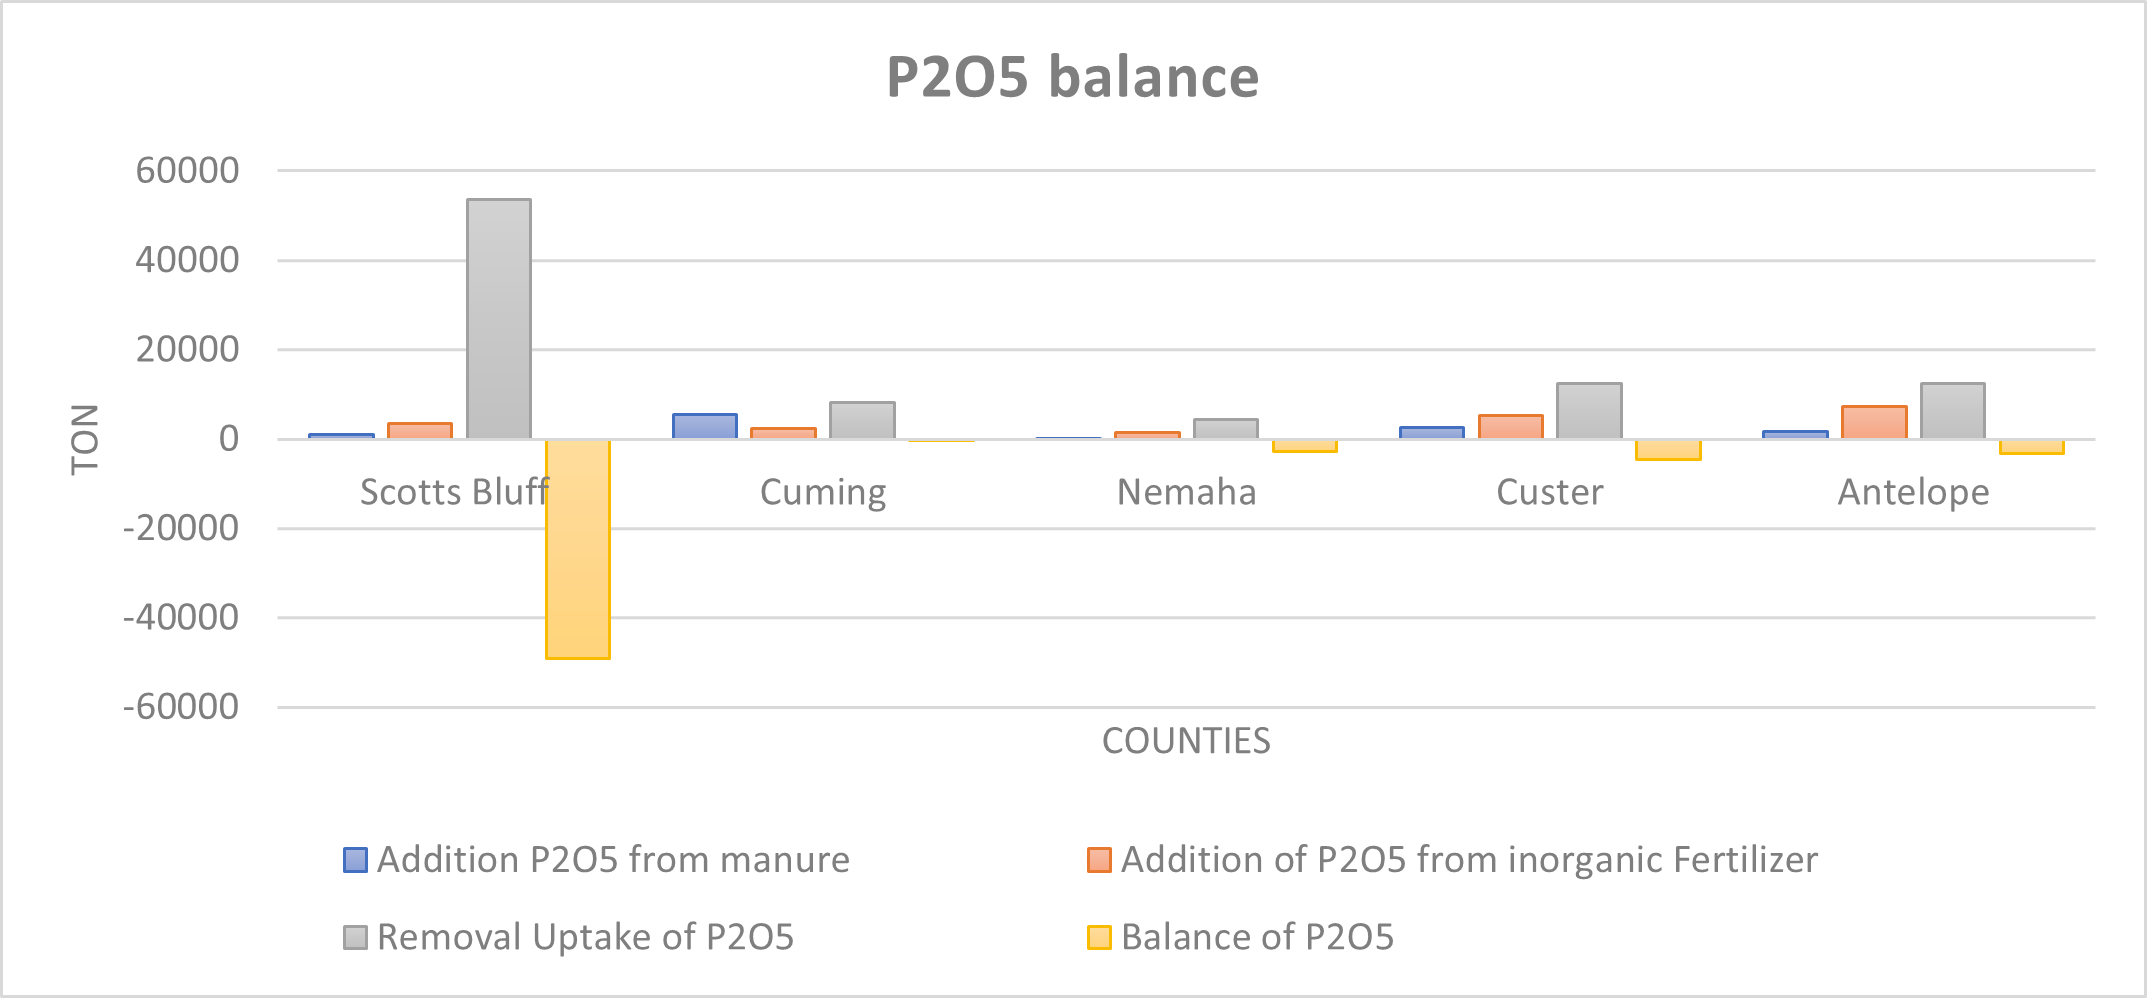
The total balance of nutrients for each county showed that even though none of the counties we assessed have a surplus of nutrients at the county level, some of them are very close to meeting or surpassing the capacity of the land in the county to utilize additional nutrients. Of the five counties, Cumming county has the lowest phosphorus assimilation available at the county level, followed by Nemaha, Antelope, Custer, and Scotts Bluff. Balance nutrients showed a lower assimilation capacity on phosphorus than nitrogen. Since phosphorus is a nutrient limiting the growth of aquatic organisms and reduction on water quality, it was important to represent the potential phosphorus sinks at the geospatial level for Objective 2 (Figures 1 and 2).
Figure 1. County level nitrogen balance.
Figure 2. County level P2O5 balance.
Objective 2.
The area suitable for manure application in the five counties was mapped (Figure 3) with the Weighted Overlay Raster tool, on ArcGis Pro 2.9.1. This allowed the researchers to incorporate multicriteria effects with a weight for each factor. The results are summarized in Table 4 and present the proportion of land in each county that is either not suitable for manure application, has a marginal (medium) suitability, or is very suitable (high). These classifications were determined by natural breaks (Jenks) classification which partitioned data into classes based on natural groups in the data distribution.
We recognize that land suitable for manure application is closely associated with acres in crop production, which for Custer and Scottsbluff Counties is less than 50% of the total acres. Whereas Cuming County had the highest percentage of area dedicated to crop production, which explains the high proportion of “High suitability land”. The category of “Medium suitability” has the lowest percentage for all counties because it is mainly driven by differences in low and medium potential phosphorus uptake, based on crop type and area destinated for crop production, which are regularly more spatially scarce in vegetation patches.
Figure 3. Suitable land for manure application.
Future Plans
Validate the model of suitable land for manure application by checking the available data for manure production, cropland areas and slope with other official sources, and taking random samples among the counties to compare the results under field conditions.
Incorporate a socio-economic analysis for manure transportation among and within different counties.
While the county level context and characteristics have value, it would increase the accuracy of the model if more information about individual and smaller scale farms and animal feeding operations could be geospatially available. Thus, where possible, it is the researcher’s goal to improve the current analysis with the addition of more accurate data on animal operations within each county to adjust the estimation of manure production, and the nutrients balance.
Promote Outreach efforts with farmers for making decisions based on a nutrient management approach that could decrease the importation of inorganic fertilizers, where possible.
Authors
Presenting author
María José Oviedo, Graduate Research Assistant, University of Nebraska-Lincoln
Corresponding author
A. Millmier Schmidt, Associate Professor & Livestock Manure Management Engineer, University of Nebraska-Lincoln
Corresponding author email address
aschmidt@unl.edu
Additional authors
A. Millmier Schmidt, Associate Professor & Livestock Manure Management Engineer, University of Nebraska-Lincoln; J. Iqbal, Assistant Professor, University of Nebraska-Lincoln; A. Yoder, Associate Professor, University of Nebraska Lincoln; and B. Maharjan, Assistant Professor, University of Nebraska Lincoln
Additional Information
Basnet, B. B., Apan, A. A., & Raine, S. R. (2001). Selecting Suitables Sites for Animal Waste Application Using Raster GIS. Environmental Management, 519-531.
Cassman, K., Dobermann, A., & Walters, D. (2002). Agroecosystems, Nitrogen-use Efficiency, and. Agronomy & orticulture– Faculty Publications, 356.
Fergunson, R. (2015). Groundwater Quality and NItrogen Use Efficiency in Nebraska’s Central Platte River Valley. Journal of Environmental Quality.
Gollehon, N., Caswell, M., Ribaudo, M., Kellog, R., Lander, C., & Letson, D. (2011). Confined Animal Production and Manure Nutrients. Washington, DC: Resource Economics Division, Economic Research Service, U.S. Department of.
Kellog, R. L., Lander, C. H., Moffit, D. C., & Gollehon, N. P. (2000, Diciembre). Manure Nutrients Relative to the Capacity of Cropland and Pastureland to Assimilate Nutrients. Retrieved from USDA: www.nhq.nrcs.usda.gov/land/index/publication.html
Nebraska Department of Agriculture. (2020). Nebraska Fertilizer, Soil Conditioner and Ag Lime Tonnage and Sampling Reprot Calendar year 2020. Lincoln: nda.nebraska.gov.
Spiegal, S., Kleinman, P., Endale, D., Bryan, R., Dell, C., Goslee, S., . . . Gowda, e. a. (2020, June). Manuresheds: Advancing nutrient recycling in US agriculture. Agricultura Systems 182, 102813. doi:https://doi.org/10.1016/j.agsy.2020.102813
Doegan, H. A., Dodd, F. J., & McMaster, T. B. (1994). A Statistical Approach to Consistency in AHP. Marh.Comput.Modelling., 19-22.
Barker, B. (2017, April 4). Moderate flax response to nitrogen. Top Crop Manager. Retrieved from https://www.topcropmanager.com/moderate-flax-response-to-nitrogen-19985/#:~:text=Generally%2C%20flax%20takes%20up%202.83,sensitive%20to%20seed%2Dplaced%20fertilizer.
Barker, B. (2019, December 3). Managing phosphorus in flax. Top Crop Manager. Retrieved from https://www.topcropmanager.com/managing-phosphorus-in-flax/
Fertilizer Canada. (2001). Phosphorus Management for Pulses. Canola Council of Canada. Retrieved from https://www.canolacouncil.org/download/2042/canola-watch/14659/cfi_nutrient_uptake_for_wcanada_2001
Grains Reseach & Development Research. (2018). Grownotes: Chickpea-Section 5. Grains Reseach & Development Research. Retrieved from https://grdc.com.au/__data/assets/pdf_file/0030/369444/GrowNote-Chickpea-West-5-Nutrition.pdf
Grains Research & Development Corporation. (2018). Grownotes: Lentils- Section 7. Grains Research & Development Corporation. Retrieved from https://grdc.com.au/__data/assets/pdf_file/0028/366166/GrowNote-Lentil-West-7-Nutrition-Fertiliser.pdf
Grains Research & Development Corporation. (2018). Grownotes: Triticale-Section 5. Grains Research & Development Corporation. Retrieved from https://grdc.com.au/__data/assets/pdf_file/0025/370645/GrowNote-Triticale-South-05-Nutrition.pdf
Kang, F., Wang, Z., Xiong, H., Li, Y., Wang, Y., Fan, Z., . . . Zhang, Y. (2020). Estimation of Watermelon Nutrient Requirements based on the QUEFTS Model. Agronomy, 1776. Retrieved from file:///C:/Users/Majo/Downloads/agronomy-10-01776-v2.pdf
Meena, B. P., Kumar, A., Dhar, S., Paul, S., & Kumar, A. (2015). Productivity, nutrient uptake and quality of popcorn and potato in relation to organic nutrient management practices. ICAR-Indian Agricultural Research Institute, 110 012.
Sullivan, D. M., Peachey, E., Heinrich, A., & Brewer, L. J. (2020). Nutrient and Soil Health Management for Sweet Corn (Western Oregon). Oregon State University. Retrieved from https://catalog.extension.oregonstate.edu/sites/catalog/files/project/pdf/em9272.pdf
Warncke, D., Dahl, J., & Jacobs, L. (2009). Nutrient Recommendations for Field Crops in Michigan. Michigan State University. Retrieved from https://www.canr.msu.edu/fertrec/uploads/E-2904-MSU-Nutrient-recomdns-field-crops.pdf
Warncke, D., Dahl, J., & Zandstra, B. (2004). Nutrient Recommendations for Vegetable Crops in Michigan. Michigan State University.
Manage Cookie Consent
To provide the best experiences, we use technologies like cookies to store and/or access device information. Consenting to these technologies will allow us to process data such as browsing behavior or unique IDs on this site. Not consenting or withdrawing consent, may adversely affect certain features and functions.
Functional
Always active
The technical storage or access is strictly necessary for the legitimate purpose of enabling the use of a specific service explicitly requested by the subscriber or user, or for the sole purpose of carrying out the transmission of a communication over an electronic communications network.
Preferences
The technical storage or access is necessary for the legitimate purpose of storing preferences that are not requested by the subscriber or user.
Statistics
The technical storage or access that is used exclusively for statistical purposes.The technical storage or access that is used exclusively for anonymous statistical purposes. Without a subpoena, voluntary compliance on the part of your Internet Service Provider, or additional records from a third party, information stored or retrieved for this purpose alone cannot usually be used to identify you.
Marketing
The technical storage or access is required to create user profiles to send advertising, or to track the user on a website or across several websites for similar marketing purposes.