Integrated Resource Management Tool to Mitigate the Carbon Footprint of Swine Produced in the United States


green stylized pig logoOutputs of This Project: ModelResearch SummariesExtension/Outreach Content | WebcastsProfessional Conference Presentations | Journal Articles | Acknowledgments

What Did We Do?

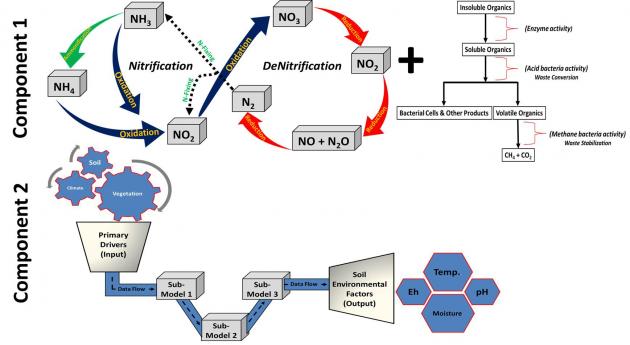
Modeling: The overall goal of the modeling effort was to enhance the National Pork Board swine carbon footprint calculator by integration of specific modules for: animal growth and feed ingredient impacts on manure characteristics. The process model output is to be used as input to life cycle assessment (LCA) to evaluate cradle-to-farm-gate environmental impacts of swine production. An economic analysis model incorporated both process based results (live animal weight, feed, fuel, etc.) and LCA results (greenhouse gas, GHG emissions) to model the cost and potential of different options for reducing GHG emissions in swine production. More…

The model development is supported through an experimental research program focused on feed efficiency and manure management. Feed efficiency is affected by the feed composition and animal physiology which is affected by the animal’s health status. Our research addressed both issues with laboratory and full scale feeding trials.

Health Status: In trials, Porcine Reproductive and Respiratory Syndrome Virus (PRRSV) infection caused significant reductions in feed intake which led to reductions in rates of gain and body weight. The infection also caused a reduction in diet digestibility leading to greater manure nutrient output per unit of feed intake and increased greenhouse gas (GHG) production from the stored manure. The impact on GHG production is particularly striking when the data are expressed as litters of gas per kilogram of body weight gain. The increased gas production combined with reduced rates of gain results in more than a tripling of gas production per unit of gain for all of the gases. Vaccination against PRRSV appeared to offer little benefit in terms of animal performance, manure nutrient output, or gas production from manure. More…

NIFA swine carbon footprint project partnersAmino Acid Supplementation: Studies confirmed that crude protein can be replaced with feed grade AA to meet the requirement of the first 5 limiting AA without negatively impacting growth performance or carcass composition when diets are formulated on a NE basis; however, further CP reductions resulted in more variable growth performance.

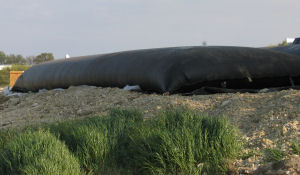
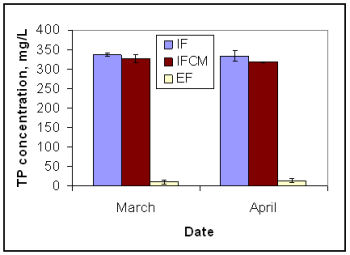
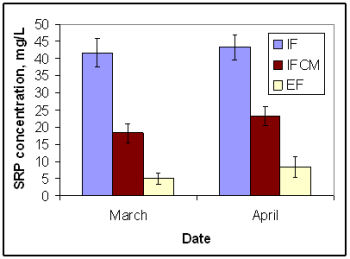
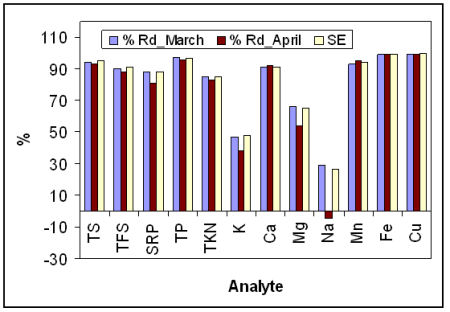
Manure Management: The gasification system has been successfully operated with an algae feed stock in a series of preliminary, proof-of-concept tests. The algal turf system has been fully constructed and is now operational with samples being taken for nitrogen and bacteria levels. Nutrient retention management technologies for manure will include algal growth for on-farm nitrogen retention using a pilot scale experimental system and thermal conversion to fuel gas and bio-char (a soil amendment).

Extension, Outreach, Undergraduate Research Experiences: A significant component of this project is devoted to non-research activities including developing materials for extension work – disseminating research information to non-technical audiences for integration into existing knowledge and application in farm decision-making. Undergraduate students from several universities were also provided with opportunities to participate in research projects, gaining valuable experience and to train potential future scientists.

Model

The Swine Environmental Footprint Calculator is available from the National Pork Board. It will continue to be updated when applicable research information and data sets are available. Go to the model home page….

Research Summaries

Also visit the conference presentations section to find out more about the research findings.

Extension-Outreach Web Content and Printed Materials

The extension materials (focused on transferring research information to a non-research audience) include:

  • short articles written in an FAQ style
  • case studies (pending) on using data from commercial farms
  • curriculum materials for use in high school classrooms that includes manipulatives and activities as well as printed information
  • fact sheets: What is a water footprint? | What is a land footprint? | What is a carbon footprint?

Several Extension Webcasts Were Produced By This Project

  • Thermal Conversion of Animal Manure to Biofuel – Go to archive… (February, 2014)
  • Life Cycle Assessment Modeling for the Pork Industry – Go to archive…. (July, 2012)
  • Producer Association Efforts to Address Carbon Footprint (Pork and Poultry) – Go to archive… (June, 2012)

Conference Presentations Made By Project PI’s

Overall project  – https://scisoc.confex.com/crops/2012am/webprogram/Paper72165.html (from 2012)

Waste to Worth: Advancing Sustainability in Animal Agriculture (March-April, 2015)

  • Environmental Footprint, Cost, and Nutrient Database of of U.S. Animal Feed Ingredients More…
  • Exploring Interactions Between Agricultural Decisions and Greenhouse gas Emissions Using Swine Production More…
  • Feeding Strategies to Mitigate Cost and Environmental Footprint of Pig Production in the US More…
  • Reducing the Costs and Environmental Footprint of Pig Diets with the Experimental Optimum Synthetic Amino Acid Inclusion  More…
  • Adapting Agriculture to Sustainably Feed the World (keynote) More…

Waste to Worth: Spreading Science and Solutions (April, 2013)

  • Refining a Pork Production Carbon Footprint Mitigation Tool: A Case Study of an Integrated Research/Extension/Education Project – More…

LCA Food 2014

  • Panel presentation: Burek J, Thoma G, Popp J, et al. Developing Environmental Footprint,Cost, and Nutrient Database of the US Animal Feed Ingredients.
  • Poster presentation: Burek J, Thoma G, Popp J, et al. Formulating low-cost and low-environmental footprint swine diets.

Midwest Section – American Society of Animal Science

  • 2015 – Comparison of the effects of antibiotic-free and conventional management on growth performance in swine. C. E. Vonderohe*, A. M. Jones, B. T. Richert, J. S. Radcliffe, Purdue University, West Lafayette, IN. Abstract 102, page 47.
  • 2014 – Effect of feeding reduced-CP, amino acid supplemented diets on dietary nitrogen and energy utilization and volatile fatty acid excretion in wean-to-finish swine. A. M. Jones1*, D. T. Kelly1, B. T. Richert1, C. V. Maxwell2, J. S. Radcliffe1,1 Purdue University, West Lafayette, IN, 2 University of Arkansas, Fayetteville. Abstract 037, page 16.
  • 2013 – Effects of amino acid supplementation of reduced crude protein (RCP) diets on performance and carcass composition of growing-finishing swine. J. K. Apple1*, B. E. Bass1, T. C. Tsai1, C.V. Maxwell1, J. W. S. Yancey1, A. N. Young1, M. D. Hanigan2, R.Ulrich3, J. S. Radcliffe4, B. T. Richert4, G. Thoma3, J. S. Popp5,1 Animal Science, University of Arkansas Division of Agriculture, Fayetteville, 2 Dairy Science, Virginia Polytechnic Institute and State University, Blacksburg, 3 Chemical Engineering, University of Arkansas, Fayetteville, 4 Animal Science, Purdue University, West Lafayette, 5 Agricultural Economics & Agribusiness, University of Arkansas Division of Agriculture, Fayetteville. Abstract 0224, page 73.
  • 2013 – Effects of amino acid supplementation of reduced crude protein (RCP) diets on LM quality of growing-finishing swine. A.N. Young1,*, J. K. Apple1, J. W. S. Yancey1, J. J. Hollenbeck1, T. M.Johnson1, B. E. Bass1, T. C. Tsai1, C. V. Maxwell1, M. D. Hanigan2,J. S. Radcliffe3, B. T. Richert3, J. S. Popp4, R. Ulrich5, G. Thoma5,1 Animal Science, University of Arkansas Division of Agriculture, Fayetteville, 2 Dairy Science, Virgina Polytechnic Institute and State University, Blacksburg,3 Animal Science, Purdue University, West Lafayette,4 Agricultural Economics & Agribusiness, University of Arkansas Division of Agriculture,5 Chemical Engineering, University of Arkansas, Fayetteville. Abstract P027, page 97.
  • 2013 – Maximum replacement of CP with synthetic amino acids in nursery pigs. B. E. Bass1, T. Tsai1*, M. D. Hanigan2, J. K.Apple1, R. Ulrich3, J. S. Radcliffe4, B. T. Richert4, G. Thoma3, J.S. Popp5, C. V. Maxwell1,1 Animal Science, University of Arkansas, Fayetteville, 2Dairy Science, Virginia Polytechnic Institute and State University, Blacksburg, 3 Chemical Engineering, University of Arkansas, Fayetteville, 4 Animal Science, Purdue University, West Lafayette, 5 Agriculture Economics & Agribusiness, University of Arkansas, Fayetteville. Abstract P042, page 102.

ASA/CSSA/SSSA amino acid work https://scisoc.confex.com/crops/2012am/webprogram/Paper75311.html  overall project (also linked at top of this list) https://scisoc.confex.com/crops/2012am/webprogram/Paper72165.html

Journal Articles

Manure Management & Algae Systems

  • Sadaka, S., M. Sharara and G. Ubhi. 2014.  Performance Assessment of an Allothermal Auger Gasification System for On-Farm Grain Drying. Journal for Sustainable Bioenergy Systems. Vol. 4: 19-32.
  • Sharara M, Holeman N, Sadaka S, Costello T. 2014. Pyrolysis kinetics of algal consortia grown using swine manure wastewater. Bioresource Technology. 169: 658-666.
  • Sharara, M. and S. Sadaka. 2014. Thermogravimetric Analysis of Swine Manure Solids Obtained From Farrowing, and Growing-Finishing Farms. Journal for Sustainable Bioenergy Systems. Vol. 4: 75-86.

Acknowledgements

Project Director: Greg Thoma gthoma@uark.edu, Co-Project Director: Marty Matlock mmatlock@uark.edu
Principle Investigators: Richard Ulrich, Jennie Popp, Charles Maxwell, Thomas Costello, Scott Radcliffe, Mark Hanigan, Brian Richert, Karl VanDevender, Sammy Sadaka, Chengsheng Li, William Salas

This information is part of the program “Integrated Resource Management Tool to Mitigate the Carbon Footprint of Swine Produced In the U.S.,” and is supported by Agriculture and Food Research Initiative Competitive Grant no. 2011-68002-30208 from the USDA National Institute of Food and Agriculture. Project website: https://lpelc.org/integrated-resource-management-tool-to-mitigate-the-carbon-footprint-of-swine-produced-in-the-united-states/.

Improving Manure Nutrient Application in Karst Topography (CIG Summary)

Project Title and Full Report Link

Demonstration of Enhanced Technologies for Land Application of Animal Nutrient Sources in Sensitive Watersheds
Entire Report (PDF file, 1.5 MB)

Project Background

Land application of animal manure has been implicated as a contributing factor of non-point source pollution. The application of these manure nutrient sources are often made without adequate knowledge of its nutrient content, resulting in application rates far in excess of crop removal. In addition, application methods have lead to inefficient use of manure nutrients and are pollution potentials. Consequently, residual fertility has increased, and so have N and P leaching from soil environments.

Illustration of environmentally sensitive features in karst topography


Several pieces of legislation have been enacted to limit non-point source pollution including the Clean Water Act of 1972 (Public Law 92-500) and the Safe Drinking Water Act of 1974 (Public Law 93-523). The result of these legislative acts is that the USDA-NRCS has been tasked with carrying out training for, and implementation of nutrient management plans (NMPs). To develop a NMP, a manure sample must be collected and analyzed for total nitrogen (TN) and total phosphorus (TP) on an annual basis. The justification for requiring manure samples in NMPs is that published manure nutrient characteristics show significant variability as far as actual concentrations (Dou et al., 2001; and Lindley et al., 1988).

Because laboratory analysis of submitted manure samples can require up to two weeks, it has been suggested that on-farm methods for determining TN and TP would allow producers to rapidly assess concentrations of nutrients in manure for calculating application rates. Although rapid methods exist for determining TN and TP (Cheschier, 1985; and Van Kessel et al., 1999), their use has not been widely adopted. A rapid on-farm method for determining TN and TP in swine slurry has been proposed by Higgins et al. (2004a,b), to provide producers with a means of predicting manure TN and TP to calculate application rates to meet crop and NRCS-NMP requirements. However, even if manure samples are collected and nutrient determinations are made, an obstacle for producers is how to alter land application rates, where to vary rates, and how to apply manures effectively.

Previous work suggests that surface application, in contrast to sub-surface injection, may result in elevated odor levels and volatilization of ammonia (Jokela and Côté, 1994). Pain et al. (1991) demonstrated that subsurface manure injection reduces odor emissions by up to 80%. Misselbrook et al. (1996) reported that subsurface injection reduced ammonia volatilization by up to 79% on grasslands when contrasted with surface application. The resulting quantity of nitrogen available for crop growth is significantly reduced (Schmitt et al., 1995). Manure applied to soil in addition to fertilizer N is a significant source of excessive soil NO3-N (Angle et al., 1993; Jokela, 1992). There is evidence that manure increases NO3-N leaching compared to fertilizer N applied at equivalent nitrogen rates (Jemison and Fox, 1994; Roth and Fox, 1990). Because most NMPs are based on plant N requirements, this invariably means that P is over-applied relative to needs. Although many soils have considerable P sorption capacity, residual inorganic and organic P will build up with time, resulting in increasingly greater opportunities for P to leach and/or be carried to sensitive waters by surface runoff. Once soil test P values exceed crop requirements, the potential for P loss far exceeds any agronomic benefits (McDowell et al., 2002).

Recent work suggests that surface application of manure to pasture lands can make grasses less palatable to animals, and may create disease and pathogen problems. Warner and Godwin (1988) have shown that injection prevents the risk of crop contamination and pathogenic activities. Manure injection or incorporation provides more available nutrients to the plant (Schmitt et al., 1995). Injection was determined to cause grass damage as a result of soil disturbance in two investigations (Hann et al., 1987; and Warner and Godwin, 1988). Alternately, Hultgreen and Stock (1999) found a yield increase associated with manure injection and incorporation. Objectives

Goal and Objectives

The major issue with respect to watershed protection is how to manage manure application in ways that are not detrimental to water, soil, and air quality. The goal of this project was to demonstrate state-of-the-art nutrient management technologies and application practices for the purposes of educating producers and custom waste applicators. These techniques enable producers to maintain crop yields while increasing nutrient utilization, and reduce the potential for leaching and off-site movement of nutrients. This project was accomplished by completion of the following objectives:

  • Demonstrate a rapid on-farm model for determining total N and P

contents using historical manure data and solids content.

  • Demonstrate the efficacy of guidance aids and map-based manure

application to reduce the potential for offsite nutrient movement in environmentally sensitive areas when used in conjunction with subsurface and aerated injection application systems.

  • Demonstrate the use of variable-rate manure management and real-time

solids content sensing for injection application systems.

  • Quantify the environmental benefits and costs associated with

producer adoption of one or more of these technologies and management practices.

More Information

Stephen Higgins
Biosystems and Agricultural Engineering
128 C. E. Barnhart Building
University of Kentucky
Lexington, KY. 40546-0276

This research summary was prepared with the assistance of William Reck, USDA NRCS

Integrated Process-Based Swine Operation Model with Life Cycle Assessment (LCA) and Life Cycle Costing (LCC) Economic Analysis

green stylized pig logoDr. Greg Thoma, Dr. Richard Ulrich and Dr. Jennie Popp – University of Arkansas, Dr. William Salas and Dr. Chengsheng Li – DNDC Applications, Research and Training

Why Develop Models for Pork Production and Environmental Footprint?

Change in complex systems can occur either systemically, for example by government policy or regulation, or by adoption of new practices by individuals followed by wider adoption where the new practice is effective. This is costly and early adopters incur high risk of failure. This risk can be reduced through good decision support systems to aid in the selection of optimal practices – in effect, with a good model of the system, adoption of management techniques or technology can be tested by simulation before physical implementation.

This is the fundamental utility of models: they provide an inexpensive low risk alternative to experimental trial and error. The swine production model being developed for this project is based on the National Pork Board (NPB) Pig Production Environmental Footprint Calculator written at the University of Arkansas and first released in May 2011.

The National Academy of Sciences reported that EPA methodology should be improved by replacing emission factors with “process-based” models.” The tradeoff is that process-based models are more complex. Our team worked with the National Pork Board to create a process based emission model for swine production to serve as the foundation for a decision support system. This combined emission and cost model, the Pig Production Environmental Footprint Calculator (V2), was released in June 2013, and V3 will be released in Fall, 2015.

This model estimates GHG emissions, water use, land occupation and day-to-day costs from multiple farm operations to identify major contributions and provide a test bed for evaluating potential reduction strategies. The model requires readily available input information such as the type of barn, animal throughput, ration used, the time in the barn, weather for the area, type of manure management system as well as energy and feed prices. The model output includes a summary GHG emissions, water consumption, land occupation and costs by source, of as well as feed and energy usage for the simulation.

University of Arkansas DNDC-ART logo Project Objectives

Integrate process-models of swine production with coupled life cycle assessment (LCA) and economic models to create a decision support tool to identify economical swine production system options which minimize GHG emission and increase sustainability of production systems.

  • Improve existing process algorithms to capture effects of barn climate control, feed phases, water distribution, solar insolation, and manure application technology on GHG emissions.
  • Expand and improve the user interface, making it more intuitive and user-friendly.
  • Expand the feed ingredient list and improve estimations of important feed characteristics needed for the model.
  • Develop economic algorithms and compile relevant cost databases to capture the costs of day-to-day activities that entail water use and generate GHGs on farm.

Research Summary: What Have We Done? What Have We Learned?

Scale of the farm and manure systems

The model was converted from barn-level to a farm-level tool by integrating the barns and manure systems together through the model input procedures. In this way the emissions from the various on-farm operations can be compared on the same basis and put into perspective with regard to emission sources. There can be up to ten barns, each with its own associated manure system (subfloor, deep pit and, added in year 4, dry bedding) and 10 separate downstream manure handling systems (lagoon, outside storage and, recently added, a digester). Each barn can have its manure stream routed to any downstream manure system enabling streams to be combined for processing before going to the fields. An algal turn scrubber option can be added as an adjunct to any downstream system.

All of the manure handling systems, both those associated with a barn and those downstream of the barns, were written at the University of Arkansas and all but the digester are process-based. A digester option was added with options for burning the produced methane as barn heat or for producing electricity. Emissions are calculated for the transport of manure to the fields but not for emissions after application.

Growth, performance and amino acid inclusion in rations

The National Research Council (NRC) growth and performance model was integrated into the full farm level model in order to link ration characteristics and growth performance. We have closed the mass balance over the farm for carbon, nitrogen, phosphorous, water and manure solids. Addition of the NRC model also brought in the effects of ractopamine and immunocastration management options.

Testing of the revised growth equations with respect to the effects of individual amino acids (AA) was completed and a manuscript has been partially drafted. A revised equation predicting the effects of heat stress on feed intake was derived and incorporated into the model resulting in much better predictions of these effects than provided by the native NRC equations. Equations describing the impact of heat and cold stress on energy maintenance costs were also constructed, but have yet to be incorporated into the model. These latter 2 efforts were carried out primarily by a postdoctoral student employed on the National Animal Nutrition Program (NRSP-9) with the resulting equations made available to the project. Two manuscripts describing this work have been drafted and will be submitted in Fall, 2015. Finally, a method of deriving model settings to match observed rates of daily gain and feed conversion efficiency was devised and recently passed onto the barn model team for incorporation into the barn model. This will allow the model to be easily calibrated to observed gain and feed efficiency as input by the user.

Weather information

We updated the model weather files from the MERRA database for each of the 3102 counties in the U.S. These files have, in addition to temperature and humidity, other useful information such as precipitation, solar insolation, subsurface temperatures at various depths, and snow cover. The additional MERRA information facilitated addition of a solar panel option and will be used to estimate rainwater contribution to outside manure handling facilities and of solar insolation on inside barn temperatures.

What Is the DNDC Model?

The DNDC (DeNitrification and DeComposition) model was developed for quantifying N2O emissions from agricultural soils in the late 1980s (US EPA, 1995). By including fundamental bio-geochemical processes of carbon and nitrogen transformations, DNDC was extended to model soil C sequestration and other trace gases (e.g., methane, nitric oxide, ammonia etc.) in the early 1990s.

DNDC consists of two components. The first component entails three sub-models and converts primary drivers (i.e., climate, soil, vegetation and anthropogenic activity) to soil environmental factors (i.e., temperature, moisture, pH, Eh and substrate concentration gradient). The second component consists of nitrification, denitrification and fermentation sub-models; and simulates production/consumption of N2O, NO, N2, NH3 and CH4 driven by the modeled soil environmental conditions [see graphic below]. With the bio-geochemical reactions embedded in the model framework, DNDC can predict the turnover of soil organic matter and the consequent trace gas emissions and nitrate leaching losses.

Feed ingredients

With input from industry and academic experts, our feed ingredient database was revised to better capture the expected range of ingredients typically available to producers in the US. Carbon, water and land footprint data as well as nutritional characteristics for the NRC growth equations were compiled for each feed ingredient. Economic models, that estimate the cost of feed, manure handling, utilities (water, electricity, gas, propane and diesel), dead animal disposal and immunocastration were integrated into the model. Capital costs are not considered. We are conducting cost benefit analyses on combinations of operations, manure management and dietary feeding systems aimed at reducing GHG emissions. These will help identify incentives to minimize  mitigation strategy cost. Routines have been developed that will allow the user to download a set of updated prices for utilities and major feed ingredients.

DeNitrification and DeComposition (DNDC) Model (Soil)

The DeNitrification and DeComposition (DNDC) model requires numerous weather and site inputs, many of which are output from the environmental calculator, and others which require site-specific geographical characteristics (e.g., soil type). We analyzed the agricultural area of each continental-US county using agricultural classes from the 2013 NASS Cropland Data Layer. For each county, we assigned the mean latitude/longitude of all agricultural pixels as the agriculture-weighted centroid from which representative weather data will be extracted.

County soils data are derived from the NRCS General Soils Map (STATSGO). We derived the spatial intersection of STATSGO soil polygons with county boundaries. We summarized top soil data for each soil polygon from 0 to 10cm depth for clay fraction (a proxy for soil texture), bulk density, organic matter fraction (to estimate soil organic carbon, SOC), and pH. Modeled results will be based on either the comprehensive set of soil polygon attributes or a representative distribution of soil attributes for each county (depending on timing and available computing power).

Summary

The model will enable the user to find hot spots in their emissions profile, evaluate the effects of operational changes, and estimate the emissions from facilities during the design stage. The further addition of an operational economic model will provide the ability to perform cost/benefit analyses of practices that can change impact GHG emissions (see video).

Work will continue on this project through Spring, 2016.

Figure 1. Diagram of the DeNitrification and DeComposition (DNDC) model

diagram

Why Does This Matter?

The environmental footprint model, with improved algorithms for manure management, economics, and animal performance provide high resolution and flexible decision support for the swine industry. The model enables users to identify hot spots in their emissions and water/land use profiles, evaluate the effects of operational changes, and estimate the emissions from facilities during the design stage. The further addition of an operational economic model enables cost/benefit analyses.

These enhancements support evaluations of dietary energy, protein, and amino acid content for much of the life cycle and immunocastration and the use of ractopamine during the growth cycle. They also allow assessment of the performance, economic, and environmental impact of transient health events during the growth cycle with respect to whole farm operation.

For More Information

  • Related Research Projects
  • [archived webinar] Life Cycle Assessment Modeling for the Pork Industry – More… (July, 2012)
  • [archived webinar] Producer Association Efforts to Address Carbon Footprint (Pork and Poultry) – More… (June, 2012)

Contact Information

Dr. Greg Thoma
gthoma@uark.edu
Phone: (479) 575-7374

Dr. Richard Ulrich
(retired)

Dr. Jennie Popp
jhpopp@uark.edu
Phone: (479) 575-2279

Dr. William Salas
wsalas@dndc-art.com
Phone: (603) 292-5747

Dr. Chengsheng Li
cli@dndc-art.com
Phone: (603) 862-1771

Acknowledgements

This information is part of the program “Integrated Resource Management Tool to Mitigate the Carbon Footprint of Swine Produced In the U.S.,” and is supported by Agriculture and Food Research Initiative Competitive Grant no. 2011-68002-30208 from the USDA National Institute of Food and Agriculture. Project website: https://lpelc.org/integrated-resource-management-tool-to-mitigate-the-carbon-footprint-of-swine-produced-in-the-united-states/.

Feed Management and Phosphorus Excretion in Dairy Cows

What Is the Connection between Phosphorus and Water Quality?

Holstein Cow

“Phosphorus (P) is an essential element for plant and animal growth and its input has long been recognized as necessary to maintain profitable crop and animal production. Phosphorus inputs can also increase the biological productivity of surface waters by accelerating eutrophication. Eutrophication is the natural aging of lakes or streams brought on by nutrient enrichment. This process can be greatly accelerated by human activities that increase nutrient loading rates to water. Eutrophication has been identified as the main cause of impaired surface water quality (U.S. Environmental Protection Agency 1996). Eutrophication restricts water use for fisheries, recreation, industry, and drinking because of increased growth of undesirable algae and aquatic weeds and the oxygen shortages caused by their death and decomposition.” Reprinted with permission from the author: Sharpley et al., 2003)

The association of P with eutrophication of surface waters has resulted in a significant focus on the role of P in animal agriculture. P-related research in recent years has concentrated on two main areas: reducing P excretion from livestock and application and transport of P on agricultural fields. Lowering dietary P concentration has been a means of reducing P inputs to dairy operations. In 2003, a report indicated that, on average, dietary P concentrations were 34% above recommended levels. Reducing the dietary P concentrations in dairy cattle diets to recommended concentrations has not negatively impacted milk production, health, or reproductive parameters. The economic advantages of reducing P imports to the farm have helped to improve industry acceptance of this management practice and have led dairy producers and nutritionists to reduce the P concentrations in dairy diets. (Reprinted with permission from the author: Harrison et al., 2007).

References

Harrison, J. H., T. D. Nennich, and R. White. 2007. Review: Nutrient management and dairy cattle production. CABI Publishing 2007 (Online ISSN 1749-8848). Available online at https://www.cabi.org/cabreviews/review/20073124579 (Verified 14 December, 2010).

Sharpley, A.N., T. Daniel, T. Sims, J. Lemunyon, R. Stevens, and R. Parry. 2003. Agricultural Phosphorus and Eutrophication, 2nd ed. U.S. Department of Agriculture, Agricultural Research Service, ARS–149, 44 pp.

Research Project on Phosphorus Feed Management

A project started in February 2009 to enhance feed management practices to reduce manure phosphorus excretion in dairy cattle. This project takes an “integrated approach” to increase the adoption of reduced phosphorus feeding on dairy farms.

Overall Goal

Improve our accuracy of meeting the phosphorus requirement of the dairy cow without oversupplying phosphorus in the ration by better understanding the availability of phoshorus in feedstuffs (reduce current practices of overfeeding phosphorus to ensure that the animal requirements of phosphorus are met).

Project Funding

This project has been funded by the USDA National Research Initiative Program from 2009 through 2012.

Project Team

Project Director: Katharine Knowlton Virginia Tech Department of Dairy Science
Email: knowlton@vt.edu

Charlie Stallings Virginia Tech Department of Dairy Science
Email: cstallin@vt.edu

Bob James Virginia Tech Department of Dairy Science
Email: jamesre@vt.edu

Mark Hanigan Virginia Tech Department of Dairy Science
Email: mhanigan@vt.edu

Joe Harrison Washington State University, Puyallup
Email: jhharrison@wsu.edu

Sandy Anderson Washington State University, Puyallup
Email: sandra_anderson@wsu.edu

What We Expect to Achieve

  • Develop analytical techniques to improve assessment of phosphorus digestion and excretion in lactating cows.

To view a larger version of this diagram click on Phosphorus Metabolism in Dairy Cattlecc2.5 Katharine Knowlton

  • Evaluate the variation in digestion and excretion of phosphorus-containing compounds in lactating cows using the newly developed analytical techniques.


Tzu-Hsuan Yang, Virginia Tech grad student, analyzing samples with nuclear magnetic resonance. cc2.5 Katharine Knowlton


  • Develop and test a model that will more accurately estimate phosphorus digestion and metabolism in lactating cows. The model will be used in dairy cattle ration formulation.


To a view a larger version of this diagram click on Phosphorus Digestion and Metabolism Modelcc2.5 Katharine Knowlton


  • Develop, implement, and assess an effective information transfer process to encourage adoption of research findings via educational tools and on-farm assessment.


Dr. Bob James, Virginia Tech dairy science professor, is leading a project where nine Virginia dairy farms have implemented feed management software to improve feed management through ration formulation and more accurate mixing and delivery of rations. cc2.5 Bob James and Lynn VanWieringen.


Outreach Opportunities:

Our team is ready and willing to serve as speaker for nutrition conferences on the following topics:

  • Using feed management software to improve farm profitability and whole farm nutrient balance – Dr. Bob James Email: jamesre@vt.edu
  • Incentive payments to reduce overfeeding of phosphorus – Dr. Charlie Stallings Email: cstallin@vt.edu
  • Next generation of precision feeding – Where are we going from here? – Dr. Katharine Knowlton and Dr. Mark Hanigan Emails: knowlton@vt.edu, mhanigan@vt.edu
  • Modeling Phosphorus Digestion to Improve Predictions in Ration Balancing Software – Dr. Mark Hanigan Email: mhanigan@vt.edu

Presentations:

Impact of feed management software on feeding management and whole farm nutrient balance of Virginia dairy farms

Robert James, B. E. Cox, C. S. Stallings, K. F. Knowlton, M. Hanigan

Virginia Tech – jamesre@vt.edu

The impact of precision feeding utilizing feed management software on whole farm nutrient balance (WFNB), dietary phosphorus, and feeding management was studied on nine treatment and six control farms selected in four regions of the Chesapeake Bay Watershed of Virginia from 2006 through 2008. Herd sizes averaged 271 and 390 lactating cows, and milk yield averaged 30 and 27 kg/cow/d for treatment and control farms. Crop hectares averaged 309 and 310 for treatment and control farms. Treatment farms installed feed management software between May and October 2006. Data were collected for calendar year 2005 and each calendar year through 2008 to compute WFNB. On treatment farms, up to five feed samples were obtained monthly including each total mixed ration (TMR) fed to lactating cows. Control farms submitted TMR samples every two months. Standard wet chemistry analysis of samples was performed. Feed management data stored in the software were collected monthly from each treatment farm concurrent with feed sampling. Daily overfeeding of all dietary ingredients across treatment farms averaged 1.25% ± 5.86, ranging from -67.28% to +54.57% during the first year of the trial. This corresponded to average daily overfeeding of CP and P of 2.26% ± 6.88 and 1.91% ± 6.39, respectively for 2006. Whole farm nutrient balance did not differ between treatment and control farms for 2006. However, eight of nine treatment herds qualified for incentive payments for limiting P intake to less than 120% of NRC requirements in 2006. Data from 2007 and 2008 indicated that herds utilizing feed management software formulated and fed rations that were within 116% of NRC requirements for P. Data from feed management software revealed that extensive use of by-product feeds and the high nutrient variability of forages contributed to overfeeding of both CP and P. Category: Agricultural BMPs

View slide show

This presentation was presented at the 2011 American Dairy Science Meetings in New Orleans by Partha Ray, M D Hanigan, and K F Knowlton.

Quantification of phytate in dairy digesta and feces using alkaline extraction and HPIC


Publications:

Using Incentive Payments to Reduce Overfeeding of Phosphorus

This poster was presented at the 2010 Land Grant and Sea Grant National Water Conference by Charles C. Stallings, K. F. Knowlton, R. E. James, and M. D. Hanigan.

View Dairy Incentive Poster

Total and inorganic phosphorus content of an array of feedstuffs

This poster was presented at the 2011 American Dairy Science Meetings in New Orleans by Jamie Jarrett, M D Hanigan, R Ward, P Sirois, and K F Knowlton.

Total and inorganic phosphorus content of an array of feedstuffs

Fate of phosphorus in large intestine of dairy heifers

This poster was presented at the 2011 American Dairy Science Meetings in New Orleans by Partha Ray, M D Hanigan, and K F Knowlton.

 Fate of phosphorus in large intestine of dairy heifers

Webcasts:

Precision Phosphorus Feeding for Dairy Cows

This presentation was originally broadcast on March 19, 2010. There are four short presentations:

  • Dietary Nutrient Management: What Goes In Must Come Out – Dr. Mark Hanigan, Department of Dairy Science, Virginia Tech
  • Precision Phosphorus Feeding Incentive Program – Dr. Charles Stallings, Department of Dairy Science, Virginia Tech
  • Impact of Feed Management Software on Feeding Management and Whole Farm Nutrient Balance – Dr. Robert James, Department of Dairy Science, Virginia Tech
  • Questions and Answers

View Presentation: Precision Phosphorus Feeding for Dairy Cows

Precision Phosphorus Feeding for Dairy Farms

Katharine Knowlton and Jimmy Huffard

During this session on February 7, 2011, Katharine Knowlton of Virginia Polytechnic Institute and State University and Jimmy Hufard, a dairy producer in Virginia, discussed regulations pertaining to phosphorus and how these can affect the dairy farm.

View Presentation: View Presentation of Precision Phosphorus Feeding for Dairy Farms

View Slide Show from presentation:

For an outline of the materials presented, see: Presentation Transcript

Page Manager: Sandy Anderson

Yield and Economic Impact of Fall Versus Spring Applied Manure on Wheat

Livestock and Poultry Environmental Learning Center:

Home Page

All articles about:

Research Summaries

Manure Nutrients

Many questions are asked concerning the right time or the right crop to apply manure.

  • Is there a difference in nitrogen (N) availability if it is applied in the spring or the fall?
  • Is there a difference between crops with early season N demand vs. late season N demand?

To answer these questions a study was initiated at the NDSU Carrington Research Extension Center in 2008 and repeated in 2009 to determine the impact of fall vs. spring applied beef feedlot manure on hard red spring wheat yield and kernel protein.

Activities

Treatments included; fall applied manure, spring applied manure, spring applied urea N and a check with no N. In 2008, the treatments were applied in a no-till situation and in 2009 the treatments were incorporated with one pass tillage. The treatments were applied to supply 150 lb N/acre after crediting soil residual N. The manure treatments were applied assuming 50% of the total N would be available in the first crop year of application. The fall manure was applied in early-November both years. Spring manure and urea were applied in mid-April both years preceding planting. To decrease N volatilization under no-till in 2008, the urea was applied during a rain event 4 hours before planting. In 2009, the urea was incorporated at the same time as application.

What Did We Learn?

According to Figure 1, the spring applied urea and fall manure treatment had the highest yield. The spring applied manure was significantly less yielding than the urea treatment, but not the fall manure treatment.

Wiederholt spring vs fall manure figure 1.jpg


As shown in Figure 2, the urea treatment also had the highest level of kernel protein percentage. The remaining three treatments were all statistically similar and significantly less than the urea treatment.

Wiederholt spring vs fall manure figure 2.jpg


Economics

To provide an economic perspective, nitrogen prices were factored into this study. Area fertilizer dealers provided urea price quotes that equated to $0.45/lb of available nitrogen. An $0.11/lb value of manure nitrogen was determined from manure fertility analysis combined with the cost of hiring a custom manure operator to haul and apply the manure at the Carrington Research Extension Center. The nitrogen input costs were $67.50/ac for urea and $16.50/ac for manure treatments, respectively. Costs associated with urea application were not included since it is often combined with other field operations.

Figure 3. Dollars netted from different nitrogen sources applied on spring wheat.


Gross income was determined by multiplying the price of a bushel of wheat (discounted for protein) by the yield for each treatment. By producing the most and highest quality wheat, the urea treatment grossed the highest at $273.60/ac for 48 bu/ac at $5.70/bu. Gross income on the fall-applied manure treatment was $243.00/ac for 45 bu/ac at $5.40/bu, and the spring-applied manure treatment grossed $198.00/ac for 40 bu/ac at $4.85/bu. The untreated check grossed $141.00/ac for 30 bu/ac at $4.80/bu.

Although the urea treatment grossed the most money the urea nitrogen bill was more than four times greater ($67.50/ac) than the manure treatments ($16.50/ac). Calculating the net return (market price less nitrogen costs) on the use of the fertilizer shows fall-applied manure ($226.50/ac) netted the most with traditional urea ($206.10/ac) second, followed by spring-applied manure ($181.50/ac). The untreated check ($141.00/ac) was last (Figure 3).

Discussion

After two years with different weather conditions, wheat response to manure assuming 50% availability was not as favorable as urea. Manure N needs to be converted by soil bacteria or fungi from an organic to an inorganic form to be available for plant uptake. Wheat is a short season crop with high N demand early in the growing season. Therefore, N mineralized from manure at rates assuming 50% availability may not be available soon enough for the quickly developing wheat crop.

Manure application studies conducted at the Carrington Research Extension Center using corn as the target crop have shown no differences in yield when manure or commercial N was used assuming manure N availability calculated at 50%. Several things happen that may impact the wheat vs. corn response to manure. Assuming 50% of the total N in manure is available for crop uptake in year 1 of application may not meet wheat N needs. More research is needed to determine what plant available N percentage assumption is needed for wheat and other short season cereal grains. Secondly, the spring weather conditions in both 2008 and 2009 were significantly cooler than the average ND spring weather. Since manure N mineralization is driven by biological processes, the cooler than average temperatures may have had more impact on N availability than is typical.

However, while urea out produces manure when only yield is considered, fall-applied manure can return a greater profit per acre because of its cost effectiveness. Producers who do apply manure as a fertilizer for spring wheat, may want to apply a low rate of commercial N fertilizer at planting to maximize yield and return. As a side note, fall manure applications produce higher yields and better quality spring wheat than spring-applied manure.

Authors

Ron Wiederholt and Chris Augustin, NDSU Nutrient Management Specialists
Carrington Research Extension Center, Carrington, ND

This research summary is not peer-reviewed and the authors have sole responsibility for the content.

Mitigating Air Emissions from Animal Manure: Summaries of Innovative Technologies

Reprinted, with permission, from the proceedings of: Mitigating Air Emissions From Animal Feeding Operations Conference.

Summaries Sorted By:

Technologies that apply to multiple species, uses, technology types, and/or pollutants are listed under all applicable groups.

Animal Species

Facility or Use Area

Type of Technology

Pollutant Mitigated

Research Summary: Turnip Response to Vermicompost

Research Purpose

Vermicomposting separated swine solids is a way to reduce odor and pathogens in a product that can be used off site as a nutrient source and soil amendment. The solid separation system removes a portion of the nutrient and organic loads from the liquid waste stream prior to entering the lagoon system while the vermicomposting process stabilizes the nutrients and organics that are diverted from the lagoon, making it easier to find off-farm uses for the product.

The goal of this project was to demonstrate the usefulness of vermicompost in an agronomic setting. If crop growth can be enhanced without increasing nitrogen or phosphorus runoff pollution, then the vermicompost product can be evaluated further for economic efficiency. In the same manner, if nitrogen or phosphorus pollution can be decreased without reducing crop growth or quality, the product is also in a position for further evaluation.

Activities

We grew turnips in small plots with either 0, 10 or 20% vermicompost (by volume) mixed into the top 0.3 m of soil; nitrogen fertilizer was added to half of the plots. The experiment was repeated over four growing periods in two different soil types. Runoff from each plot was measured and analyzed for nutrients, solids, copper and zinc. Plant biomass was harvested at maturity. Both wet and dry weights were determined.

What We Have Learned

Plant biomass increased with the addition of vermicompost while the volume of runoff decreased. None of the pollution parameters were affected by inorganic fertilizer and only the mass of phosphorus and zinc in the runoff showed an effect of adding vermicompost.

The mass of zinc in runoff decreased but the mass of phosphorus increased because of the degradation activity of microorganisms and earthworms in the vermicomposting process would be expected to break down organic matter and release nutrients. Phosphorus, needed in smaller quantities than nitrogen, would be applied in excess and would end up in soil solution and runoff. Mass of nitrogen in run off was not affected by vermicompost addition, suggesting that the greater biomass growth did not come at the expense of additional nitrogen in runoff.

Examples of typical appearance of turnips with different amounts of vermicompost: 0%, 10%, 20%. Biological & Agricultural Engineering, NC State University.


Why is This Important?

This project demonstrated the usefulness of using vermicompost in a specific agronomic instance. Turnip growth was enhanced, runoff volume was reduced and pollutants in runoff were generally not greater than control plots of the same soil type. In phosphorus sensitive fields, any addition of manure based products must be used with caution.

For More Information

Contact john_classen@ncsu.edu or (919) 515-6800.

Classen, J.J., J.M. Rice, and R. Sherman, 2007. The Effects of Vermicompost on Field Turnips and Rainfall Runoff. Compost Science and Utilization 15(1): 34-39

By John Classen, Mark Rice and Rhonda Sherman, NC State University

This report was prepared for the 2008 annual meeting of the regional research committee, S-1032 “Animal Manure and Waste Utilization, Treatment and Nuisance Avoidance for a Sustainable Agriculture”. This report is not peer-reviewed and the author has sole responsibility for the content.

Research Summary: Evaluation of a Synthetic Tube Dewatering System for Animal Waste Pollution Control

Research Purpose

The objective of this field study was to evaluate the performance of a Geotube® dewatering system under field conditions by quantifying the mass removal efficiency of solids, nutrients, and metals from well-mixed dairy-lagoon slurry dewatered by this system.

Activities

A Geotube dewatering system was set-up to treat the lagoon slurry mix from the primary lagoon of a 2000-head lactating cow open-lot dairy (Fig. 1). After two synthetic tubes were filled to a height of approximately 1.5 m with the slurry mixture (Fig. 1), the pumping of effluent ceased and tubes were left to dewater for six months. During the pumping of slurry mix into tubes, both alum and polymer were added.

Slurry samples were collected before pumping it into the system (hereafter influent, IF), after mixing it with alum and polymer (hereafter IFCM), and effluent (hereafter EF) samples were collected as it ‘drained’ out of the system. Additionally, residual solids (RS) samples were also collected after both tubes had dewatered for six months. Samples were analyzed for solids, nutrients and metals following EPA and standard analytical methods.

Figure 1. Geotube® dewatering system: before (L) and after (R) filling with effluent.


Geotube dewatering system before filling Geotube dewatering system filled


What We Have Learned

This system effectively removed high percentage of total phosphorus (TP), 97% (Fig. 2) and soluble reactive phosphorus (SRP), 88% (Fig. 3), well above 50% reduction goal set by the phosphorus Total Maximum Daily Loads (TMDLs) for the North Bosque River in east central Texas.

Geotube® also successfully filtered solids (95%) from the lagoon slurry. This system was less effective in removing K (<50%) (Fig. 3), since K is highly soluble.

Geotube® dewatering system successfully reduced Ca, Mn, Fe, and Cu concentration by 91, 60, 99, and 99%, respectively (Fig. 3). However, this system was not highly effective in removing Na (<26%) from dairy lagoon slurry (IF).

Figure 2. Average total phosphorus (TP) concentration at different sampling date


Figure 3. Average soluble reactive phosphorus (SRP) concentration at different sampling date.


Figure 4. Average % reduction (Rd) and separation efficiency (SE) of effluent constituents using Geotube® dewatering system.


Why is This Important?

Water quality degradation due to phosphorus (P) contribution as a non-point source (NPS) pollutant from effluent and manure applied to waste application fields (WAFs) is a major concern in the Bosque River watershed in east central Texas. Geotube® dewatering system can be used as one of the best management pactices to minimize pollution from dairy effluent to be applied to field, but it must address the disposal of solids and costs.

For More Information

Contact mukhtar@tamu.edu or (979)458-1019. For more information, refer to the following publication.

Mukhtar, S., L. A. Lazenby, S. Rahman. 2007. Evaluation of a synthetic tube dewatering system for animal waste pollution control. Applied Engineering in Agriculture 23(5): 669-675

Authors: Saqib Mukhtar and Shafiqur Rahman, Texas A&M University

This report was prepared for the 2008 annual meeting of the regional research committee, S-1032 “Animal Manure and Waste Utilization, Treatment and Nuisance Avoidance for a Sustainable Agriculture”. This report is not peer-reviewed and the author has sole responsibility for the content.

Air Emission and Energy Usage Impacts of No Pit Fans in a Wean to Finish Deep Pit Pig Facility

What Is Being Measured?

The objectives of this research project are to monitor the indoor air quality of a deep-pit; wean-to-finish pig building over one pig-growth cycle (six months) by semi-continuously measuring concentrations of ammonia (NH3), hydrogen sulfide (H2S), carbon dioxide (CO2), methane (CH4), and volatile organic compounds (VOCs) and intermittently measuring particulate matter (PM10) and odor. The project will also monitor semi-continuous emissions of NH3, H2S, CO2, CH4, and VOCs plus intermittent sampling of odor emissions from the barn’s pit and wall exhaust streams over the six month growth period. Energy usage, both electrical and LP gas usage will be measured for both pit and non-pit ventilated rooms over the pig growth, along with pig performance (daily gain, feed efficiency, and death loss) between the rooms.

Current Activities

A cooperating pork producer is being located in southern Minnesota with a tentative starting date of July 1, 2008 for data collection.

Does the Use of Pit Fans Make a Difference in Air Emissions from Deep-Pit Pig Barns?

Air emissions from tunnel ventilated pig finishing barns have been monitored and partitioned between pit and wall fans during the past two years in Minnesota. The results showed that a disproportionate amount of hydrogen sulfide (H2S) and ammonia (NH3) emissions were emitted from the deep pit finishing barn through pit fans even though it was concluded that “pit” ventilation has little effect on the barn’s indoor air quality (figure 1). Thus producers might be able to reduce emissions of these hazardous gases and the associated odor of these gases simply by limiting or not using pit ventilation fans. Such a strategy would save electrical energy use since larger more efficient wall fans could replace the less efficient pit fans.

Figure 1. Hydrogen Sulfide Emissions from a 1200 head pig finishing barn with varying pit ventilation rates during a winter (January 26 to March 4, 2006) period. Contributed to eXtension CC2.5

Why is This Important?

Data collected from the deep pit facility will be used to determine the benefit of pit fans to indoor air quality in swine wean to finish buildings and what impact the use of pit fans has on energy usage and gas, odor, and particulate matter emissions from this stage of pork production buildings .

For More Information

Jacobson, L.D., B.P. Hetchler, and D.R. Schmidt. 2007. Sampling pit and wall emission for H2S, NH3, CO2, PM, & odor from deep-pit pig finishing facilities. Presented at the International Symposium on Air Quality and Waste Management for Agriculture. Sept 15-19, 2007. Broomfield, CO. St. Joseph, Mich.: ASABE

Authors: Larry D. Jacobson, David Schmidt and Brian Hetchler, University of Minnesota

This report was prepared for the 2008 annual meeting of the regional research committee, S-1032 “Animal Manure and Waste Utilization, Treatment and Nuisance Avoidance for a Sustainable Agriculture”. This report is not peer-reviewed and the author has sole responsibility for the content.

Odor Emissions and Chemical Analysis of Odorous Compounds from Animal Buildings

Why Study Odor Emissions from Animal Housing?

  • To determine odor emission characteristics by using common protocols and standardized olfactometry, from four mechanically-ventilated National Air Emissions Monitoring Study (NAEMS) sites, two dairy and two swine.
  • To develop a comprehensive chemical library that delineates the most significant odorants, and correlate this library with olfactometry results.
  • To disseminate information to stakeholders including producers, agencies, regulators, researchers, local government officials, consultants, and neighbors of animal operations.

Current Activities

Data is being collected from the four NAEMS sites (dairy sites in Wisconsin and Indiana and pig sites in Iowa and Indiana). Data collection is about ¼ completed (first 13 week cycle completed in April, 2008 and second cycle started in May, 2008) Raw data compilation in a U of MN website based spreadsheets for this first round is nearly completed. Olfactometry data is being done at the U of MN, Iowa State, and Purdue labs while GC-MS data is analyzed at West Texas State University and GC-MS-O data is processed at Iowa State University.

What We Have Learned

Sorbent tubes for both GC-MS data and GC-MS-O data have been successfully used to trap VOC in the emissions streams from the four barns without “breakouts” occurring. Approximately 15 to 20 compounds are being identified and with airflow data, actual emission data of these compounds should be able to be calculated.

instrumentation trailer making air quality measurements and air flow rates as part of the NAEMS study


Why is This Important?

This study is supplementing the National Air Emissions Monitoring Study (NAEMS) with comprehensive measurements of odor emissions. The NAEMS will help livestock and poultry producers comply with EPA regulations concerning regulated gases and particulate matter by monitoring these pollutants continuously for 24 months, in order to determine which types of farms are likely to emit threshold levels of contaminants under the current regulations. Although odor plagues the animal industry with the greatest overall challenge, it is not included in the NAEMS, because the EPA does not regulate it and therefore did not include it in the Air Consent Agreement.

This project adds odor emission measurements at four NAEMS sites during 12 months of the study. Both standard human sensory measurements (using dynamic forced-choice olfactometry), and a novel chemical analysis technique (GC-MS-O) for odorous compounds found in these emissions is being done in this study. The sensory and chemical methods would be correlated to gain both quantitative and qualitative understanding of odor emissions from animal buildings.

For More Information

Contact Larry D Jacobson, University of Minnesota, BBE Department, 1390 Eckles Ave, St. Paul, MN 55108. email: jacob007@umn.edu or phone 612-625-8288.

Larry D. Jacobson, Ipek Celen and Brian Hetchler, University of Minnesota

This report was prepared for the 2008 annual meeting of the regional research committee, S-1032 “Animal Manure and Waste Utilization, Treatment and Nuisance Avoidance for a Sustainable Agriculture”. This report is not peer-reviewed and the author has sole responsibility for the content.