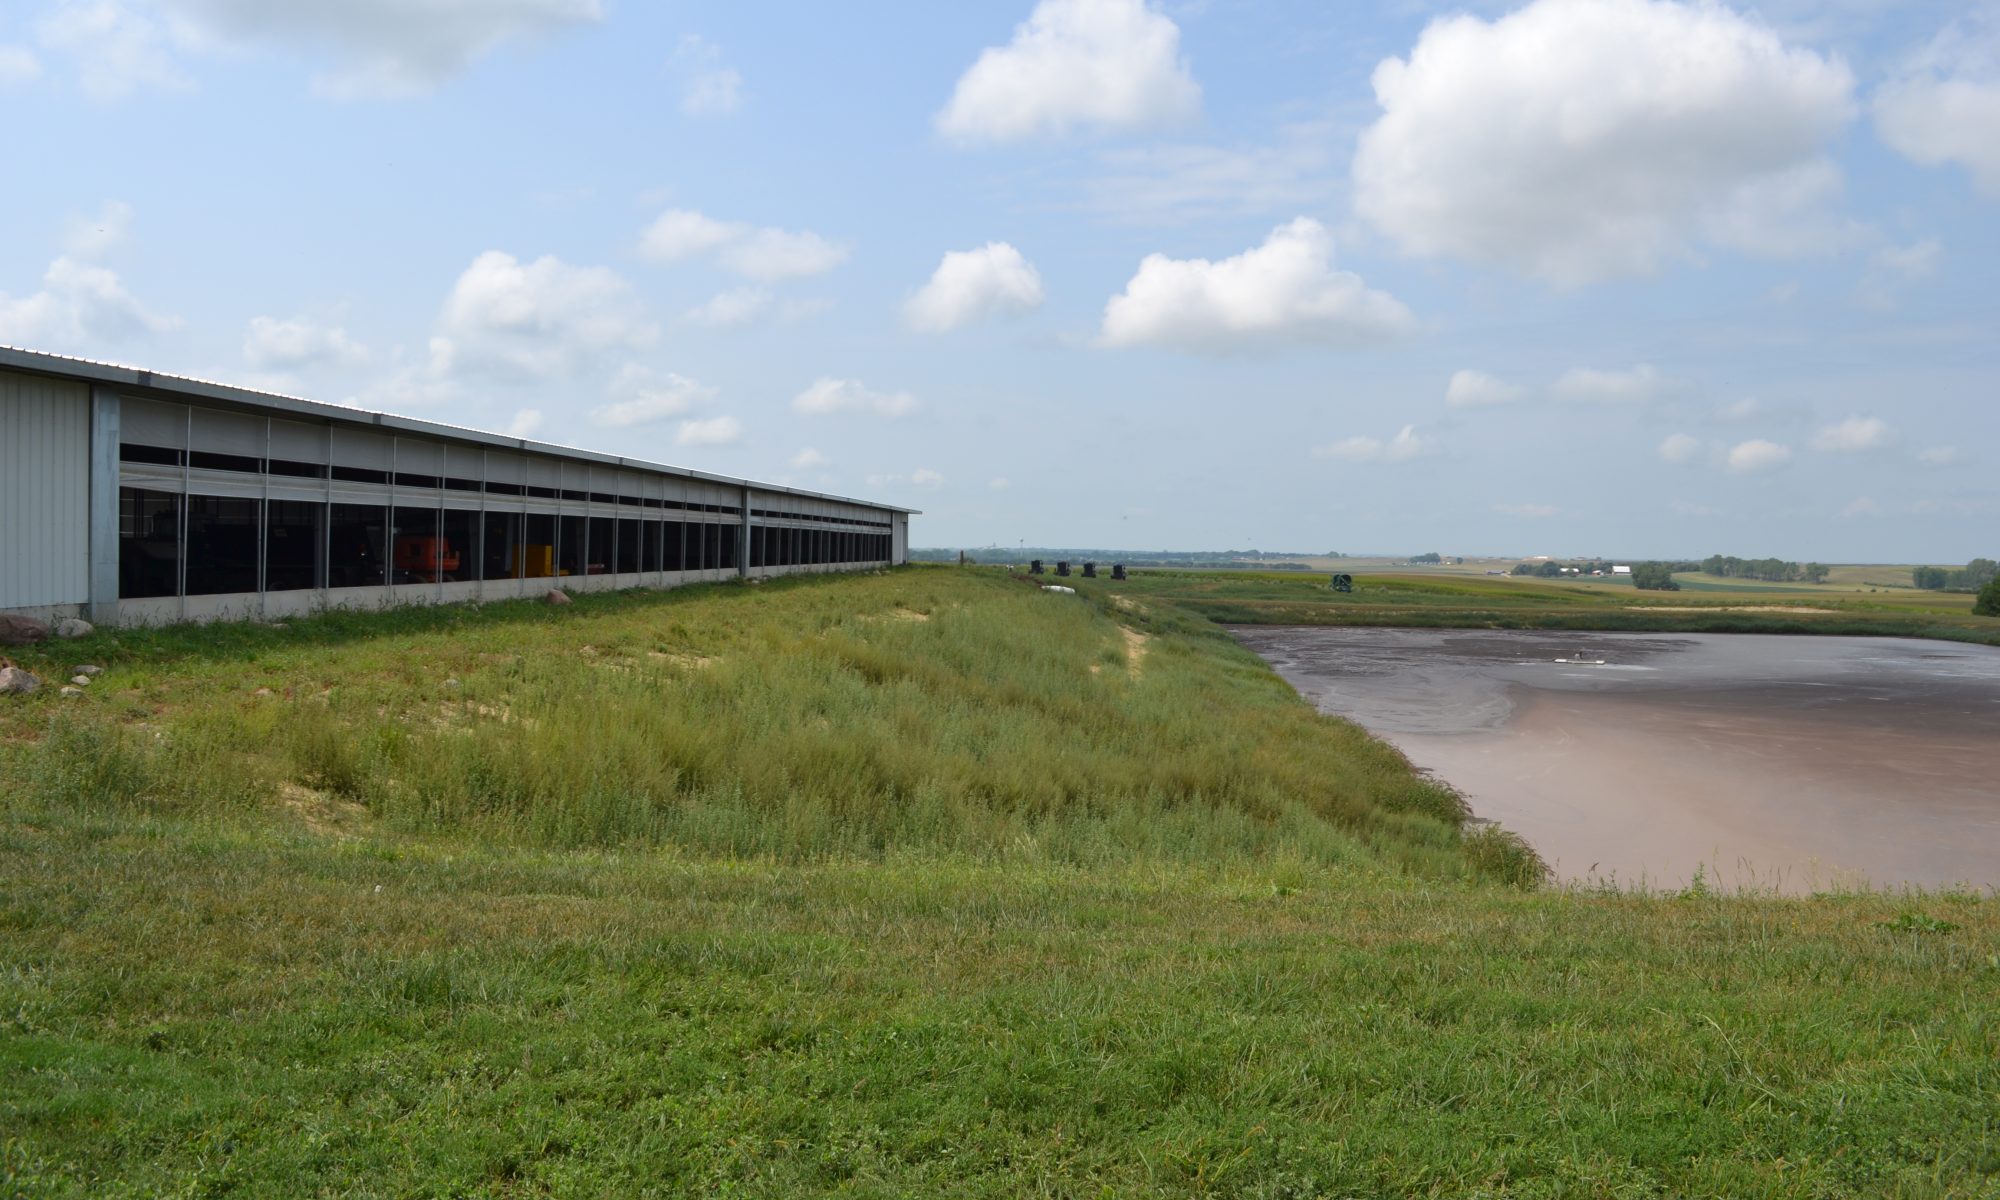

This session brings together perspectives from the United States and Europe. Together, panelists will discuss current practices, policies, and emerging innovations across regions, offering attendees a valuable opportunity to better understand global approaches to manure management while also learning more about the upcoming RAMIRAN conference, 2027, in Italy. This presentation was originally broadcast on May 22, 2026. Continue reading “Global Manure Trends: U.S. and European Perspectives from RAMIRAN 2025”
Nutrient Management Solutions for Small Farms
This webinar will examine practical nutrient management strategies tailored for small and diversified farms. Presenters will explore how organic operations can meet National Organic Program (NOP) requirements for manure, compost use, and soil fertility, followed by a look at the real‑world challenges facing small-acreage livestock properties. We will discuss additional considerations and solutions for effective nutrient stewardship on small farms. Whether you’re a producer, educator, conservation professional, or simply looking to improve land management on limited acreage, this session will offer actionable insights to support sustainable and environmentally sound practices. This presentation was originally broadcast on March 20, 2026. Continue reading “Nutrient Management Solutions for Small Farms”
A view from above – application of drones and remote sensing for air and water quality measures around livestock farms
Aerial photos of farms and farming practices are becoming easier to find and collect. But drones and satellites can provide more than pretty pictures. In this webinar, the three speakers will share applications of drones and remote sensing for air and water quality measures around livestock farms. Dirk Charlson will share his simple approach to collecting drone imagery, and the range of opportunities for analyzing images and mapping practices. Nesli Akdeniz has collected air quality measures in pasture systems with drones. Finally, Becca Muenich has used remote sensing to examine land application practices. While it may seem like these applications are flying by faster than we can see, the speakers will help ground us with their experience. This presentation was originally broadcast on December 12, 2025. Continue reading “A view from above – application of drones and remote sensing for air and water quality measures around livestock farms”
A Systems-Approach to Understanding the Nutrient Cycle Across the Pork Ecosystem
This webinar explores how an integrated, systems-based understanding of the nutrient cycle can drive more sustainable pork production. By examining both feed utilization within the animal and nutrient management beyond the barn, the discussion connects nutritional strategies and manure treatment technologies as key components of the pork ecosystem. Presenters will highlight advances in precision feeding, enzyme use, and feed processing that improve nutrient efficiency and reduce environmental impacts, as well as research optimizing zinc inclusion to balance performance and sustainability. This presentation was originally broadcast on November 14, 2025. Continue reading “A Systems-Approach to Understanding the Nutrient Cycle Across the Pork Ecosystem”
Can Cover Crops Help Nutrient Management in Idaho Dairy Systems?
Purpose
This research aims to determine the effectiveness of cover crops (CCs) to improving nutrient uptake and soil health in a corn silage-cover crop system. Nutrient accumulation in soils from years of dairy manure or compost applications has increased the level of soil nutrients, creating environmental concerns. The study tests the feasibility and performance of different management strategies using CCs to mine nutrients from agricultural soils and reduce the negative environmental impact of manure or compost application.
What Did We Do?
In one study, two CC mixes (low height or tall) were inter-seeded (dual cropping) with corn silage at two different dates, near the corn planting date and later in the vegetative development. Two post-harvesting management strategies were used by either keeping the CC during the next season or terminating the CC in the spring, before the next corn silage planting. The control had no CC, only the corn silage. In an additional study, a fall CC mix was planted after corn silage harvest (double cropping). Different management strategies were used, including harvesting the CC, simulated grazing, green manuring the CC, and control with no CC. Both studies received the same amount of dairy manure compost annually, plus synthetic fertilizers. All other parameters, including corn planting and harvesting times and irrigation, were the same for both studies and all treatments. Weed management was adjusted using mowing as a method on plots with CCs, and herbicide on plots with no CCs.
What Have We Learned?
This study will continue for two more years. The first year of data collection was 2021. The inter-seeding (dual cropping) study results show very few significant differences in soil analysis comparing CC treatments. There were, however, statistically significant differences between some treatments and the control. This situation indicates that having an actively growing CC influences the soil nutrients and nutrient uptake compared to not having any CC when growing corn silage. The short CC mixes, either planted near the corn planting date or later during the corn vegetative development, tend to have the highest increase in soil OM, especially under reduced or no-till conditions, and reducing soil nitrates, ammonium, and total nitrogen. This can be explained by the better growth of the low mixes that continued growing after the corn silage harvest, compared with the high mixes that were harvested with the corn and rarely regrew after harvesting. CC establishment and growth was a challenge each year due to the corn silage shade. The low CC mix was the only one that was not terminated and continued to grow until after planting the corn silage the following spring. This treatment has proven challenging due to the aggressive CC regrowth and low growth of the corn with the CC competition, even when using strip tillage.
In most years, the previous season CC needed to be terminated to allow for the corn to grow and to reduce weed pressure before replanting the CC again. Soil phosphorous (P) did not show significant differences across treatments and control on the surface level. Phosphorus levels kept increasing during the study, indicating that the application rate far exceeded the crop uptake. In the case of nitrogen, even when CC showed increased nitrogen (N) uptake for all N species, nitrates have accumulated in soils, especially at lower depths, indicating leaching processes in all treatments and much more in the control (Figure 1). Cover crops can uptake some of the excess nitrogen, especially on the soil top layer, reducing the impact of N leaching (Figure 2). Under nutrient overapplication conditions, CCs that have not developed to their full potential cannot handle all the nutrients’ load, thus leaching can still occur. Overall, inter-seeding CC may have a positive impact on nutrient management when managed properly. This positive effect may be complex to quantify when comparing different CC practices with lower-than-ideal CC growth and under nutrient-overapplication conditions.
The second trial with double cropping with a single fall CC mix after harvesting the corn silage was more successful in most years in growing much more CC mass than the inter-seeding CC. The greatest differential was present only for a short period in spring before harvesting or terminating the CC for corn planting. Weed management during the corn growing season was simplified in the double (fall) cropping system. Results on the impact of fall CC and the different treatments compared to the control have not been fully analyzed.
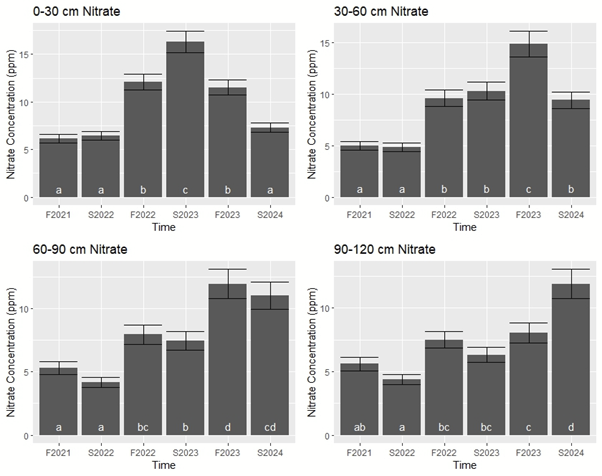
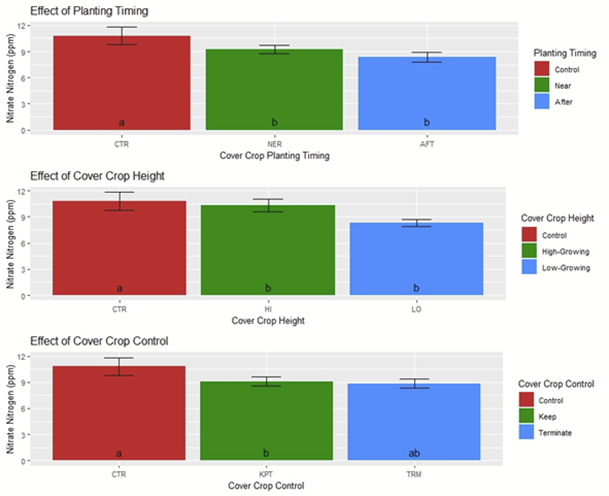
Figure 2. Estimated marginal means of soil nitrate at 0-30 cm depth by CC planting timing, CC height, and CC vs control in an inter-seeding corn silage-cove crop system receiving annual applications of dairy compost and synthetic fertilizer.
Future Plans
There is additional data to analyze in both studies, including other soil chemical parameters, corn silage and CC yields, and feed quality. In the last year, moisture sensors were installed in some plots, measuring and recording soil moisture and temperature at different depths up to three feet. This moisture data at various depths could be correlated with nitrate values and other soil chemical parameters data to determine nutrient leaching, irrigation efficiency, and what role CC may play. Two additional seasons of data will be included to the dataset.
Authors
Presenting & corresponding author
Mario E. de Haro-Martí, Professor and Extension Educator, University of Idaho, mdeharo@uidaho.edu
Additional authors
Linda Schott, Assistant Professor, Extension Specialist, University of Idaho
Miguel Mena, MS Graduate Student, SWS Department, University of Idaho
Steven Hines, Professor and Extension Educator, University of Idaho
Anthony S. Simerlink, Assistant Professor and Extension Educator, University of Idaho
Clarence Robison, Research Support Scientist, University of Idaho
Additional Information
Idaho Sustainable Agriculture Initiative for Dairy website: https://www.uidahoisaid.com/
Acknowledgements
The research team thanks the USDA-ARS Kimberly, ID personnel for their support with machinery and assistance with this project.
Funding for this project was provided by a USDA-NIFA Sustainable Agriculture Systems (SAS) grant #2020-69012-31871.
The authors are solely responsible for the content of these proceedings. The technical information does not necessarily reflect the official position of the sponsoring agencies or institutions represented by planning committee members, and inclusion and distribution herein does not constitute an endorsement of views expressed by the same. Printed materials included herein are not refereed publications. Citations should appear as follows. EXAMPLE: Authors. 2025. Title of presentation. Waste to Worth. Boise, ID. April 7-11, 2025. URL of this page. Accessed on: today’s date.
Using an interactive map exercise to help producers better manage their manure
Purpose
Time and time again, experience has taught us that many people learn by doing, not just from listening to presentations. The Nebraska Animal Manure Management Team has worked hard over the last six years to develop and expand what is now referred to as the Interactive Nutrient Management Decision-Making Exercise. This workshop will serve as a train-the-trainer event where attendees will:
-
- Discover how the exercise began and what it has grown to include
- Get familiar with the pieces and parts by helping set up the activity
- Experience a couple of the activities as participants
- Hear from others that have adapted the exercise and their experiences
- Brainstorm how the exercise can be used elsewhere or for other concepts
What Did We Do?
The Interactive Nutrient Management Decision-Making Exercise (mapping exercise) was developed by the Animal Manure Management Team at the University of Nebraska-Lincoln and University of Minnesota to engage participants during Manure Application Trainings. In Nebraska, these trainings previously relied heavily on PowerPoint and recorded presentations, but with many people being hands-on learners, an interactive exercise was proposed. In 2020, the original 6 activities were used for the afternoon portion, and it has since grown to the exercise it is today that is incorporated throughout the whole-day training.
It has been used not only for livestock producers but also crop producers. Parts of it have been modified to fit into workshops at conferences and, most recently, high school classrooms. Current expansion topics include spray drift to avoid sensitive areas and nitrogen management from all sources.
What Have We Learned?
Because many livestock producers in Nebraska are required to attend Land Application Training events every five years to maintain their Livestock Waste Control Facility permit, the winter 2024-2025 programming season for the Nebraska manure team offered an opportunity to ask participants how their operations have changed since the first time they had seen the Interactive Nutrient Management Decision-Making Exercise (in 2020). The team asked 3 questions specific to the exercise and changes on their operations and found the following results.
In general, participants are considering the topics taught during training more now than they were five years ago. The figure below indicates that 48% consider weather forecasts to decrease odor risk more or much more than they did prior to experiencing the Interactive Nutrient Management Decision-Making Exercise. Forty eight percent and 59% consider water quality and soil health impacts from manure more than five years ago, subsequently. While many participants already factored in transportation cost compared to nutrient value captured for a field, 59% reported that they consider it more or much more than they did, and 55% reported that they now considered the value of manure nutrients based on a field’s soil test more or much more.

We also asked participants to share with us how useful they felt the changes and expanded activities of the Interactive Nutrient Management Decision-Making Exercise were. All participants felt that the changes and expansion were useful with 52% indicating that they were very or extremely useful.

We also asked, “How do you expect your experience with the newer activities of the interactive nutrient management decision-making exercise will change your operation in the future?” and, among others, we received the following responses:
-
- “[we will] take more consideration to neighbors near application”
- “[we will make] better $ management decision[s] on manure application site[s]”
- “[the activity] makes us want to plan out better to get better results”
Future Plans
With so much success using this teaching tool, we would like to expand it to teach topics other than nutrient management. The Soil Health Nexus, a soil health workgroup in the north central region of the US, is in the process of developing an adaptation of this tool that will teach participants about the impacts of certain practices on soil health. Currently, progress has been made on activities focusing on tillage and the use of cover crops. Other planned activities include a focus on crop rotation and the use of the Soil Health Matrix, a tool developed by the Soil Health Nexus.
The Nebraska Animal Manure Management team, as part of a different grant, also has plans to create some activities focused on integrating livestock into cropping systems.
We also support using the base model of this exercise and adapting it for other practices and audiences outside of Nebraska.
Authors
Presenting & Corresponding author
Leslie Johnson, Animal Manure Management Extension Educator, University of Nebraska – Lincoln, leslie.johnson@unl.edu
Additional author
Amy Millmier Schmidt, Professor and Livestock Bioenvironmental Engineering Specialist, University of Nebraska-Lincoln;
Additional Information
Downloadable Curriculum: https://lpelc.org/interactive-nutrient-management-decision-making-exercise-curricula/
Acknowledgements
We would like to acknowledge all other contributors to the curriculum in the past including:
-
- Larry Howard, Rick Koelsch, Agnes Kurtzhals, Aaron Nygren, Agustin Olivio, Amber Patterson, Katie Pekarek, Amy Schmidt, Mike Sindelar, and Todd Whitney (University of Nebraska, Lincoln)
- Daryl Andersen, Tyler Benal, Will Brueggemann, Russ Oakland, and Bret Schomer (Lower Platte North NRD)
- Blythe McAfee and Tiffany O’Neill (Nebraska Department of Environment and Energy)
- Andy Scholting (Nutrient Advisors)
- Marie Krausnick, Dan Leininger (Upper Big Blue NRD)
- Chryseis Modderman (University of Minnesota)
- Nutrient Advisors
- Settje Agri Services Eng.
- Ward Laboratories Inc.
The authors are solely responsible for the content of these proceedings. The technical information does not necessarily reflect the official position of the sponsoring agencies or institutions represented by planning committee members, and inclusion and distribution herein does not constitute an endorsement of views expressed by the same. Printed materials included herein are not refereed publications. Citations should appear as follows. EXAMPLE: Authors. 2025. Title of presentation. Waste to Worth. Boise, ID. April 7-11, 2025. URL of this page. Accessed on: today’s date.
Manure nutrient trends from 2012-2022
Purpose
Livestock manure nutrients can be variable depending on animal species, age, diet, management, housing, climate, and manure storage and handling. Thousands of samples are analyzed every year by agricultural laboratories across the United States (U.S.). While many published manure characteristics are two decades old, this study provides an updated glimpse into more recent manure data from thousands of samples across the country and reviewed possible trends from 2012-2022 by U.S. regions for common animal categories.
What Did We Do?
We collected manure nutrient data from participating U.S. laboratories and this data was aggregated by researchers at the University of Minnesota into ManureDB, a manure nutrient test database. By February 2024, ManureDB included over 490,000 samples from across the U.S. With ManureDB, data was filtered for the time period from 2012-2022 and common U.S. animal manure categories (solid beef, liquid beef, solid dairy, liquid dairy, solid chicken-broiler, solid chicken-layer, solid turkey, and liquid swine manure) to update nutrient summary statistics for total nitrogen (TN), ammonium-N (NH4-N), phosphorus (P2O5), and potassium (K2O) using the approximately 325,000 samples. Samples were divided by designating samples with <10% total solids as liquid manure and samples with >10% total solids as solid manure. Data was also analyzed to assess regional nutrient comparisons and trends for regions with sufficient samples.
What Have We Learned?
Regional differences impacted nutrient concentrations in solid and liquid manures. When comparing regions with at least 500 samples per animal manure category across 2012-2022 we found significant differences in nutrient concentrations in 66% of the individual year comparisons for solid manures and 91% of comparisons for liquid manures for all four analytes.
Between 2012 and 2022, significant increasing or decreasing nutrient (TN, NH4-N, P2O5, K2O) trends were evident in 25% of solid samples and 18% of liquid samples. The only significant trend for solid beef manure was a decreasing trend in the SE region for NH4-N. Both the solid chicken-broiler SE and NE regions had significant decreases in NH4-N, and only the SE had an increasing trend for K2O. The SE region for solid chicken-layer had decreasing trends for NH4-N, P2O5, and K2O. For solid dairy manure, the MW region only had a decreasing trend for P2O5, while the NE region had decreasing trends for N and NH4-N. Solid turkey manure only had significant trends for P2O5, with the MW increasing and the SE decreasing. Liquid beef manure had no significant trends. For liquid dairy manure, only the NE region had significant decreasing trends for all four nutrients. For liquid swine manure, only the SE region had significant increasing trends for NH4-N.
Standardizing nomenclature and increasing manure sample details, especially with animal life stage and manure storage information on manure sample submittal forms, will further improve ManureDB’s usefulness.
Future Plans
We continue to expand and refine ManureDB by adding data each year, additional labs, making the website more user-friendly, and enhancing data quality control. We archived the first set of data with Ag Data Commons in 2024 and plan to do that annually. We also plan to publish several papers regarding the development of the database and analysis of the manure nutrient data.
Authors
Presenting & corresponding author
Nancy L. Bohl Bormann, Researcher, University of Minnesota, nlbb@umn.edu
Additional authors
Melissa L. Wilson, Associate Professor, University of Minnesota
Erin L. Cortus, Associate Professor and Extension Engineer, University of Minnesota
Additional Information
-
- ManureDB website http://manuredb.umn.edu/
- R Code, Data, and Output Supporting: Nutrient Data from U.S. Manure Systems https://doi.org/10.13020/sce9-s034
- Lab websites:
- LPELC Webinar “Upcoming Models & Tools to Improve Manure Management: ManureDB” https://www.youtube.com/watch?v=UwNED9LbtCU
Acknowledgements
ManureDB is supported through USDA NIFA Award 2020-67021-32465 and Cooperative Ecosystem Studies Unit program [grant no. NR253A750008C001] from the U.S. Department of Agriculture — Natural Resources Conservation Service.
The authors are solely responsible for the content of these proceedings. The technical information does not necessarily reflect the official position of the sponsoring agencies or institutions represented by planning committee members, and inclusion and distribution herein does not constitute an endorsement of views expressed by the same. Printed materials included herein are not refereed publications. Citations should appear as follows. EXAMPLE: Authors. 2025. Title of presentation. Waste to Worth. Boise, ID. April 7–11, 2025. URL of this page. Accessed on: today’s date.
Ammonia Loss Following Application of Swine Manure
Purpose
The amount of nitrogen lost to the air as ammonia following the application of manure is important for two reasons. From the farmer’s point of view, the loss of nitrogen as ammonia gas represents a loss of fertilizer that could have contributed to the production of a crop. From an environmental point of view, ammonia lost from a field to the atmosphere is a source of air pollution that can combine with sulfites and nitrates in the atmosphere to form extremely fine particulate matter (PM2.5) that can have harmful effects on human health and can contribute to water pollution when deposited into surface water by rainfall. Land application of animal manure is one of many sources of ammonia emissions that also include municipal and industrial waste treatment, use and manufacture of fertilizers, combustion of fossil fuel, coke plants and refrigeration (USEPA, 1995).
Animal manure can be used as a fertilizer substitute. However, the types of nitrogen in manure are more complicated than those found in most common chemical fertilizers. Nitrogen can be present in manure as ammonium-N, ammonia-N, organic-N, and nitrate-N. Not all the nitrogen in manure is immediately available for plant use. Most animal manure contains very little nitrate-N and as a result it is typically not measured. However, manure that receives aerobic treatment, i.e., composting or aeration, should be analyzed for nitrate-N since it is a valuable form of nitrogen that is the same as contained in one of the most common types of fertilizer – ammonium nitrate.
Most laboratories measure the total ammoniacal nitrogen content (TAN) of animal manure, which includes ammonium-N and ammonia-N (TAN = NH4+-N + NH3 -N). The amount of TAN that is in the ammonia form depends greatly on the pH of the manure. At a pH of 6.5 none of the TAN is in the ammonia form – it is all ammonium-N which is a great form of plant fertilizer. At a high pH, such as, 9.5, 65% of the TAN is in the ammonia form. Most animal manures have a pH in the range of 8 to 8.5 and about 10% most of the TAN is ammonia-N and can be lost to the air. As a result, TAN is often labeled as ammonium-N on manure analysis reports.
A key aspect of using animal manure as a fertilizer substitute is to make a good estimate of the fraction of the total nitrogen contained in the animal manure that can be used to grow a plant. This portion of the nitrogen is called the plant available nitrogen (PAN) and can be estimated using the following equation:
| PAN =mf Organic-N + Af TAN + Nitrate-N. | (1) |
Most of the nitrogen in untreated slurry and solid animal manure is organic nitrogen (organic-N) that must be mineralized in the soil to become available to plants as ammonium-N. The fraction of the organic-N that will be mineralized during the growing season is represented in equation 1 as the mineralization factor, mf. The value of the mineralization factor varies depending on animal species, the amount of treatment, as well as soil pH, moisture, and temperature. The values of mf recommended are 0.70 for lagoon water and 0.50 for swine slurry (Chastain, 2006).
The fraction of TAN in manure that will be available to the plant is represented by the ammonium-N availability factor, Af. The ammonium-N availability factor (a decimal) is determined from the fraction of TAN lost to the air as ammonia-N using the following formula:
| Af =1-( AL/ 100). | (2) |
The amount of ammonia-N lost following application varies with the method of application, the extent and timing of incorporation in the soil by disking as well as the pH of the manure, the pH that the manure attains following application, and the air temperature. Most extension publications provide recommended values for estimating ammonia-N losses. For example, Clemson Cooperative Extension (CAMM, 2005) recommends use of an ammonia loss (AL) of 50% for broadcast of manure without incorporation. This would mean that a value of 0.5 is used for ammonium-N availability factor (Af) in equation 1. If the manure is incorporated into the soil within one day the recommended value for AL is 20% giving an Af value of 0.80.
The amount of nitrate-N contained in animal manure is often so small that it is not measured. However, manure that is exposed to enough air or that is treated aerobically will have a significant amount and measurement of the nitrate-N content is recommended. All the nitrate-N contained in manure is 100% plant available.
Various studies and reviews (Chastain, et al., 2001; Montes, 2002; Montes and Chastain, 2003; Chastain, 2006) have indicated that the amount of ammonia lost following application of animal manure varies much more than indicated by most extension recommendations (e.g., CAMM, 2005). The result of large differences between recommended estimates and actual values is either substantial over or under estimation of the amount of ammonia emissions to the air as well as over or underestimation of the amount of nitrogen that will be available for the plant. The objective of this paper is to provide practical recommendations for the ammonium-N availability factors for swine manure based on the application method, total solids content, and the time between broadcast and incorporation.
What Did We Do?
The data and the correlations used to develop the recommendations in this paper were provided by Montes (2002) and Chastain (2006). The effect of the application method on ammonia-N loss was estimated using the following equation:
| AL =fA ALBC. | (3) |
The application factors, fA, that correspond to an application method are given in Table 1 and ALBC was the ammonia loss for broadcast manure. The value of the ammonium-N availability factor, Af, for each application method was calculated using the definition given previously in equation 2.
How fast ammonia is lost following broadcast application of manure was determined by Montes (2002). The results indicated that ammonia-N loss following irrigation of lagoon water occurred too quickly to consider incorporation by disking. Values for broadcast and incorporation for slurry manure are given in Table 1. The results indicated that incorporation must follow broadcast of slurry manure within 8 hours if it is desired to reduce ammonia-N loss by 50% (fA=0.50).
| Table 1. Application method factors to describe the reduction in ammonia loss as compared to broadcast application of manure. (Values based on reviews of the literature by Chastain et al., 2001 and Montes, 2002). | ||
| Application Method | fA | What type of manure can use this method? |
| Broadcast without incorporation | 1.0 | All |
| Broadcast followed by incorporation within 4 hoursA | 0.29 | Slurry |
| Broadcast followed by incorporation within 6 hoursA | 0.40 | Slurry |
| Broadcast followed by incorporation within 8 hoursA | 0.50 | Slurry |
| Broadcast followed by incorporation within 12 hoursA | 0.64 | Slurry |
| Band spreading (drop or trailing hose) | 0.50 | Liquid and Slurry |
| Band spreading with immediate shallow soil cover | 0.12 | Liquid and Slurry |
| Shallow injection (2 to inches below soil surface) | 0.10 | Liquid and Slurry |
| Deep injection (4 to 6 inches below soil surface) | 0.08 | Liquid and Slurry |
| AfA calculated using K = 0.086 h-1 (Chastain, 2006) |
A few studies indicated that application of manure to bare soil versus cut hay, or plant residue reduced ammonia-N loss following broadcast by 10% to 20% (see Montes, 2002 and Chastain, 2006). However, it was decided that there was not sufficient data to generalize the result for practical use.
What Have We Learned?
The model was applied to as wide a range of swine manure application situations as possible. The results were tabulated as ammonium-N availability factors, Af, that may be used in the PAN equation (equation 1) along with an estimate for the mineralization factor.
Variation in Ammonium-N Availability by Application Method
The impact of application method on the ammonium-N availability factor for swine manure is shown in Table 2. Application method had the least impact on irrigation of surface water from an anaerobic treatment lagoon. The value of Af was 0.98 for irrigated swine lagoon water. This corresponded to an ammonia-N loss of 2% (AL = (1-Af) x 100). The amount of ammonia-N lost was low since more than 0.25 inches of lagoon water was applied, and most of the ammonium-N was washed into the soil. However, the ammonium-N availability factors for broadcast of manure decreased sharply as the total solids content of swine manure increased. This corresponded to ammonia-N loss ranging from 8% for liquid manure (TS = 1% to 4%) to 58% for thick slurry (TS = 15% to 20%). It can also be seen in the table that all the ammonium-N conserving application methods increased in effectiveness as the TS content of swine manure increased.
| Table 2. Variation in ammonium nitrogen availability factors, Af, for swine manure and treatment lagoon surface water based on application method. (AL = (1 – Af) x 100) | ||||||
| Description | Broadcast or Large Bore Irrigation | Broadcast followed by incorporation within 6 hours | Band Spreading | Band Spreading with Shallow Cover | Shallow Injection | Deep Injection |
| Lagoon Surface WaterA | 0.98 | NA | 0.99 | 1.00 | 1.00 | 1.00 |
| Liquid or SlurryB | ||||||
| TS=1% to 4% | 0.92 | 0.97 | 0.96 | 0.99 | 0.99 | 0.99 |
| TS=5% to 6% | 0.82 | 0.93 | 0.91 | 0.98 | 0.98 | 0.99 |
| TS=7% to 8% | 0.75 | 0.90 | 0.88 | 0.97 | 0.98 | 0.98 |
| TS=9% to 12% | 0.66 | 0.86 | 0.83 | 0.96 | 0.97 | 0.97 |
| TS=13% to 14% | 0.56 | 0.82 | 0.78 | 0.95 | 0.96 | 0.96 |
| TS=15% to 20% | 0.42 | 0.77 | 0.71 | 0.93 | 0.94 | 0.95 |
| AALBC = 14.30 TS – 4.75, R2 = 0.791, TS = 0.5%, Chastain (2006) | ||||||
| BALBC = 23.284 TS, R2 = 0.875, Chastain (2006) | ||||||
Comparison of the Use of New Ammonium-N Availability Factors and Current Clemson Extension Recommendations for Broadcast Application of Swine Manure
Selection of the ammonium-N availability factor (Af) and mineralization factor (mf) for a manure type and application method has a large effect on the accuracy of the estimate of nitrogen that can be used to fertilize a crop as well as the estimate of ammonia-N lost to the air. The PAN estimate determines the amount of manure applied per acre (gal/ac) and the amount of P2O5 and K2O that are applied (lb/ac). The impact of using constant values of Af and mf that are different from values that more closely match the data was studied by comparing the results for spreading lagoon water (TS = 0.5%) and slurry (TS = 7.5%) to meet a target application rate of 100 lb PAN/ac. The results are provided in Table 3. The impact of settling and biological treatment in the lagoon was indicated by the low TS content (TS=0.5%) and the fact that the lagoon water contained two pounds of TAN for every pound of organic-N. Swine slurry (TS = 7.5%) contained 1.2 pounds of TAN per pound of organic-N.
Comparison of the estimates using Clemson Extensions current recommendations with the results provided in this paper led to the following observations.
-
- Using the new Af and mf values that varied by manure type (lagoon water vs slurry) provided higher PAN estimates than the Clemson Extension recommendations.
- The higher PAN estimates resulted in reductions in the amount of manure needed to provide 100 lb PAN/ac.
- The amount of ammonia-N lost per acre per 100 lb PAN applied was much lower using the new factors for estimating PAN as compared to using Clemson Extension values for lagoon water and swine slurry. Using Clemson Extension values over-estimated the ammonia-N loss/ac by 133% to 1133%.
- The inaccuracies in PAN estimates for lagoon water and slurry manure also impacted plant nutrient application rates. Using the PAN estimates based on Clemson Extension recommendations to determine manure application rates resulted in over application of nitrogen by 17% to 21%. Similar over-applications were observed for P2O5 and K2 Therefore, better estimates of PAN can help to reduce excessive applications of phosphorous and provide better estimates of potash (K2O) application rates.
- Comparison of the estimates of the ammonia-N lost per acre following broadcast of manure for the examples shown in Table 4 demonstrates the need to consider using values of Af and mf that more closely agree with the available data.
- It must be emphasized that slurry manure with a higher TS content than 7.5% and heavily bedded manure were not included in the examples in this paper. The ammonia-N loss values will be higher and must be calculated using the Af values provided in this paper along with the corresponding manure analysis to yield valid conclusions.
Impact of Selected Ammonium-N Conserving Application Methods on Ammonia-N Loss per Acre, and P2O5 Application Rate
The impact of application method on the estimates of PAN, ammonia-N loss, and phosphorous application rates was calculated for swine slurry using the tabulated values for the ammonium-N availability factors given in Table 2. Lagoon water was not included because irrigation is the most common and cost-effective method of application, and the amount of ammonia-N lost to the air was the least. The application methods that were compared were broadcast, broadcast followed by incorporation within 6 hours, band spreading, band spreading with shallow soil cover, and shallow injection. Results for deep injection were not included because the improvements were very small compared with shallow injection (see Table 2). Furthermore, the horsepower and fuel costs of deep injection are higher than for shallow injection. The results are given in Table 4.
The results indicated that broadcast with incorporation within 6 hours provided a reduction in ammonia-N loss per acre of 65% and a reduction in the P2O5 application rate of 11%. Band spreading provided almost the same benefits (57% reduction in ammonia-N loss and 10% reduction in lb P2O5/ac) but would be achieved with only one pass across a field. Adding a method to immediately cover a band of manure with soil provided reductions in ammonia-N loss of 90% and reduction of the P2O5 application rate by 16%. Shallow injection provided a modest improvement in ammonia-N emissions (93%) as compared to band spreading with shallow cover. Shallow injection also provided about the same benefit in reduction of phosphorous application rate as band spreading with shallow cover.
| Table 3. Comparison of land application rate and ammonia-N loss estimates using tabulated model results and current Clemson University Extension recommendations for broadcast application of swine lagoon surface water and slurry manure. Target nutrient application rate = 100 lb PAN/ac. | ||
| Swine | ||
| Lagoon Water | Slurry | |
| TS, % | 0.5 | 7.5 |
| TAN, lb/1000 gal | 4.3 | 23.0 |
| Org-N, lb/1000 gal | 2.0 | 19.0 |
| P2O5, lb/1000 gal | 3.6 | 33.0 |
| K2O, lb/1000 gal | 7.9 | 28.0 |
| Land Application Rates and Ammonia-N Loss Estimates Using Clemson Extension Recommendations | ||
| Mineralization factor, mf | 0.60 | 0.60 |
| Ammonium-N availability factor, Af | 0.80 | 0.50 |
| PAN estimate, lb PAN/1000 gal | 4.6 | 22.9 |
| Application rate to provide 100 lb PAN/ac, gal/ac | 21,552 | 4,367 |
| Resulting application rate for P2O5, lb/ac | 78 | 144 |
| Resulting application rate for K2O | 170 | 122 |
| Ammonia-N Loss, lb per acre / 100 lb PAN | 18.5 | 50.2 |
| Land Application Rates and Ammonia-N Loss Estimates Using New Recommendations | ||
| Mineralization factor, mf | 0.70 | 0.50 |
| Ammonium-N availability factor, Af | 0.98 | 0.75 |
| PAN estimate, lb PAN/1000 gal | 5.6 | 26.8 |
| Application rate to provide 100 lb PAN/ac, gal/ac | 17,813 | 3,738 |
| Resulting application rate for P2O5, lb/ac | 64 | 123 |
| Resulting application rate for K2O | 141 | 105 |
| Ammonia-N Loss, lb per acre / 100 lb PAN | 1.5 | 21.5 |
| Key Impacts of Inaccurate Estimates of Af, and PAN | ||
| Over-estimation of Ammonia-N Loss/ac | 1133% | 133% |
| Actual PAN Application Rates Using Clemson Extension Recommendations to Determine Manure Application Rate, lb PAN/ac and percent over-application of PAN (%) | 121 (21%) |
117 (17%) |
| Difference in Application of P2O5, lb/ac (%) | 14 (22%) |
21 (17%) |
| Difference in Application of K2O, lb/ac (%) | 29 (21%) |
17 (14%) |
| Table 4. Impact of Application Method on Ammonia-N Loss and P2O5 Application Rate for Swine Slurry. The total solids and plant nutrient contents were given previously in Table 3 and the mineralization factor was 0.50 for all application methods. | |
| Swine Slurry, TS = 7.5% |
|
| Broadcast – no incorporation | |
| Mineralization factor, mf | 0.50 |
| Ammonium-N availability factor, Af | 0.75 |
| PAN estimate, lb PAN/1000 gal | 26.8 |
| Application rate to provide 100 lb PAN/ac, gal /ac | 3,738 |
| Resulting application rate for P2O5, lb/ac | 123 |
| Ammonia-N Loss, lb per acre / 100 lb PAN | 21.5 |
| Broadcast – incorporation within 6 hours | |
| Ammonium-N availability factor, Af | 0.90 |
| PAN estimate, lb PAN/1000 gal | 30.2 |
| Application rate to provide 100 lb PAN/ac, gal /ac | 3,311 |
| Resulting application rate for P2O5, lb/ac | 109 |
| Ammonia-N Loss, lb per acre / 100 lb PAN | 7.6 |
| Reduction in Ammonia-N loss Compared to Broadcast | 65% |
| Reduction in P2O5 Application Rate | 11% |
| Band Spreading |
|
| Ammonium-N availability factor, Af | 0.88 |
| PAN estimate, lb PAN/1000 gal | 29.7 |
| Application rate to provide 100 lb PAN/ac, gal /ac | 3,362 |
| Resulting application rate for P2O5, lb/ac | 111 |
| Ammonia-N Loss, lb per acre / 100 lb PAN | 9.3 |
| Reduction in Ammonia-N loss Compared to Broadcast | 57% |
| Reduction in P2O5 Application Rate | 10% |
| Band Spreading with Shallow Cover |
|
| Ammonium-N availability factor, Af | 0.97 |
| PAN estimate, lb PAN/1000 gal | 31.8 |
| Application rate to provide 100 lb PAN/ac, gal /ac | 3,144 |
| Resulting application rate for P2O5, lb/ac | 104 |
| Ammonia-N Loss, lb per acre / 100 lb PAN | 2.2 |
| Reduction in Ammonia-N loss Compared to Broadcast | 90% |
| Reduction in P2O5 Application Rate | 16% |
| Shallow Injection | |
| Ammonium-N availability factor, Af | 0.98 |
| PAN estimate, lb PAN/1000 gal | 32.0 |
| Application rate to provide 100 lb PAN/ac, gal /ac | 3,121 |
| Resulting application rate for P2O5, lb/ac | 103 |
| Ammonia-N Loss, lb per acre / 100 lb PAN | 1.4 |
| Reduction in Ammonia-N loss Compared to Broadcast | 93% |
| Reduction in P2O5 Application Rate | 17% |
Future Plans
The model results provided in this paper are currently being used to develop extension programs and will be used to update extension publications and recommendations for producers. It is hoped that these tabulated ammonium-N availability factors will be used to increase the precision of using swine manure as a fertilizer substitute and making better estimates of ammonia-N emissions.
Author
John P. Chastain, Professor and Extension Agricultural Engineer, Agricultural Sciences Department, Clemson University
Corresponding author email address
Additional Information
CAMM. 2005. Confined Animal Manure Managers Program Manual – Swine Version. Clemson, SC.: Clemson University Extension. Available at https://www.clemson.edu/extension/camm/manuals/swine_toc.html.
Chastain, J.P. 2006. A Model to Estimate Ammonia Loss Following Application of Animal Manure, ASABE Paper No. 064053. St. Joseph, Mich.: ASABE.
Chastain, J. P., J. J. Camberato, and J. E. Albrecht. 2001. Nutrient Content of Livestock and Poultry Manure. Clemson, SC.: Clemson University.
Montes, F. 2002. Ammonia volatilization resulting from application of liquid swine manure and turkey litter in commercial pine plantations. MS Thesis, Clemson, SC.: Clemson University.
Montes, F., and J.P. Chastain. 2003. Ammonia Volatilization Losses Following Irrigation of Liquid Swine Manure in Commercial Pine Plantations. In Animal, Agricultural and Food Processing Wastes IX: Proceedings of the Nineth International Symposium, 620-628. R.T. Burnes, ed. St. Joseph, Mich.: ASABE.
USEPA. 1995. Control and Pollution Prevention Options for Ammonia Emissions (EPA-456/R-95-002), report prepared by J. Phillips, U.S. Environmental Protection Agency, Control Technology Center. Research Triangle Park, NC. Available at https://www.epa.gov/sites/default/files/2020-08/documents/ammoniaemissions.pdf.
The authors are solely responsible for the content of these proceedings. The technical information does not necessarily reflect the official position of the sponsoring agencies or institutions represented by planning committee members, and inclusion and distribution herein does not constitute an endorsement of views expressed by the same. Printed materials included herein are not refereed publications. Citations should appear as follows. EXAMPLE: Authors. 2022. Title of presentation. Waste to Worth. Oregon, OH. April 18-22, 2022. URL of this page. Accessed on: today’s date.
Characterization of Innovative Manure Treatment Components
Purpose
Improvements in manure treatment/nutrient management are an important need for dairy farms to move substantively towards sustainability. This project quantifies several individual manure treatment components and component assemblies targeted to address farm/environment needs. Project outcomes should help dairy farms to make better-informed decisions about manure/nutrient management systems.
Societal demand for farms to reduce their environmental impact is driving the need for improved and cost-effective manure/nutrient management options. Dairy farms may need advanced manure treatment systems to be economically, environmentally, and societally sustainable.
What Did We Do?
Specific treatments being evaluated include anaerobic digestion, active composting, sequencing batch reactors, solid-liquid separation systems including, screw press separation, dissolved air floatation, centrifuging, and solid treatment systems including bedding recovery units and pelletization. We are working with a farm that has an anaerobic digester and screw press separators. They have been planning to install a Dissolved Air Flotation (DAF) system. The farm was approached with an in-vessel composting technology “active composting” to determine if it could effectively convert portions of the digested separated liquid flow to a stabilized solid that could be pelletized and exported, while the liquids could be further treated to become dilute enough to be spray irrigated on a limited acreage.
What Have We Learned?
We learned that although the active composting process was able to quickly produce stabilized high solid content material from a variety of mixes of digested separated liquid and dried shavings, the energy needed ranged from $9 to $14 per cow per day. Through volume/time calculations, the pumping system from the reception pit to the digester and the post digestion pit to the separators varied although the % solids were consistent. Doppler flow meters purported to be able to measure manure did not give consistent volume results. Screw press solid liquid separation can result in a bedding product with relatively low moisture (60%) from anaerobically digested dairy manure. Determining an optimum manure treatment system for dairy manure will be difficult given the variability from farm to farm.
Future Plans
Specific treatments yet to be evaluated include: anaerobic sequencing batch reactors, solid liquid separation systems including dissolved air floatation (DAF), centrifuging, and solid treatment systems including bedding recovery units (BRU) and pelletization. Covid supply chain issues and travel restrictions have slowed progress. The DAF system can be directly analyzed as it is installed on the dairy. A neighboring farm has a BRU that will be sampled and analyzed. Data from a centrifuge and pelletizer will be obtained from the literature. Putting the process in a treatment train will be explored on a spreadsheet.
Authors
Peter Wright, Agricultural Engineer, PRO-DAIRY, Cornell University
Corresponding author email address
Additional authors
Lauren Ray, Environmental Energy Engineer, PRO-DAIRY, Cornell University
Curt Gooch, Emeritus Senior Extension Associate, Cornell University
Additional Information
We have completed several fact sheets including Manure Basics, Advanced Manure Treatment – Part 1: Overview, Part 2: Phosphorus recovery technologies, Part 3: Nitrogen recovery technologies, and Part 4: Energy extraction. These are available at: https://cals.cornell.edu/pro-dairy/our-expertise/environmental-systems/manure-management/manure-treatment
Publications: Peter Wright, Karl Czymmek, and Tim Terry “Food waste coming to your farm? Consider where the nutrients go and manure processing for nutrient export” PRO-DAIRY The Manager, contained in Progressive Dairy Vol. 35 No. 5 March 12, 2021
Acknowledgements
This work was supported by a joint research and extension program funded by the Cornell University Agricultural Experiment Station (Hatch funds) and Cornell Cooperative Extension (Smith Lever funds) received from the National Institutes for Food and Agriculture (NIFA,) U.S. Department of Agriculture. Any opinions, findings, conclusions, or recommendations expressed in this publication are those of the author(s) and do not necessarily reflect the view of the U.S. Department of Agriculture. New York State Pollution Prevention Institute (NYSP2I) at the Golisano Institute for Sustainability (GIS) paid for the sampling that was funded by a grant to RIT from by the Environmental Protection Fund as administered by the NYS Department of Environmental Conservation.
The authors are solely responsible for the content of these proceedings. The technical information does not necessarily reflect the official position of the sponsoring agencies or institutions represented by planning committee members, and inclusion and distribution herein does not constitute an endorsement of views expressed by the same. Printed materials included herein are not refereed publications. Citations should appear as follows. EXAMPLE: Authors. 2022. Title of presentation. Waste to Worth. Oregon, OH. April 18-22, 2022. URL of this page. Accessed on: today’s date.
Does Irrigation of Liquid Animal Manure Increase Ammonia Loss?
Purpose
Large bore traveling gun and center pivot irrigation systems have been used to apply treated lagoon effluent, liquid animal manure, and untreated slurry from swine and dairy farms in many parts of the USA. The primary advantage of using irrigation equipment to spread manure on cropland are the lower costs for energy and labor, and the higher speed of application as compared to using a tractor-drawn spreader. The primary disadvantages are related to increases in odor release and the possibility of spraying manure on roads or another person’s property.
Ammonia-N loss from land application of manure is important because it is a loss of fertilizer nitrogen, and it is a source of air pollution. A previous study and several extension publications state that irrigation of animal manure increases ammonia-N loss by 10% to 25% (Chastain, 2019). As a result, the total ammonia-N loss was the sum of the ammonia-N lost while the manure traveled from the irrigation nozzle to the ground and the ammonia-N lost as the manure released ammonia-N after striking the ground.
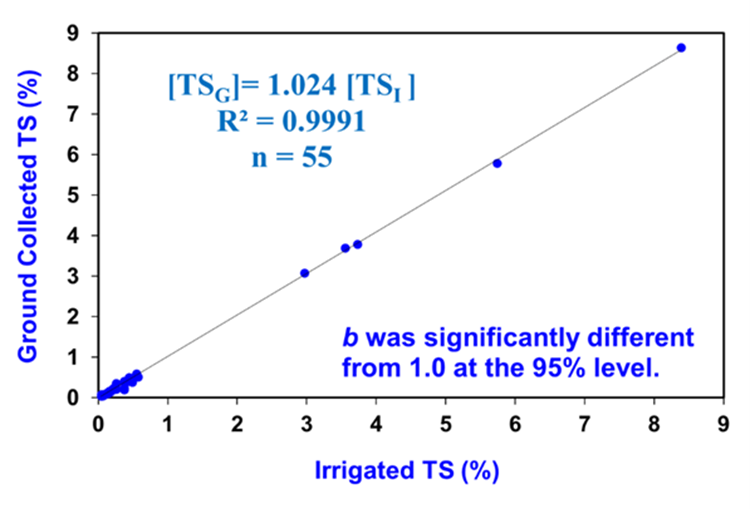
The objective of this presentation is to summarize the results of a meta-analysis of 55 data sets from 3 independent sources to quantify the ammonia-N lost during the interval of time from when the liquid manure exited the irrigation equipment and when a sample was collected on the ground. The complete review, data analysis, and the data used were provided by Chastain (2019).
What Did We Do?
The study included data from traveling gun, center pivot, and impact sprinkler irrigation of untreated liquid and slurry manure, lagoon supernatant, and effluent from an oxidation ditch. The data sets included measurements of the total solids content (TS, %), total ammoniacal N concentration (TAN = ammonium-N + Ammonia-N), and total nitrogen (TKN) for a sample collected from the lagoon or storage to describe what was in the manure that left the irrigation nozzle and measurements of the TS, TAN and TKN in the samples that were collected from containers on the ground. The concentrations of TS, TAN, and TKN in the ground collected manure samples were plotted against the TS, TAN, and TKN concentrations in the irrigated manure. The data pairs were analyzed using linear regression to determine if there was a statistically significant difference between the irrigated and ground collected samples. If there was perfect agreement the slope of the line would be 1.0. Therefore, statistical tests were used to determine if the slope of the line was statistically different from 1.0. If the test indicated that the slope was not significantly different from 1.0 then irrigation did not change the concentration of the TS, TAN, or TKN.
What Have We Learned?
Well-known data used in irrigation design indicates that evaporation loss during irrigation ranges from 1% to 3.5%. The plot of the data for irrigated manure is shown in Figure 1. It was determined that the slope of the regression line was statistically greater than 1.0. Therefore, evaporation losses were small, 2.4%, and agreed with previous studies on irrigation performance.
The plot of the TAN concentrations collected on the ground and the TAN contained in the irrigated water is shown in Figure 2.). The results showed that irrigation of manure did not result in a change in the concentration of TAN. Therefore, irrigation of manure did not cause ammonia-N loss.
The same type of analysis was done for the total nitrogen data to serve as check on the TAN results. As expected, the analysis showed that irrigation did not significantly alter the concentration of TKN.

A previous study reported TAN losses ranging from 10% to 25% during irrigation of liquid manure. Error analysis of the techniques used in these studies indicated that most of the average ammonia-N loss predicted was due to volume collection error in the irrigate-catch technique that was used, and not evaporation and drift as was assumed (see Chastain, 2019). It was concluded that irrigation, as a manure application method, did not increase ammonia-N losses. These results do not imply that ammonia volatilization after manure strikes the ground is to be ignored. The suitability of irrigation as a liquid manure application method should be evaluated based on the level of treatment and the potential impact of odors on neighbors.
Future Plans
These results are being used in extension programs and to help refine estimates of ammonia-N loss associated with land application of manure.
Author
John P. Chastain, Professor and Extension Agricultural Engineer, Agricultural Sciences Department, Clemson University
Corresponding author email address
Additional Information
Chastain, J.P. 2019. Ammonia Volatilization Losses during Irrigation of Liquid Animal Manure. Sustainability 11(21), 6168; https://doi.org/10.3390/su11216168.
The authors are solely responsible for the content of these proceedings. The technical information does not necessarily reflect the official position of the sponsoring agencies or institutions represented by planning committee members, and inclusion and distribution herein does not constitute an endorsement of views expressed by the same. Printed materials included herein are not refereed publications. Citations should appear as follows. EXAMPLE: Authors. 2022. Title of presentation. Waste to Worth. Oregon, OH. April 18-22, 2022. URL of this page. Accessed on: today’s date.