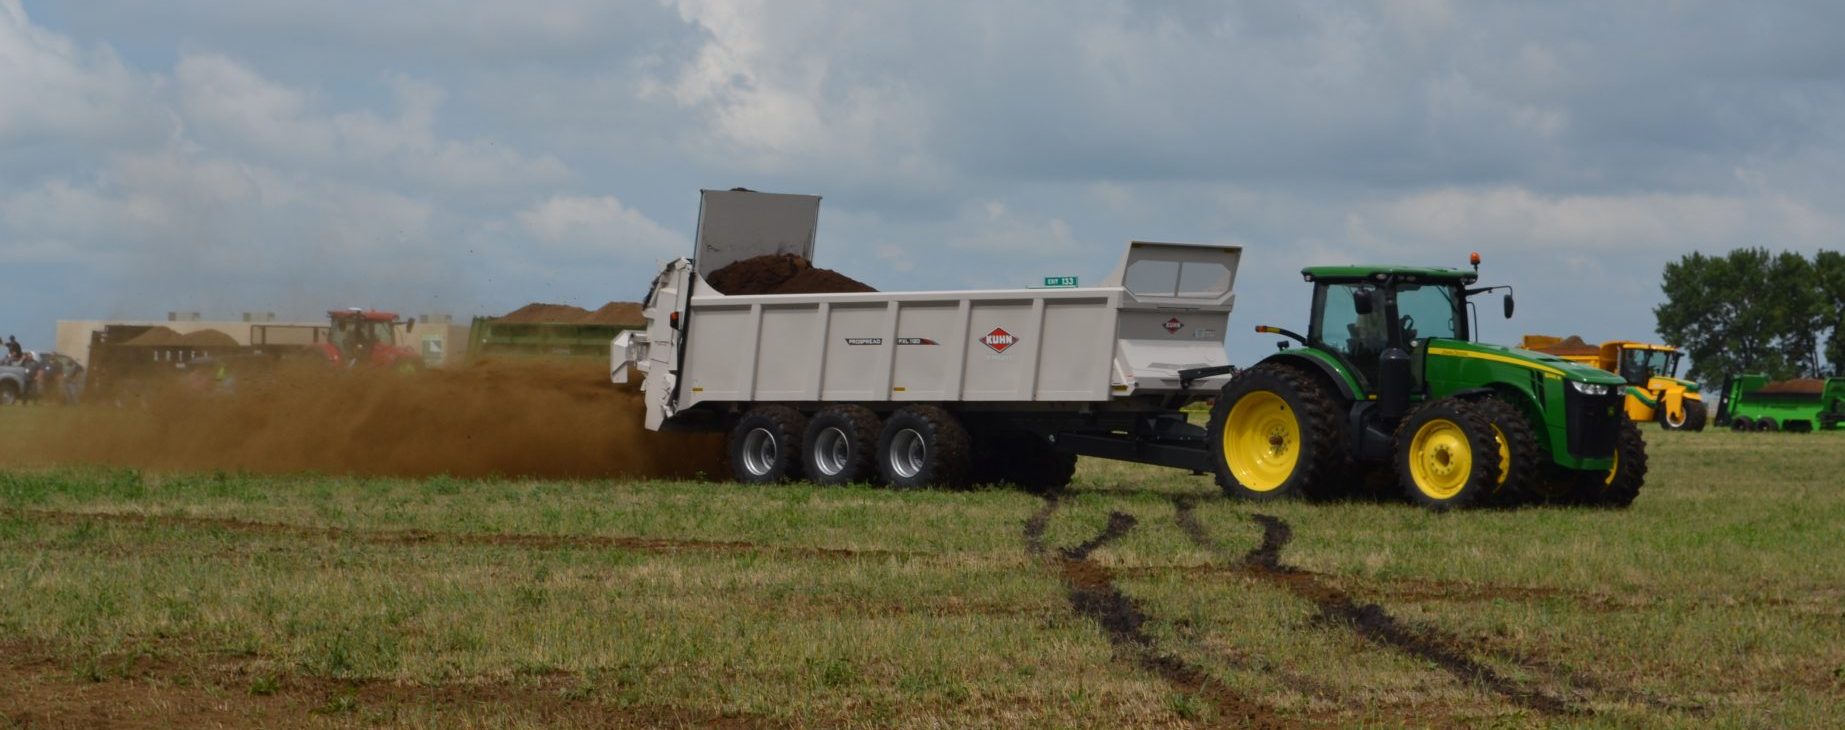
The purpose of this presentation is to provide a complete overview of ODA’s Division of Livestock Environmental Permitting (“ODA-DLEP”). ODA-DLEP regulates any livestock facility in Ohio that has the following number of animals or greater:
700 mature dairy cows
1,000 beef cattle or dairy heifers
2,500 swine weighing more than 55 pounds
10,000 swine weighing less than 55 pounds
82,000 layers
125,000 broilers or pullets
500 horses
55,000 turkeys
What Did We Do
Ohio Department of Agriculture’s Division of Livestock Environmental Permitting (“ODA-DLEP”) regulates the siting, construction, and operation of Ohio’s largest livestock facilities, referred to as Concentrated Animal Feeding Facilities (“CAFF”). ODA-DLEP’s primary objective is to minimize any water quality impacts, including both surface and ground waters, associated with the construction of new or expanding CAFFs, as well as implementation of best management practices once a CAFF becomes operational. These best management practices include management of manure, insect and rodent control, mortality management, and emergency response practices. ODA-DLEP issues Permits to Install (for construction) and Permits to Operate (for operations).
In addition, ODA-DLEP conducts routine inspections of each CAFF at least once a year, responds to complaints, and participates in emergency response. Inspections are conducted to review a CAFF’s compliance with Ohio Revised Code 903 and Ohio Administrative Code 901:10, the laws and regulations governing Concentrated Animal Feeding Facilities.
Finally, ODA-DLEP administers the Certified Livestock Manager program. Any individual in the State of Ohio that manages 4,500 dry tons of solid manure or 25 million gallons of liquid manure is required to be a Certified Livestock Manager (“CLM”).
What Have We Learned
Livestock operations continue to get larger and more concentrated and as a result, regulations are necessary to ensure proper handling and management of manure, particularly with land application of manure.
Future Plans
Over the past several years, DLEP has started to see more interest in manure treatment technologies. This could include, but is not limited to, anaerobic digestion, nutrient recovery, solids separation, and wastewater treatment. Technologies like this could greatly alter the landscape of the livestock industry by fundamentally changing the way manure is handled and how nutrients from manure are applied. DLEP does have regulations in place to account for manure treatment technologies. However, regulations, and specifically changes to regulations, cannot maintain the same pace as these technological advancements.
Authors
Samuel Mullins, Chief of ODA-Division Livestock Environmental Permitting
Samuel.mullins@agri.ohio.gov
The authors are solely responsible for the content of these proceedings. The technical information does not necessarily reflect the official position of the sponsoring agencies or institutions represented by planning committee members, and inclusion and distribution herein does not constitute an endorsement of views expressed by the same. Printed materials included herein are not refereed publications. Citations should appear as follows. EXAMPLE: Authors. 2022. Title of presentation. Waste to Worth. Oregon, OH. April 18-22, 2022. URL of this page. Accessed on: today’s date.
Manure lagoon systems are designed to hold and treat animal farm wastewater for a predetermined period and remain popular in many livestock farms. If the lagoon is properly designed and built, many years can go by without any significant maintenance requirements outside of water management, pumps and valves. Depending on the capacity and maintenance, additional manure solid removal is often required to reduce the amount of manure solids entering the lagoon storage. When excessive solids build-up or sludge was found, significant odor and low quality/quantity of flushing water would be the issues.
This study documents experience to prepare for and complete land application of lagoon effluent with heavy solids from a flush dairy lagoon in central Missouri. The free stall barn uses mattress bedding with supplemental cedar shavings and houses 140-160 lactating cows. Preparation included measuring lagoon sludge depth and lab analysis of sludge characteristics and scouting for crop fields for land application prior to contacting contractors for a bidding process. A contractor team utilized specialized equipment to dilute, agitate, pump and land apply approximately 8 million gallons of diluted lagoon solids in less than nine working days. Lagoon effluent was sampled throughout the process to monitor the mass of nutrients applied to specific plots of land. For effective lagoon solids removal and land application, proper preparation, specialty equipment and trained professional, timing of the crop fields, and adequate field working days are critical. Simple, non-mechanical technologies are available for even small to midsize dairy farms to reduce the cost of lagoon maintenance by preventing the bulk of solids from entering the lagoon.
What Did We Do?
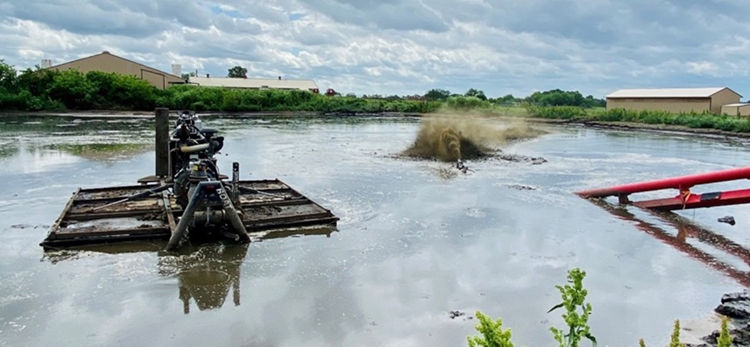
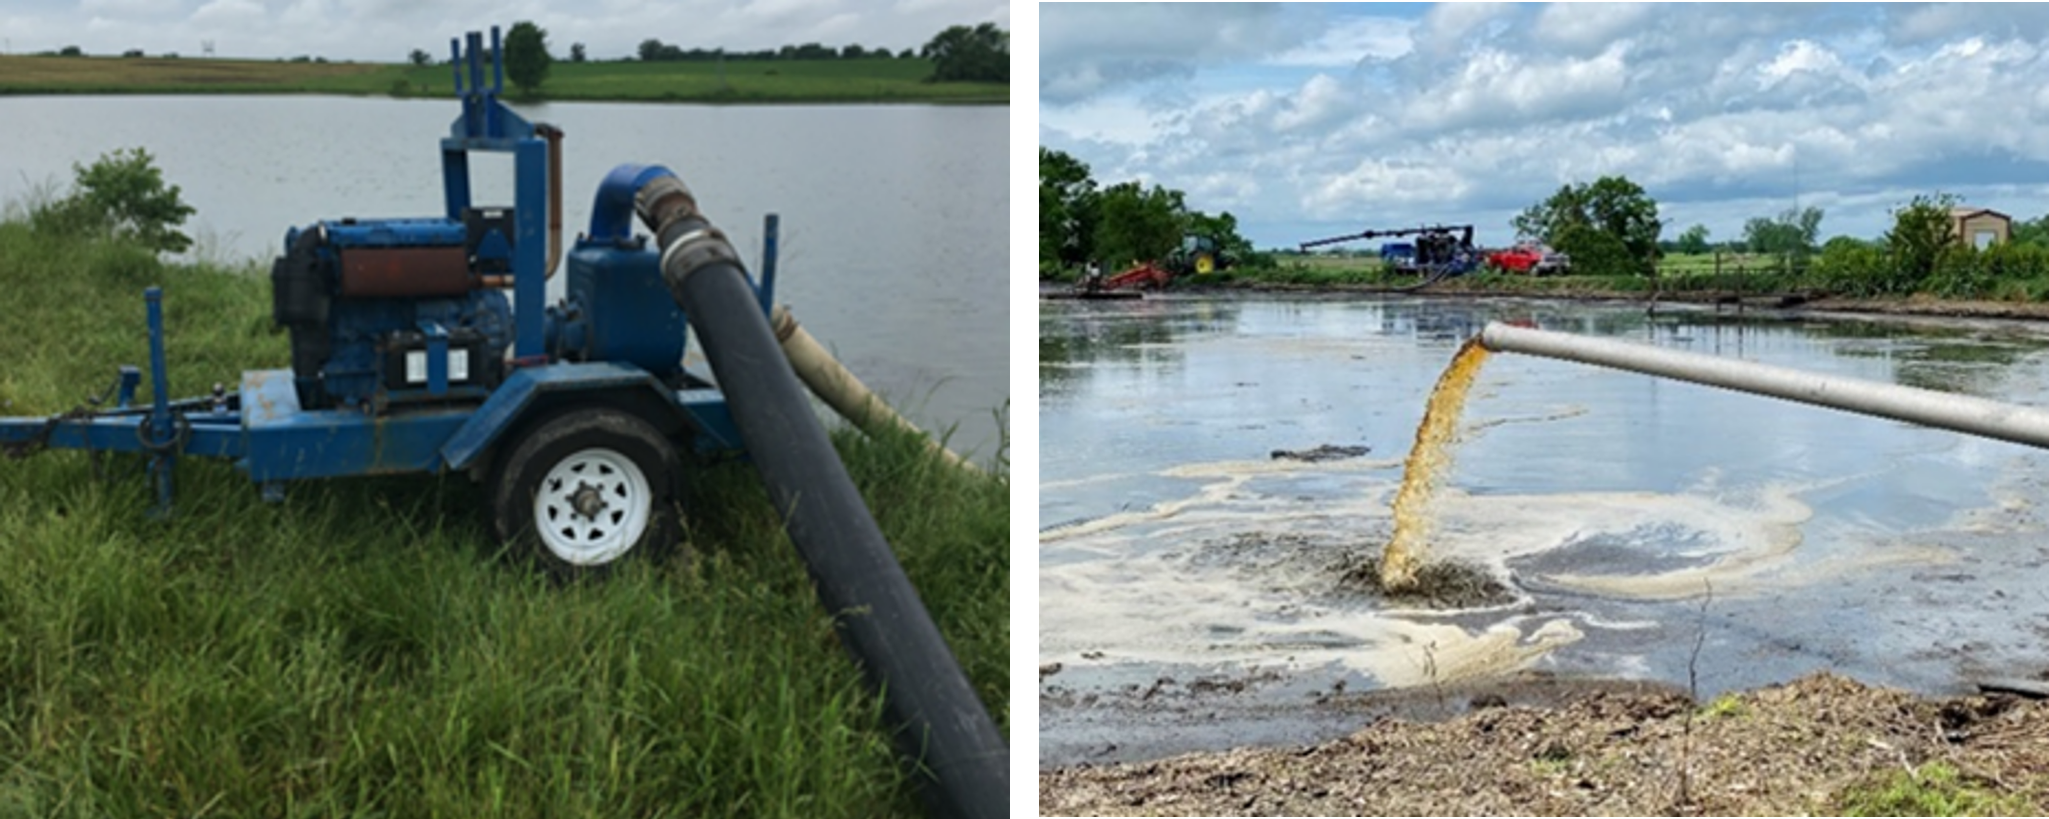
We documented the process of lagoon solids removal for land application, considering the preparation (sludge and effluent sampling), specialty equipment and trained professionals, timing of the crop fields, and adequate field working days. The barn was flushed two to three times per day, with three times per day being typical. There was, at one time, an elevated screen that helped remove the large solids from the flush, but the screen system fell into disrepair several years ago and was abandoned. Solids in the lagoon were agitated and pumped out from May 21, 2020, through June 8, 2020, Figures 1 and 2. A total of 8 million gallons over 280 acres was applied to fields further away from the lagoon, including neighbor’s crop fields that were 1.5 miles away. Equipment needs and specifications were documented (Canter et al., 2021) and being prepared for an Extension publication.
Figure 1. PTO-drive lagoon agitators and agitation boat in operation.Figure 2. A dilution pump was used to pump water from the nearby lake (left) to the dairy lagoon (right) with agitation boat and lagoon agitation working in the background.
Daily lagoon effluent samples were taken multiple samples throughout the day on June 2 to gauge the consistency of nutrient concentrations. Results suggest that once completely mixed via agitation, the applied nutrient concentration from a single sample is a reliable estimate within a working day if the moisture content is consistent. The initial slurry had a 10-13 percent solids content, so a significant amount of dilution water was needed to dilute the solids content to the target range. The exact amount of dilution water used was unknown. Figure 3 shows the concentration and moisture data. In general, the higher the moisture content (less solids) in the slurry samples, the higher the concentrations of the important manure nutrients are. The team evaluated potential technologies based on historical experience and first-person interviews. A pull-plug sediment basin (PPSB) was selected after reviewing cost and visiting with a farmer who operated a PPSB and was satisfied with the overall operation and performance (Canter et al., 2021). The application rate of important manure nutrients did show variation during the several days of land application, suggesting an improvement to the real-time effluent nutrient measurement and land application rate adjustment could be improved to provide more consistent nutrients to the crop fields.
Figure 3. Concentrations and moisture content of slurry samples from the lagoon.
What Have We Learned?
Manure management can be a burden for animal feeding operations, which can potentially become a significant threat to the profitability and management of farms if not proactively managed. Owners would be well-advised to survey their lagoon yearly to track solid inventory and plan ahead for the amount of land needed for solids application. Proper solids removal from the lagoon, particularly if regular and effective solids removal has been neglected, requires specialized equipment to reduce liquid supernatant on an annual or semiannual basis. There can be significant variability of nutrient concentration and resulting mass applied. Testing for nutrient concentrations in the lagoon, whether supernatant or sludge, or both, can be misleading due to variance in concentrations due to moisture content as the applicators dilute and concentrate the solids during the land application process.
Daily sampling during land application could help but may not be practical due to the analysis time generally required by labs (5-10 business days). Sensors and probes are available that return instantaneous values and have been used in municipal and industrial wastewater treatment for over a decade. Companies have offered integrated sensors for land application equipment, combining them with their GPS and flow control system to give a complete and accurate summary of nutrient application. Simple, non-mechanical technologies are available for even small to midsize dairy farms to reduce the cost of lagoon maintenance by preventing the bulk of non-degradable solids from entering the lagoon. Implementation of a coarse solids separation system such as the PPSB could significantly reduce the long-term cost of manure management by allowing the operator to use more common equipment (e.g., a loader and spreader) to remove solids from the manure management system.
Future Plans
Continuous monitoring of the lagoon sludge level at a minimum of annual basis is needed to closely monitor the lagoon solid accumulation and performance of the PPSB. The authors are collaborating with NRCS team to improve the PPSB and ways to monitor the lagoon sludge level.
Authors
Teng Lim, Extension Professor, Agricultural Systems Technology, University of Missouri
Corresponding author email address
Limt@missouri.edu
Additional authors
Timothy Canter, Extension Specialist, Agricultural Systems Technology, University of Missouri
Joseph Zulovich, Extension Assistant Professor, Agricultural Systems Technology, University of Missouri
Additional Information
Canter, T., Lim, T.-T., and J. A. Zulovich. 2021. Field Experience of Removing and Land Application of Dairy Lagoon Solids. In International Symposium on Animal Environment and Welfare. Rongchang, Chongqing, China.
Lim, T.-T. 2022. Lagoon Solids Removal, Lessons Learned. Cleanout for Lagoons and Anaerobic Digesters, Jan 21, 2022. Webinar of Livestock and Poultry Environmental Learning Community (LPELC). https://lpelc.org/cleanout-for-lagoons-and-anaerobic-digesters/
Canter, T., Lim, T.-T., Chockley, T. 2021. Considerations of Pull-Plug Sedimentation Basin for Dairy Manure Management. University of Missouri Extension Publication. Retrieved September 25, 2021. https://extension.missouri.edu/publications/eq302.
Acknowledgements
USDA NIFA, Water for Food Production Systems Program A9101, for supporting the project. It is titled “Management of Nutrients for Reuse”, a multi-faceted project that involves professionals from the University of Arkansas, University of Nebraska, Colorado School of Mines and Metallurgy, Case Western University, and University of Missouri.
Joe Harrison, Professor, Livestock Nutrient Management program, Washington State University
Gilbert Miito, Postdoctoral Fellow, Agricultural Systems Technology, University of Missouri
Richard Stowell, Biological Systems Engineering, University of Nebraska
Farm crew and custom applicator team for their help.
The goal of this study was to identify areas that were prone to nutrient transport from land application of manure-based on environmental conditions including length of streams and flood hazard potential in those areas. Additionally, the study aimed at developing an economic utility for producers in transporting manure in the Maumee Watershed in North-west Ohio targeted at reducing the potential environmental impacts that may arise from over application.
What Did We Do?
The initial basic feasible solution of the Hitchcock transportation model (Derigs, U. 1988. The Hitchcock Transportation Problem. In: Programming in Networks and Graphs. Lecture Notes in Economics and Mathematical Systems, vol 300. Springer, Berlin, Heidelberg.) was used to simulate the distribution of manure from 31 dairy and swine concentrated animal feeding facilities to agricultural census block groups (soybeans and corn) in the Maumee Watershed within NW Ohio. The model considered the supply and demand capacity of nearby livestock operations (origin) and agricultural census block groups (destinations) respectively. The second objective was to identify areas that were prone to nutrient transport as determined from the model results based on environmental conditions related to floodplain and length of streams dataset using the Getis-Ord GI* statistic. Finally, using the objective function of the transportation problem, the transportation costs associated with hauling manure from the source to the destinations were calculated.
What Have We Learned?
The distribution of manure showed an unbalanced transportation problem such that available farmland that could receive manure exceeded the supply of the livestock operations. The findings suggest there is adequate agricultural land for manure distribution in the watershed. Additionally, areas indicating clustering in the distribution of manure were further examined to determine the potential for nutrient transport off the land and into nearby water bodies based on the environmental conditions used. Approximately 98% of receiving agricultural census block groups fell in the EC-1 classification, which indicates a very low potential for environmental conditions to influence nutrient movement off farmland receiving manure from the 31 CAFFs studied. Approximately 2% and 1% of total acres receiving manure had a moderate to high potential for flooding respectively and were found in Upper Maumee and St. Joseph sub-basins. The identified sub-basins are recommended target areas for best management practices in reducing nutrient runoff. In using the Getis-Ord GI* statistic in ArcMap, Auglaize, Upper Maumee, Lower Maumee, and Cedar-Portage sub-basins were identified as critical areas of concern with high total acres showing high clustering of stream length.
Future Plans
The transportation problem is a type of linear programming problem where goods and services are transported from one set of sources to one set of destination points to minimize transportation costs. There are two phases to the transportation problem – finding the initial basic feasible solution while the second phase involves optimizing the initial basic feasible solution. This study focused on finding the initial basic feasible solution for manure distribution and application in the Maumee River Watershed. Future research could include optimization of the initial basic feasible solution per the transportation problem process to test the robustness of the results from the first phase.
Secondly, the transportation model coded for this dissertation was based on the manure supply of permitted livestock facilities engaged in only swine and dairy production. The model could be refined to include the supply of all livestock operations in the watershed in addition to all destination agricultural lands. With transportation costs being a major overhead cost for producers, the model can also be calibrated based on minimal travel time as an economic utility for producers and farmers.
Furthermore, given the costs involved in the construction of manure storage facilities and the regulations surrounding manure application as identified in Ohio State Bill 1, locations for ‘manure- sheds’ can be identified for manure storage during off seasons for application. A GIS optimal model can be developed to determine the minimum cost and distance efficient for the location of the proposed ‘manure-sheds’ where both small and medium facilities with limited storage facilities can transport their manure to a centralized location for storage, while also serving as the point of distribution and utilization for farmers.
Many small and mid-sized dairy farms use flush systems for manure removal due to reduced chore time and increased barn cleanliness. Often, flush systems require greater attention to onsite water management and frequent lagoon maintenance. While anaerobic lagoons provide some digestion of manure solids and sludge storage, solids removal may help increase lagoon capacity and reduce costly lagoon sludge removal. A pull-plug sedimentation basin (PPSB) is a passive solids removal system that can reduce the operational time and cost of the overall manure management system by acting as both a sedimentation basin and pre-lagoon solids filter system.
Larger, denser particles accumulate on the basin floor, while buoyant particles (e.g., undigested fiber, waste forage, bedding, etc.) form a floating mat on the surface. The mat acts as a natural filter and retains some of the solids from the waste stream. The PPSB was developed as part of a collaborative effort between USDA NRCS and small dairy producers in Missouri. This abstract provides background and basic information on the PPSB, while more performance evaluation of the system based on nutrient retention, costs, and maintenance and operational considerations can be found in a University of Missouri Extension publication Eq302 (Canter et al., 2021).
What Did We Do?
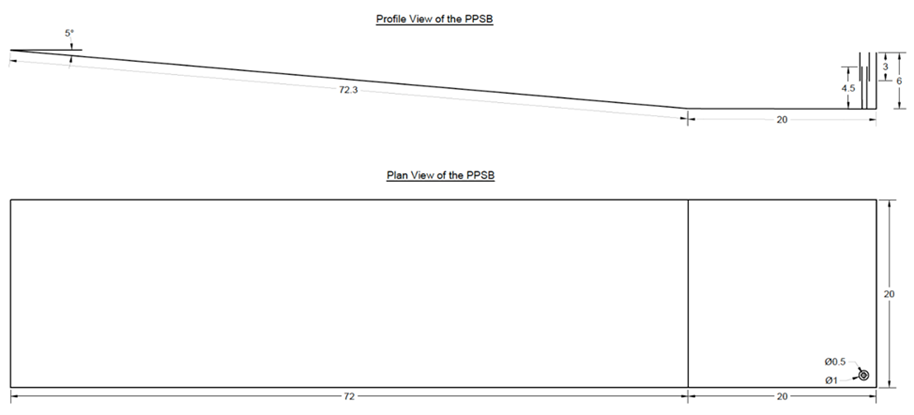
Design details of a working PPSB were documented, and performance evaluation was conducted based on grab samples of the flush and PPSB locations. Critical design considerations for the PPSB including design, hydraulic loading, location of the pull-plug location, and construction details were reported in the Extension publication (Canter et al., 2021). The concrete entry ramp into the PPSB should have a maximum slope of 12:1 (or 5 degrees) (Figure 1) to minimize wheel slippage and potential for equipment overturns. The example provided in Figure 1 is of a typical PPSB design that serves a herd of ~150 milking cows with a single-flush volume of ~7,000 gallons but also represents the smallest recommended size of the system. A minimum depth of 6 feet is needed to keep settling solids out of the discharge stream.
Figure 1. Profile and plan views of typical PPSB (dimensions in feet).
Detailed discussion of the advantages and disadvantages of the PPSB system was reported in the Extension publication. Relatively little maintenance has been reported, while the pull-plug is the only moving part and may need to be replaced if damaged during cleaning or degradation, Figures 2 and 3. Details such as the management and sampling and analysis were discussed, and a case study was conducted to document the information of a PPSB system of a 120-hd dairy farm in Missouri, with a flush system and sand lane, as well as a performance evaluation.
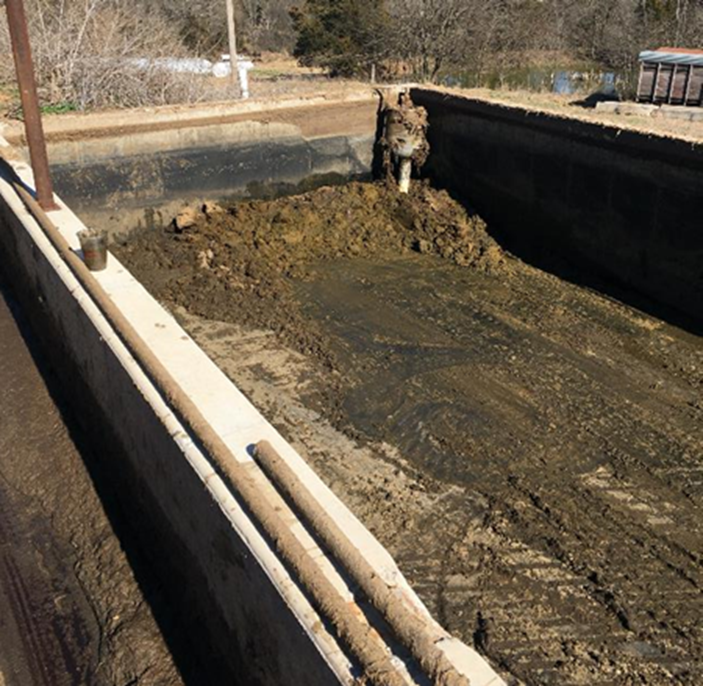
Figure 2. A PPSB system in operation at a dairy farm.Figure 3. PPSB with liquid discharge pipe, after manure solid was removed.
What Have We Learned?
The owners are satisfied with the performance of the PPSB, which is considered a low-maintenance, low-technology option to efficiently manage manure solids within a flush system. The primary benefit of the PPSB is a reduction in time spent agitating and removing solids/sludge in the lagoon. When less capacity in the lagoon is used for solids treatment and storage, there is more room to store water and longer intervals between repairing or unclogging pumps and the water system. There are typically three to four clean-out periods per year, depending on PPSB and herd sizes and other factors.
The primary benefit of the PPSB is the removal of manure solids using a low maintenance system, resulting in longer intervals between lagoon agitation and land applications. Approximately 23,450 cubic feet of manure solids were prevented from entering the lagoon each year, along with 6,454 pounds of nitrogen (438 pounds as ammonia-nitrogen) and 2,415 pounds of phosphorous. These represent 13 percent and 28 percent of manure-based nitrogen and phosphorous, respectively, being retained in the PPSB.
Future Plans
Additional sampling just before or during clean-out is necessary for a more accurate performance determination. PPSB installed at larger dairy farms, and those using different bedding should be evaluated for performance and documented the cost savings as compared with other popular solid separation systems.
Authors
Teng Lim, Extension Professor, Agricultural Systems Technology, University of Missouri
Corresponding author email address
Limt@missouri.edu
Additional authors
Timothy Canter, Extension Specialist, Agricultural Systems Technology, University of Missouri
Troy Chockley, Environmental Engineer, Natural Resource Conservation Service, United States Department of Agriculture
Additional Information
Canter, T., T.-T. Lim, and T. Chockley. 2021. Considerations of pull-plug sedimentation basin for dairy manure management. University of Missouri Extension. https://extension.missouri.edu/eq302
Acknowledgements
USDA NIFA, Water for Food Production Systems Program A9101, for supporting the project. It is titled “Management of Nutrients for Reuse”, a multi-faceted project that involves professionals from the University of Arkansas, University of Nebraska, Colorado School of Mines and Metallurgy, Case Western University, and University of Missouri.
Joseph Zulovich, Agricultural Systems Technology, University of Missouri
Richard Stowell, Biological Systems Engineering, University of Nebraska
The “manureshed” refers to the land base needed to assimilate the nutrients produced by a livestock operation without presenting a danger to water, land, and air resources. Trends toward large dairies in many regions of the US, often with high density of livestock relative to the amount of land available for nutrient application, have increased in recent decades. Consequently, import of feed and forage often leads to nutrient surpluses and the need to transport manure off farm for land application. Our purpose was to evaluate the status of dairy manuresheds across the US to highlight challenges and opportunities to improve nutrient balances and facilitate manure nutrient redistribution when needed.
What Did We Do
Our group produced case-studies of manureshed management from four major dairy producing states across the US. We reviewed the predominate structure of dairies in those states and analyzed the primary challenges that must be addressed to safely assimilate nutrients. We focus on reviewing the extent of off-farm redistribution of manure that is needed in each of those states, limitations to redistribution, and approaches that can be built upon to facilitate redistribution. In the Minnesota case-study, where nutrient management data is publicly available for Confined Feeding Operations, GIS software was used to estimate manure transport distances for varying cropping systems and dairy cattle breeds. For Idaho, New Mexico, and Pennsylvania, whole-farm modelling is referenced to understand nitrogen (N) and phosphorous (P) balances on a range of dairies.
What Have We Learned
Soil P assimilation capacity was the predominate factor constraining manureshed land requirements in three of the four states studies. However, nitrate leaching potential was the largest constraint in New Mexico, where dairy forages were largely grown on irrigated lands near rivers. GIS analysis in Minnesota estimated that an average travel distance of 4.1 km for manure transport was required for dairy with 1000 or more cows. The Minnesota case-study also revealed smaller manuresheds were required, per unit of energy-corrected milk, for Jersey cattle compared to the larger Holsteins. Modelled nutrient budgets for Idaho indicated a greater need for off-farm transport, suggesting that expanded application of dairy manures on alternative crops (such as potatoes, sugar beets, and barley) should be considered. In New Mexico, large dairies and limited cropland has caused extensive import of feed from other states and Mexico, with informal nutrient brokering networks developing. In Pennsylvania, dairy producing counties are largely overall sinks for nutrients, but historic heavy manure applications on fields near dairy barns often necessitates greater redistribution of manure nutrients within individual dairies or transfer to local crop farms.
Multiple approaches for improving nutrient balances and distribution of manure were identified in the case studies. Continuing advances in dairy nutrition and cattle genetics are helping to improve nutrient balances and reduce quantities of N and P excreted. When nutrient surpluses necessitate off-farm transport, informal networks for connecting dairies with surplus nutrients with crop farms that have nutrient assimilation capacity, described in New Mexico, provide a basis for development of similar networks elsewhere. Manure processing developments also provide possibilities for more economical transport or reuse of manure nutrients from farms with liquid handling.
Future Plans
The current work provides an overview of the current status of manureshed management in dairy regions. Continuing work is needed to refine nutrient balances for individual farms and to continue to develop tools that assist farmers in understanding nutrient balances and manureshed requirements on their farms. Involvement of social scientists and economists is needed to further develop networks for manure redistribution. Our work also points to the need for greater federal and state cost sharing and more technical support from government, universities, and farm organizations to facilitate more intensive evaluation of manureshed requirements and transport of manure when needed.
Authors
Curtis Dell, Soil Scientist, USDA-ARS, Pasture Systems and Watershed Management Research Unit, University Park, PA Curtis.Dell@usda.gov
Additional Authors
John Baker, USDA-ARS, St. Paul, MN
Sheri Spiegal, USDA-ARS, Las Cruces, NM
Sarah Porter, Environmental Working Group, Minneapolis, MN
April Leytem, USDA-ARS, Kimberly, ID
Colton Flynn, USDA-ARS, Temple, TX
Alan Rotz, USDA-ARS, University Park, PA
David Bjornberg, USDA-ARS, Kimberly, ID
Ray Bryant, University Park, PA
Robert Hagevoort, New Mexico State Univ., Clovis, NM
Jeb Williamson, New Mexico State Univ., Las Cruces, NM
Amalia Slaughter, USDA-ARS, Las Cruces, NM
Peter Kleinman, USDA-ARS, Fort Collins, CO
Additional Information
C.J. Dell et al., 2022. Challenges and opportunities for manure management across US Dairy systems: Case Studies from four regions. Journal of Environmental Quality. (In press in pending special edition on manureshed management).
Acknowledgements
USDA Agricultural Research Service and the Dairy Agroecosystems Workgroup (DAWG, USDA-ARS)
The authors are solely responsible for the content of these proceedings. The technical information does not necessarily reflect the official position of the sponsoring agencies or institutions represented by planning committee members, and inclusion and distribution herein does not constitute an endorsement of views expressed by the same. Printed materials included herein are not refereed publications. Citations should appear as follows. EXAMPLE: Authors. 2022. Title of presentation. Waste to Worth. Oregon, OH. April 18-22, 2022. URL of this page. Accessed on: today’s date.
This webinar explores in-field measurements of nutrient concentrations and discusses how precision technologies impact agronomic and water quality management decisions as well as pave the way for automating record-keeping and removing human error from applications. This presentation was originally broadcast on April 17, 2020. More…Continue reading “Precision Technologies for Managing Manure”
Over the last 15 years it has become common to build new poultry production facilities on a piece of property that will provide the necessary land area for all of the barns and support facilities, and that comply with the setbacks (i.e. surface water, nearest neighbors) required by local, state, and federal regulations. The manure management plan in such cases depended on the transport of poultry manure to remote cropland that was often not owned and managed by the poultry producer. In some states, the law held the poultry producer legally responsible for any possible environmental consequences associated with irresponsible spreading or handling. Such laws tended to limit transport distances due to the lack of liability transfer. In other states, like South Carolina, poultry manure brokers were required to have a state permit that allowed for the transfer of liability from the producer to the broker by means of a contract. The broker became liable for proper application rates, adherence to setback requirements, application at agronomic rates, and other state requirements. While transfer of liability did encourage the movement of manure from nearby fields with high soil-test phosphorous contents to remote fields that could benefit from all plant nutrients in manure it also gave rise to an increase in the number or farms that were permitted with manure brokerage as the only manure nutrient management alternative.
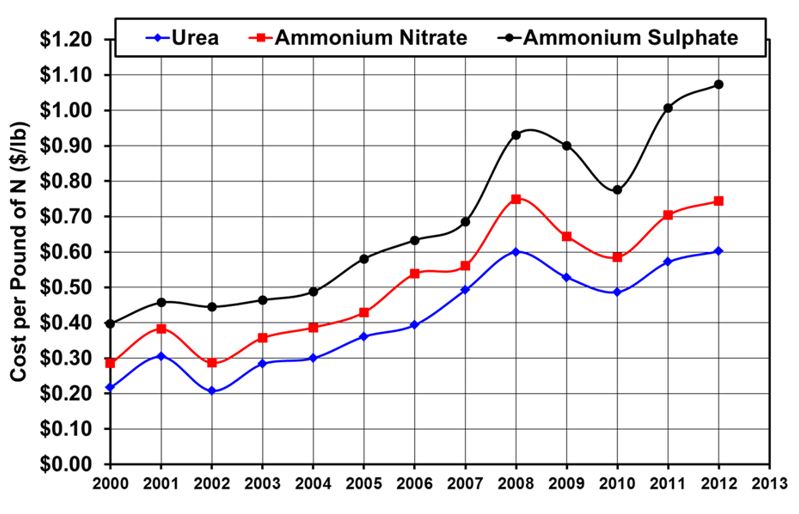
During the period from 2002 to 2008 when many new poultry farms were being built the average prices of N, P2O5, and K2O were increasing due to surges in fuel prices. Nitrogen prices increased in a linear manner from 29 to 75 cents per pound or a 2.6 fold increase in price (Table 1 and Figure 1). Prices of the other major nutrients, P2O5 and K2O, increased by over a factor of 3 for the same six year period (Figure 2). Such increases in the cost of fertilizers greatly increased demand for poultry manure, and further encouraged poultry producers to build barns that depended on brokerage as the only manure management option without any considerations of potential decreases in manure value. In recent years, fertilizer prices have decreased and brokerage of manure is not as attractive. The objective of this study was to determine the impact of fertilizer price fluctuations on the value of broiler litter, high-rise layer manure, turkey grow-out litter, and turkey brooder litter.
Table 1. Fertilizer composition information and equation used to convert price per ton to price per pound.
Fertilizer Description
Nutrient Content Per Ton of Fertilizer
Urea – 46% N by weight
920 lb N/ton
Ammonium Nitrate – 34% N by weight
680 lb N/ton
Ammonium Sulfate – 21% N and 24% by weight
420 lb N/ton
Conc. Super-Phosphate – 46% P2O5 by weight
920 lb P2O5 /ton
Potassium Chloride – 60% K2O by weight
1200 K2O / ton
Equation Used to Convert Fertilizer Price to Price per Pound of Nutrient
$ / lb Nutrient = $ / Ton of Fertilizer÷ lb Nutrient / Ton
Figure 1. Variation in nitrogen prices based on national averages from 2000 to 2012 (USDA-ERS, 2013).
Figure 2. Variation in P2O5 and K2O prices based on national averages from 2000 to 2012 (USDA-ERS, 2013).
What did we do?
Fertilizer Nutrient Content of Poultry Manure
The type of poultry raised in a building and the amount of bedding used causes a wide variation in the plant nutrient content of the manure removed from the building. The manure composition used in the study was taken from data obtained in South Carolina and is shown in Table 2. Broiler litter and turkey grow-out litter were the most similar since pine shavings were used as bedding and several flocks of birds were grown-out on the litter prior to building clean-out. Clean-out frequency varies greatly from every 1 to 1.5 years. The data shown in Table 2 corresponded to annual litter clean-out. The moisture contents (MC) of these two litters were also similar (24% for the broiler litter and 26% for the turkey grow-out litter). Turkey production begins on a brooder farm where chicks are placed, brooded, and the poults are transported to a grow-out farm. These farms are unique in that the litter was completely changed after each flock. The result is that litter from a brooder farm is much drier (14% moisture content) and contains less manure than any other type of poultry manure. The lower manure content also resulted in lower plant nutrient content. Manure from a high-rise layer barn was at the other extreme. Since no bedding was added to the manure the moisture content was much higher (47%). The high moisture content resulted in lower plant available nitrogen (PAN) content as compared to broiler litter, as well as lower phosphorus content (expressed as P2O5) and potassium (expressed as K2O).
Table 2. Poultry manure composition (lb / ton) used in the analysis (Chastain et al, 2001).
Nutrient
Broiler Litter(MC = 24%)
Layer Manure(MC = 47%)
Turkey Grow-out Litter (MC = 26%)
Turkey Brooder Litter (MC = 14%)
Ammonium-N
10
12
12
2.6
Nitrate-N
3.6
None detected
0.4
0.6
Org-N
43.8
22
42
37.2
Total-N
57.4
34
54
40.4
PAN – inc *
38
23
35
25
P2O5
66
51
64
29
K2O
57
26
37
20
* PAN – inc. = Incorporated plant available N = 0.60 x Org-N + 0.80 x Ammonium-N + Nitrate-N
Data for all three forms of nitrogen are provided in Table 2. However, not all of the nitrogen in manure is available for use by a crop. For this study, it was assumed that poultry manure was incorporated on the same day that it was applied by disking. As a result, 80% of the ammonium-N was counted as plant available. The amount of organic-N (Org-N) mineralized was assumed to be 60% based on common recommendations in South Carolina, however mineralization rates vary based on soil temperature, pH, and moisture. All the small amounts of nitrate contained in the manure was counted as available. The equation used for PAN estimates is provided with the table. Additional information concerning the estimate of plant available-N is provided by Chastain et al (2001).
The three plant nutrients used in our analysis are shown in bold colors in Table 2 for each type of poultry manure. They were the PAN, which is the best estimate of the nitrogen in manure that can be substituted for fertilizer-N, P2O5, and K2O.
Fertilizer Component Prices Used
The price of a pound of fertilizer nitrogen depends of the source. The price data shown previously in Figure 1 shows clearly that the most expensive source of nitrogen was ammonium sulfate, followed by ammonium-nitrate and urea. Ammonium-sulfate, the most expensive source of N, has few advantages unless soil-test results indicate that addition of large amounts of sulfur is needed. Ammonium-nitrate is one of the most common types of nitrogen used to manufacture complete fertilizers. It has the advantage of being water soluble, and is not as readily lost to the air as ammonia as compared to urea. Urea has the advantages of being more water soluble than ammonium-nitrate, and contains 35% more N per ton than ammonium-nitrate. The primary disadvantage of urea is that a significant amount (20% to 40%) can be lost to the air by ammonia volatilization unless it is incorporated in the soil to a depth of at least one inch. So the basic question to decide is: which N-price should be used to define the value of the plant available-N in poultry manure? The price of urea was selected because urea and poultry manure behave similarly with regards to ammonia volatilization losses.
The prices of N, P2O5, and K2O were shown to fluctuate widely from 2000 to 2012 (see Figures 1 and 2). The largest cause of these price fluctuations was the price of energy (i.e. oil) needed to manufacture and transport fertilizers. As a result, the prices of these three major plant nutrients were not allowed to vary independently in the analysis. That is, prices of all three nutrients had to be selected by year because of the dependence of all three on energy prices.
It was not a study objective to try to predict future prices since that would be possible, nor was it to perform calculations for each year. To do so would provide many numbers, but would obscure the basic points to be learned. Instead, the approach used was to select nutrient prices by year and use the years that encompassed the linear increase that began in 2004 as well as major peaks and valleys seen in the price of nitrogen in 2008, 2010, and 2012. Prices were also obtained from market reports to obtain prices for the fourth quarter of 2016 (USDA-SC, 2016; DTN, 2016). The actual prices used by year for the analysis are given in Table 3.
Table 3. Component fertilizer prices used in the analysis (USDA-ERS, 2013). The prices shown for 2016 were average prices obtained from market publications from the fourth quarter (USDA-SC, 2016; DTN, 2016).
Year
$/lb N (Urea)
$/lb P2O5
$/lb K2O
2004
0.30
0.29
0.15
2008
0.60
0.87
0.47
2010
0.49
0.55
0.43
2012
0.60
0.72
0.54
2016
0.37
0.26
0.27
Value of Poultry Manure Used as a Complete Fertilizer – N,P, and K
The first step in the study was to calculate the value of a ton of poultry manure by multiplying the price of N, P2O5, and K2O for each year (Table 3) by the amount of these nutrients per ton of manure (Table 2). This assumes that all of the nutrients in the manure can be used to grow a marketable crop. This is only true if the soil is poor in fertility or the excess P can be used by other crops in the rotation without application of additional manure. Many brokerage contracts in South Carolina, are based on application of 2 tons of litter per acre prior to a primary crop, such as corn or cotton. Additional litter is not spread on the second crop which is often soybeans. The results for the first step are provided in Table 4.
Table 4. Variation in the value of various types of poultry manure ($/ton) based on variability in price of N, P2O5, and K2O. Prices assume that all of the nutrients in the manure can be used in a crop rotation.
Year
Broiler (MC = 24%)
Layer (MC = 47%)
Turkey Grow-out (MC = 26%)
Turkey Brooder (MC = 14%)
2004
39.09
25.59
34.61
18.91*
2008
107.01
70.39
94.07
49.63
2010
79.43
50.50
68.26
36.80
2012
101.10
64.56
87.06
46.68
2016
46.61
28.79
39.58
22.19*
* Denotes values too low to be part of a viable brokerage contract with typical brokerage prices being in the range of $20 to $25 per ton of manure.
The most important observations that can be made from the results given in Table 4 are given below.
The value of broiler and turkey grow-out litter followed similar fluctuations. The values ranged from about $35 to $39 per ton in 2004 to a maximums of $94 to $107 per ton in 2008. By the end of 2016 the value of turkey grow-out litter and broiler litter ranged from about $40 to $47 per ton. During the years with high fertilizer prices brokerage customers that were paying $40 to $50 to spread 2 tons of litter per acre were receiving much more fertilizer value than they were paying for.
Turkey brooder litter consistently had the lowest value per ton as compared to the others due to low nutrient content and the large amounts of bedding used. The value of a ton of this type of litter was too low in 2004 and 2016 to be viable for litter brokerage contracts. Even during years with high fertilizer prices (2008 and 2012) turkey brooder litter was rarely brokered since it was so dry. Such dry, low-density manure that was mostly pine shavings further reduced the amount of litter and fertilizer value that could be fit into a typical trailer.
Layer manure consistently had lower value per ton as compared to broiler and turkey grow-out litter. The lower value was due to the much higher moisture content which diluted the nutrient value of the manure. Layer litter was a viable brokerage option, but not for long haul distances.
Value of Poultry Manure Applied to Fields with Sufficient P2O5
A common situation is when soil-test results indicate that a field has sufficient P2O5 in the soil for not only the crop to be grown immediately, but also for the next crop in the rotation (soybeans for example). In such cases, the P2O5 in poultry manure has no value, and only the N and K2O in the manure can be used as a fertilizer substitute. The results for this situation are provided in Table 5.
Table 5. Variation in the value of various types of poultry manure ($/ton) based on N and K2O prices. It was assumed that soil-test indicate that no P2O5 was needed.
Year
Broiler (MC = 24%)
Layer (MC = 47%)
Turkey Grow-out (MC = 26%)
Turkey Brooder (MC = 14%)
2004
19.95*
10.80*
16.05*
10.50*
2008
49.59
26.02
38.39
24.40
2010
43.13
22.45*
33.06
20.85*
2012
53.58
27.84
40.98
25.80
2016
29.45
15.53*
22.94*
14.65*
* denotes values are two low to be part of a viable brokerage contract with typical brokerage prices being in the range of $20 to $25 per ton of manure.
The results indicated that when the N price was $0.30/lb and K2O averaged $0.15/lb in 2004 the value of poultry manure was too low to be moved at contact prices of $20 to $25 per ton. Also, at prices associated with 2008, 2010, and 2012 the value of broiler and turkey grow-out litter ranged from $33 to $54 per ton. Layer and turkey brooder litter were poor to marginal values for brokerage contacts when the P2O5 was not needed over the entire range of fertilizer prices.
Comparing the results for 2008 for broiler litter indicates that if P2O5 was not needed the value fell from $107.01/ton to $49.59/ton. That is, the value of the litter was reduced by 54%. The year with the next highest value, 2012, eliminating the need for P2O5 reduced the litter value by 47%. Large drops in litter value can also be observed for other types of poultry manure by comparing the values in Tables 4 and 5. These results indicate that the P2O5 contained in poultry manure is one of the largest sources of value.
Value of Poultry Manure as Only a Source of Nitrogen
The analysis was performed again to reflect the value of poultry manure if nitrogen is the only major nutrient needed based on soil-test results. The results given in Table 6 clearly show that nitrogen alone never provided enough value to support brokerage contracts.
Table 6. Variation in the value of various types of poultry manure ($/ton) when nitrogen is the only nutrient needed based on soil-test results.
Year
Broiler (MC = 24%)
Layer (MC = 47%)
Turkey Grow-out (MC = 26%)
Turkey Brooder (MC = 14%)
2004
11.40*
6.90*
10.50*
7.50*
2008
22.80*
13.80*
21.00*
15.00*
2010
18.62*
11.27*
17.15*
12.25*
2012
22.80*
13.80*
21.00*
15.00*
2016
14.06*
8.51*
12.95*
9.25*
* denotes values are two low to be part of a viable brokerage contract with typical brokerage prices being in the range of $20 to $25 per ton of manure.
Results for a Four-House Broiler Farm
The previous results demonstrated that high litter nutrient contents combined with strong fertilizer prices yielded litter values that were much greater than the amount paid to litter brokers. The results also demonstrated that P2O5 was one of the key contributors to litter value. The results of the analysis were applied to a four-house broiler farm to more clearly demonstrate the practical implications. Fertilizer prices from January 2019 in central South Carolina were also added to the analysis. The key assumptions and results are provided in Table 7.
Table 7. Application of analysis results to a 4-house broiler farm. Building size = 50 ft x 500 ft, litter production was assumed to be 580 tons/year (145 tons/house/yr) with a price of $10/ton paid to the broiler producer ($5800/year).
Year
N Price ($/lb)
P2O5 Price ($/lb)
K2O Price ($/lb)
Litter Value ($/ton)
Value of 580 tons of litter ($/Year)
Value from N (%)
Value from P2O5 (%)
Value From K2O (%)
Loss to Producer ($/Year)
2004
0.30
0.29
0.15
39.09
22,672
29
49
22
16,872*
2008
0.60
0.87
0.47
107.01
62,066
21
54
25
56,266
2010
0.49
0.55
0.43
79.43
46,069
23
46
31
40,269
2012
0.60
0.72
0.54
101.1
58,638
23
47
30
52,838
2016
0.37
0.26
0.27
46.61
27,034
30
37
33
21,234
2019**
0.38
0.54
0.31
67.75
39,295
21
53
26
33,495
* The price paid to a broiler producer in a brokerage contract ranges from 0 to $15/ton of litter. A value of $10 /ton of litter is common. The loss was calculated as: (litter value ($/ton) – $5800).
** Prices from central South Carolina obtained in January 2019.
The results indicate that the total value of litter on a four house farms that produces 580 tons of litter per year varied from $22,672 per year in 2004 to a maximum of $62,066 per year in 2008. Currently, the value in January 2019 was estimated to be $39,295/year. In every year, the P2O5 contained in the litter contributed the most to the litter value. This contrasts with the common assumption that the high P2O5 content in litter is a problem as compared to nitrogen. The results point out that the most value can be obtained from litter by giving phosphorous use the priority in manure management. Assuming that the broiler producer was consistently paid $10/ton of litter by the broker the annual litter income was only $5800 per year. If the producer had integrated broiler production with crop production using a rotation that would realize all the fertilizer value in the litter the total litter value would have served to improve profitability of the cropping enterprise. If the producer relied on brokerage as the sole manure management strategy then the annual loss to the producer ranged from $16,872 to $56,266 per year depending on fertilizer prices.
What these results also point to, but do not quantify, is the variation in risk. Producers who built farms using brokerage as the sole manure management plan during the years of high fertilizer prices gave away litter that was worth 3.9 to 10.7 times more than they were paid. They also have incurred a great risk since brokerage contracts typically last only one year, and crop producers who once were happy to purchase brokered litter are no longer consistent customers. Such producers are forced to quickly find other litter use alternatives often in areas where agricultural and forest land may not be close to the farm. Building broiler barns relying on annual brokerage contracts as the sole manure management option has been shown to be short sighted, and has a low probability of being economically or environmentally sustainable. Co-locating poultry production with some sort of profitable plant production enterprise that can use all of the fertilizer value in the litter is preferred. The next most viable alternative may be to use litter to produce high-quality compost for high volume, consistent markets.
What have we learned?
It was found that the value of poultry manure as a complete fertilizer (N,P,K) varied from $18.91 to $107.01 per ton depending of component prices (N, P, K), moisture content, and the amount of bedding used. If the receiving fields did not require phosphorous, based on soil test, the realized value ranged from $10.50 to $49.59 per ton. Finally, if soil-test indicate that N was the only major nutrient needed the value decreased to $7.50 to $22.80 per ton. During the same time frame, brokerage prices ranged from $20 to $50 per ton depending on haul distance and spreading service. However, most brokerage contracts were based on $20 to $25 per ton of manure. Several practical observations were made from the results:
Brokerage of litter may only be a viable alternative when the receiving cropland needs a complete fertilizer and when the N, P, and K contents of the manure are not diluted by water or bedding.
Manure brokerage is not economically sustainable if N is the only major nutrient needed by the receiving cropland.
Integrated farms that can use the manure produced by the poultry barns to fertilize their own cropland have the potential to reduce the legal and economic risk to the execution of a manure nutrient management plan.
Poultry farms that currently rely on litter brokerage as the only manure management plan are losing customers and need to look at other alternatives that provide a less risky and sustainable use for the mature produced.
Analysis of the impact of fluctuations in fertilizer price on litter produced from four broiler houses indicated that the full value of the litter ranged from $22,672 to $62,066 per year. The P2O5 contained in the litter accounted for the majority of the fertilizer value (37% to 54%). As a result, complete utilization of litter phosphorous in a crop rotation is the key to realizing the maximum value from litter.
Author
John P. Chastain, Ph.D., Professor and Extension Agricultural Engineer
Department of Agricultural Sciences, Agricultural Mechanization & Business Program, Clemson University, 245 McAdams Hall, Clemson, SC 29634-0312
jchstn@clemson.edu
Sources of Additional Information
Chastain, J.P., J.J. Camberato, and P. Skewes. (2001). Poultry Manure Production and Nutrient Content. Chapter 3B in Confined Animal Manure Managers Certification Program Manual: Poultry Version, Clemson University Extension, Clemson SC, pp 3b-1 to 3b-17. Available at: https://www.clemson.edu/extension/camm/manuals/poultry_toc.html
USDA-SC (2016). Dept of Ag Market News, South Carolina Crop Production Report Dec. 8.
Zublena, J.P., J.V. Baird, and J.P. Lilly. (1997). SoilFacts: Nutrient Content of Fertilizer and Organic Materials (AG-439-18).
Acknowledgements
This study was supported by the Clemson Extension Confined Animal Manure Managers Program.
The authors are solely responsible for the content of these proceedings. The technical information does not necessarily reflect the official position of the sponsoring agencies or institutions represented by planning committee members, and inclusion and distribution herein does not constitute an endorsement of views expressed by the same. Printed materials included herein are not refereed publications. Citations should appear as follows. EXAMPLE: Authors. 2019. Title of presentation. Waste to Worth. Minneapolis, MN. April 22-26, 2019. URL of this page. Accessed on: today’s date.
The recent development of the Newtrient on-line catalog (www.newtrient.com/Catalog/Technology-Catalog; see accompanying conference proceedings about the catalog) revealed the need to establish a set of environmental and farm operational based critical indicators (CIs). The indicators are useful in identifying manure treatment technologies that primarily best address dairy farm environmental sustainability but include some social aspects.
What did we do?
The Newtrient Technical Advancement Team, comprised of academic and industry professionals in dairy manure management, developed and implemented a novel methodology that identifies technologies that best address dairy farm sustainability mainly from an environmental but also from a social perspective. A project-amended process used by the International Organization for Standardization (ISO) was used as the basis for methodology development; the methodology is known as the Newtrient Evaluation and Assessment of Technology (NEAT) process.
For this work, six specific CIs were selected based on key environmental challenges/opportunities facing the dairy industry; they are: nitrogen recovery, phosphorus recovery, liquid manure storage requirements, greenhouse gas reduction, odor reduction, and pathogen reduction. A literature search was performed to evaluate 20 manure treatment technology types under five technology categories (Table 1).
A scoring system relative to the baseline condition of long-term (anaerobic) manure storage was developed and applied to each technology type and an appropriate relative score for each CI was determined. The NEAT results are presented in an easy to understand dashboard called the NEAT Matrix (Figure 1).
What have we learned?
Use of the NEAT process across the 20 manure treatment technology types confirms that there is no single technology type that can address all the environmental and operational indicators. An integrated manure management system that is comprised of strategically selected technologies may be assembled to move each dairy farm toward sustainability.
Table 1. Technology categories and associated manure treatment technology types evaluated using the Newtrient Evaluation and Assessment of Technology (NEAT).
Technology Category
Evaluated Technology Types
Primary solid-liquid separation
Centrifuge
Rotary screen
Screw press
Slope screen
Secondary solid-liquid separation
Clean water membrane
Evaporative technologies
Ultrafiltration membrane
Physical and biochemical stabilization
Active solids drying
Composting
Drum composter bedding
Surface aeration
Nutrient recovery
Ammonia stripping
Chemical flocculation
Struvite crystallization
Nitrification/denitrification
Energy recovery
Anaerobic digestion
Gasification
Hydrothermal Carbonization
Pyrolysis
Torrefaction
Figure 1. Generic example of the Newtrient Evaluation and Assessment of Technology (NEAT) Matrix
Future Plans
Future research in this area will continue to focus on using NEAT to evaluate integrated manure management systems designed specifically to achieve farm goals/needs.
Corresponding author, title, and affiliation
Curt Gooch, Environmental Systems Engineer, PRO-DAIRY Dairy Environmental System Program, Dept. of Animal Science, Cornell University.
cag26@cornell.edu
Other authors
Mark Stoermann (Newtrient, LLC), Garth Boyd (Context), Dana Kirk (Michigan State University), Craig Frear (Regenis), and Frank Mitloehner (UC Davis).
Additional information
Additional project information, is available on the Newtrient website: www.newtrient.com
Acknowledgements
Newtrient, LCC and the paper authors thank the following supporters of Newtrient: Agri-Mark, Inc., Dairy Farmers of America, Inc., Dairy Management Inc., Foremost Farms USA, Land O’Lakes, Inc., Maryland Virginia Milk Producers Cooperative Association, Inc., Michigan Milk Producers, National Milk Producers Federation, Prairie Farms Dairy, Inc., Select Milk Producers, Inc., Southeast Milk, Inc., St. Albans Cooperative Creamery, Tillamook County Creamery Association, and United Dairymen of Arizona
The authors are solely responsible for the content of these proceedings. The technical information does not necessarily reflect the official position of the sponsoring agencies or institutions represented by planning committee members, and inclusion and distribution herein does not constitute an endorsement of views expressed by the same. Printed materials included herein are not refereed publications. Citations should appear as follows. EXAMPLE: Authors. 2019. Title of presentation. Waste to Worth. Minneapolis, MN. April 22-26, 2019. URL of this page. Accessed on: today’s date.
Manage Cookie Consent
To provide the best experiences, we use technologies like cookies to store and/or access device information. Consenting to these technologies will allow us to process data such as browsing behavior or unique IDs on this site. Not consenting or withdrawing consent, may adversely affect certain features and functions.
Functional
Always active
The technical storage or access is strictly necessary for the legitimate purpose of enabling the use of a specific service explicitly requested by the subscriber or user, or for the sole purpose of carrying out the transmission of a communication over an electronic communications network.
Preferences
The technical storage or access is necessary for the legitimate purpose of storing preferences that are not requested by the subscriber or user.
Statistics
The technical storage or access that is used exclusively for statistical purposes.The technical storage or access that is used exclusively for anonymous statistical purposes. Without a subpoena, voluntary compliance on the part of your Internet Service Provider, or additional records from a third party, information stored or retrieved for this purpose alone cannot usually be used to identify you.
Marketing
The technical storage or access is required to create user profiles to send advertising, or to track the user on a website or across several websites for similar marketing purposes.