
Poultry Mortality Freezer Units: Better BMP, Better Biosecurity, Better Bottom Line.

Proceedings Home | W2W Home w2w17 logo

Purpose

Why Tackle Mortality Management?  It’s Ripe for Revolution.

The poultry industry has enjoyed a long run of technological and scientific advancements that have led to improvements in quality and efficiency.  To ensure its hard-won prosperity continues into the future, the industry has rightly shifted its focus to sustainability.  For example, much money and effort has been expended on developing better management methods and alternative uses/destinations for poultry litter.

In contrast, little effort or money has been expended to improve routine mortality management – arguably one of the most critical aspects of every poultry operation.  In many poultry producing areas of the country, mortality management methods have not changed in decades – not since the industry was forced to shift from the longstanding practice of pit burial.  Often that shift was to composting (with mixed results at best).  For several reasons – improved biosecurity being the most important/immediate – it’s time that the industry shift again.

The shift, however, doesn’t require reinventing the wheel, i.e., mortality management can be revolutionized without developing anything revolutionary.  In fact, the mortality management practice of the future owes its existence in part to a technology that was patented exactly 20 years ago by Tyson Foods – large freezer containers designed for storing routine/daily mortality on each individual farm until the containers are later emptied and the material is hauled off the farm for disposal.

Despite having been around for two decades, the practice of using on-farm freezer units has received almost no attention.  Little has been done to promote the practice or to study or improve on the original concept, which is a shame given the increasing focus on two of its biggest advantages – biosecurity and nutrient management.

Dusting off this old BMP for a closer look has been the focus of our work – and with promising results.  The benefits of hitting the reset button on this practice couldn’t be more clear:

  1. Greatly improved biosecurity for the individual grower when compared to traditional composting;
  2. Improved biosecurity for the entire industry as more individual farms switch from composting to freezing, reducing the likelihood of wider outbreaks;
  3. Reduced operational costs for the individual poultry farm as compared to more labor-intensive practices, such as composting;
  4. Greatly reduced environmental impact as compared to other BMPs that require land application as a second step, including composting, bio-digestion and incineration; and
  5. Improved quality of life for the grower, the grower’s family and the grower’s neighbors when compared to other BMPs, such as composting and incineration.

What Did We Do?

We basically took a fresh look at all aspects of this “old” BMP, and shared our findings with various audiences.

That work included:

  1. Direct testing with our own equipment on our own poultry farm regarding
    1. Farm visitation by animals and other disease vectors,
    2. Freezer unit capacity,
    3. Power consumption, and
    4. Operational/maintenance aspects;
  2. Field trials on two pilot project farms over two years regarding
    1. Freezer unit capacity
    2. Quality of life issues for growers and neighbors,
    3. Farm visitation by animals and other disease vectors,
    4. Operational and collection/hauling aspects;
  3. Performing literature reviews and interviews regarding
    1. Farm visitation by animals and other disease vectors
    2. Pathogen/disease transmission,
    3. Biosecurity measures
    4. Nutrient management comparisons
    5. Quality of life issues for growers and neighbors
  4. Ensuring the results of the above topics/tests were communicated to
    1. Growers
    2. Integrators
    3. Legislators
    4. Environmental groups
    5. Funding agencies (state and federal)
    6. Veterinary agencies (state and federal)

What Have We Learned?

The breadth of the work at times limited the depth of any one topic’s exploration, but here is an overview of our findings:

  1. Direct testing with our own equipment on our own poultry farm regarding
    1. Farm visitation by animals and other disease vectors
      1. Farm visitation by scavenger animals, including buzzards/vultures, raccoons, foxes and feral cats, that previously dined in the composting shed daily slowly decreased and then stopped entirely about three weeks after the farm converted to freezer units.
      2. The fly population was dramatically reduced after the farm converted from composting to freezer units.  [Reduction was estimated at 80%-90%.]
    2. Freezer unit capacity
      1. The test units were carefully filled on a daily basis to replicate the size and amount of deadstock generated over the course of a full farm’s grow-out cycle.
      2. The capacity tests were repeated over several flocks to ensure we had accurate numbers for creating a capacity calculator/matrix, which has since been adopted by the USDA’s Natural Resources Conservation Service to determine the correct number of units per farm based on flock size and finish bird weight (or number of grow-out days) in connection with the agency’s cost-share program.
    3. Power consumption
      1. Power consumption was recorded daily over several flocks and under several conditions, e.g., during all four seasons and under cover versus outside and unprotected from the elements.
      2. Energy costs were higher for uncovered units and obviously varied depending on the season, but the average cost to power one unit is only 90 cents a day.  The total cost of power for the average farm (all four units) is only $92 per flock.  (See additional information for supporting documentation and charts.)
    4. Operational/maintenance aspects;
      1. It was determined that the benefits of installing the units under cover (e.g., inside a small shed or retrofitted bin composter) with a winch system to assist with emptying the units greatly outweighed the additional infrastructure costs.
      2. This greatly reduced wear and tear on the freezer component of the system during emptying, eliminated clogging of the removable filter component, as well as provided enhanced access to the unit for periodic cleaning/maintenance by a refrigeration professional.
  2. Field trials on two pilot project farms over two years regarding
    1. Freezer unit capacity
      1. After tracking two years of full farm collection/hauling data, we were able to increase the per unit capacity number in the calculator/matrix from 1,500 lbs. to 1,800 lbs., thereby reducing the number of units required per farm to satisfy that farm’s capacity needs.
    2. Quality of life issues for growers and neighbors
      1. Both farms reported improved quality of life, largely thanks to the elimination or reduction of animals, insects and smells associated with composting.
    3. Farm visitation by animals and other disease vectors
      1. Both farms reported elimination or reduction of the scavenging animals and disease-carrying insects commonly associated with composting.
    4. Operational and collection/hauling aspects
      1. With the benefit of two years of actual use in the field, we entirely re-designed the sheds used for housing the freezer units.
      2. The biggest improvements were created by turning the units so they faced each other rather than all lined up side-by-side facing outward.  (See additional information for supporting documentation and diagrams.)  This change then meant that the grower went inside the shed (and out of the elements) to load the units.  This change also provided direct access to the fork pockets, allowing for quicker emptying and replacement with a forklift.
  3. Performing literature reviews and interviews regarding
    1. Farm visitation by animals and other disease vectors
      1. More research confirming the connection between farm visitation by scavenger animals and the use of composting was recently published by the USDA National Wildlife Research Center:
        1. “Certain wildlife species may become habituated to anthropogenically modified habitats, especially those associated with abundant food resources.  Such behavior, at least in the context of multiple farms, could facilitate the movement of IAV from farm to farm if a mammal were to become infected at one farm and then travel to a second location.  …  As such, the potential intrusion of select peridomestic mammals into poultry facilities should be accounted for in biosecurity plans.”
        2. Root, J. J. et al. When fur and feather occur together: interclass transmission of avian influenza A virus from mammals to birds through common resources. Sci. Rep. 5, 14354; doi:10.1038/ srep14354 (2015) at page 6 (internal citations omitted; emphasis added).
    2. Pathogen/disease transmission,
      1. Animals and insects have long been known to be carriers of dozens of pathogens harmful to poultry – and to people.  Recently, however, the USDA National Wildlife Research Center demonstrated conclusively that mammals are not only carriers – they also can transmit avian influenza virus to birds.
        1. The study’s conclusion is particularly troubling given the number and variety of mammals and other animals that routinely visit composting sheds as demonstrated by our research using a game camera.  These same animals also routinely visit nearby waterways and other poultry farms increasing the likelihood of cross-contamination, as explained in this the video titled Farm Freezer Biosecurity Benefits.
        2. “When wildlife and poultry interact and both can carry and spread a potentially damaging agricultural pathogen, it’s cause for concern,” said research wildlife biologist Dr. Jeff Root, one of several researchers from the National Wildlife Research Center, part of the USDA-APHIS Wildlife Services program, studying the role wild mammals may play in the spread of avian influenza viruses.
    3. Biosecurity measures
      1. Every day the grower collects routine mortality and stores it inside large freezer units. After the broiler flock is caught and processed, but before the next flock is started – i.e. when no live birds are present,  a customized truck and forklift empty the freezer units and hauls away the deadstock.  During this 10- to 20- day window between flocks biosecurity is relaxed and dozens of visitors (feed trucks, litter brokers, mortality collection) are on site in preparation for the next flock.
        1. “Access will change after a production cycle,” according to a biosecurity best practices document (enclosed) from Iowa State University. “Empty buildings are temporarily considered outside of the [protected area and even] the Line of Separation is temporarily removed because there are no birds in the barn.”
    4. Nutrient management comparisons
      1. Research provided by retired extension agent Bud Malone (enclosed) provided us with the opportunity to calculate nitrogen and phosphorous numbers for on-farm mortality, and therefore, the amount of those nutrients that can be diverted from land application through the use of freezer units instead of composting.
      2. The research (contained in an enclosed presentation) also provided a comparison of the cost-effectiveness of various nutrient management BMPs – and a finding that freezing and recycling is about 90% more efficient than the average of all other ag BMPs in reducing phosphorous.
    5. Quality of life issues for growers and neighbors
      1. Local and county governments in several states have been compiling a lot of research on the various approaches for ensuring farmers and their residential neighbors can coexist peacefully.
      2. Many of the complaints have focused on the unwanted scavenger animals, including buzzards/vultures, raccoons, foxes and feral cats, as well as the smells associated with composting.
      3. The concept of utilizing sealed freezer collection units to eliminate the smells and animals associated with composting is being considered by some government agencies as an alternative to instituting deeper and deeper setbacks from property lines, which make farming operations more difficult and costly.

Future Plans

We see more work on three fronts:

  • First, we’ll continue to do monitoring and testing locally so that we may add another year or two of data to the time frames utilized initially.
  • Second, we are actively working to develop new more profitable uses for the deadstock (alternatives to rendering) that could one day further reduce the cost of mortality management for the grower.
  • Lastly, as two of the biggest advantages of this practice – biosecurity and nutrient management – garner more attention nationwide, our hope would be to see more thorough university-level research into each of the otherwise disparate topics that we were forced to cobble together to develop a broad, initial understanding of this BMP.

Corresponding author (name, title, affiliation)

Victor Clark, Co-Founder & Vice President, Legal and Government Affairs, Farm Freezers LLC and Greener Solutions LLC

Corresponding author email address

victor@farmfreezers.com

Other Authors

Terry Baker, Co-Founder & President, Farm Freezers LLC and Greener Solutions LLC

Additional Information

https://rendermagazine.com/wp-content/uploads/2019/07/Render_Oct16.pdf

Farm Freezer Biosecurity Benefits

One Night in a Composting Shed

www.farmfreezers.com

Transmission Pathways

Avian flu conditions still evolving (editorial)

USDA NRCS Conservation fact sheet Poultry Freezers

Nature.com When fur and feather occur together: interclass transmission of avian influenza A virus from mammals to birds through common resources

How Does It Work? (on-farm freezing)

Influenza infections in wild raccoons (CDC)

Collection Shed Unit specifications

Collection Unit specifications

Freezing vs Composting for Biosecurity (Render magazine)

Manure and spent litter management: HPAI biosecurity (Iowa State University)

Acknowledgements

Bud Malone, retired University of Delaware Extension poultry specialist and owner of Malone Poultry Consulting

Bill Brown, University of Delaware Extension poultry specialist, poultry grower and Delmarva Poultry Industry board member

Delaware Department of Agriculture

Delaware Nutrient Management Commission

Delaware Office of the Natural Resources Conservation Service

Maryland Office of the Natural Resources Conservation Service

The authors are solely responsible for the content of these proceedings. The technical information does not necessarily reflect the official position of the sponsoring agencies or institutions represented by planning committee members, and inclusion and distribution herein does not constitute an endorsement of views expressed by the same. Printed materials included herein are not refereed publications. Citations should appear as follows. EXAMPLE: Authors. 2017. Title of presentation. Waste to Worth: Spreading Science and Solutions. Cary, NC. April 18-21, 2017. URL of this page. Accessed on: today’s date.
PA Finishing Swine Barn Experience: Changing from Mortality Burial to a Michigan Style Composting Barn

Proceedings Home W2W Home w2w17 logo

Purpose

In the spring of 2014, the farmer with a 2020 finishing pig barn, wanted to change from burial of mortality to composting the mortality. We will document the change and the use of the composting barn from July 2014 to Dec 2016.

What did we do?

This 2020 finish pig barn space has about 3% mortality and expects about 250 deaths per year to compost. We discussed building a PA Michigan single wall compost barn design. The farmer built a 24×40 compost barn, with a 3 feet center dividing wall. The barn was completed in the summer of 2014 and we will track the pig barn turns and compost barn mortality loadings from July 2014 to December 2016. The barn has used about 56 cubic yards of woodchips/ bark mulch the first year and then replaced with about 40 cubic yards of sawdust for the second year.

The compost temperatures have reached 130 Degrees F and the farmer is very pleased with how the barn works and how he can mix and turn the compost. The presentation will cover barn costs, barn design and sawdust mortality loading and turning.

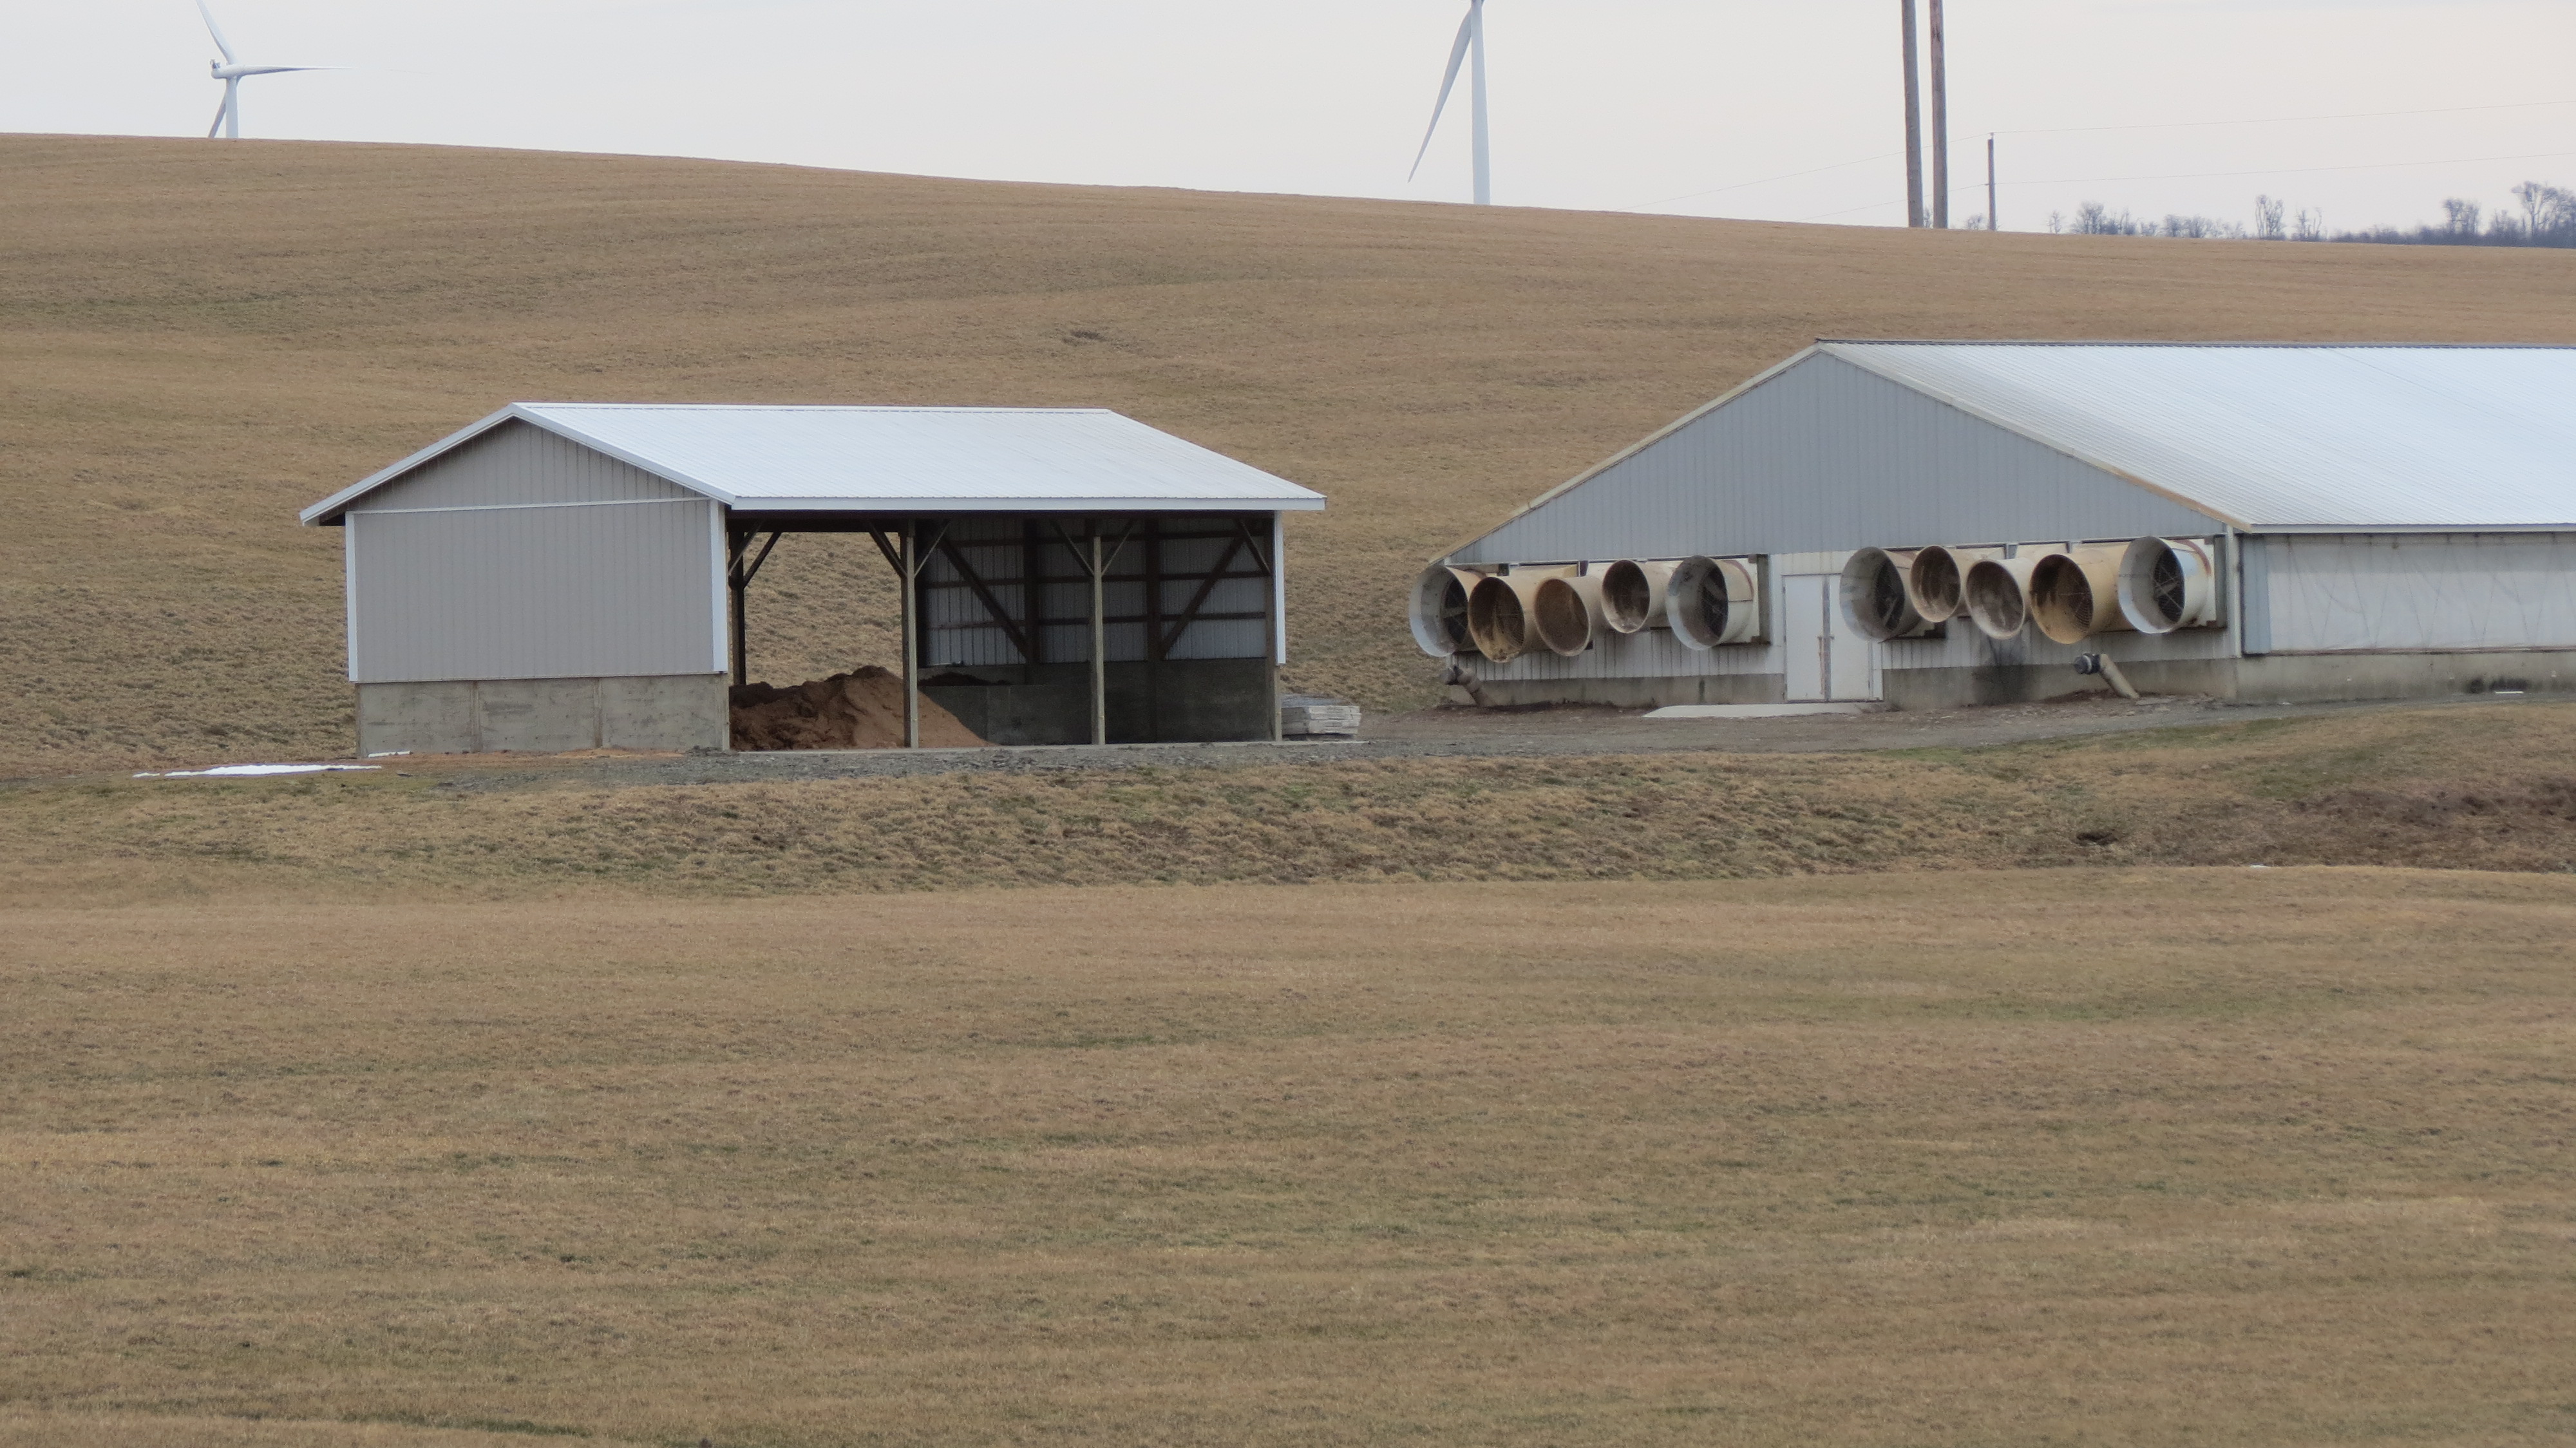
Field with windmills and barn
PA Michigan compost barn built at the end of the hog barn

Compost heap under shelter
Excellent example of free flowing air into the compost piles while
having a center push up wall to help turn the piles

What have we learned?

We have documented the farmers use of the barn, the mortality rates, compost sawdust and woodchip use, and mixing schedules. We have also documented the mortality cost rates for this farm.

Future Plans

We will highlight this PA Michigan compost barn type to other pig barns and document the use of them in Pennsylvania.

Corresponding author, title, and affiliation

J Craig Williams

Corresponding author email

Jcw17@psu.edu

Additional information

http://extension.psu.edu/animals/health/composting

http://msue.anr.msu.edu/program/info/managing_animal_mortalities

The authors are solely responsible for the content of these proceedings. The technical information does not necessarily reflect the official position of the sponsoring agencies or institutions represented by planning committee members, and inclusion and distribution herein does not constitute an endorsement of views expressed by the same. Printed materials included herein are not refereed publications. Citations should appear as follows. EXAMPLE: Authors. 2017. Title of presentation. Waste to Worth: Spreading Science and Solutions. Cary, NC. April 18-21, 2017. URL of this page. Accessed on: today’s date.
Organizing demonstrations and tours for Government officials and Extension on Animal Mortality Management

Proceedings Home W2W Home w2w17 logo

Purpose

Provide some discussion on putting together Tour and Demonstration educational events. To Provide real life demonstrations and educational opportunities dealing with Mortality management.

What did we do?

The agent participated on a multi-state and multi country steering committee to organize and host an international symposium on Animal Mortality and Disposal Management. This was the 5th symposium and had 179 registered attendees from 11 different countries: Australia, Canada, China, Georgia, Korea, New Zealand, Nigeria, the UK, the US, Tunisia, and Vietnam.

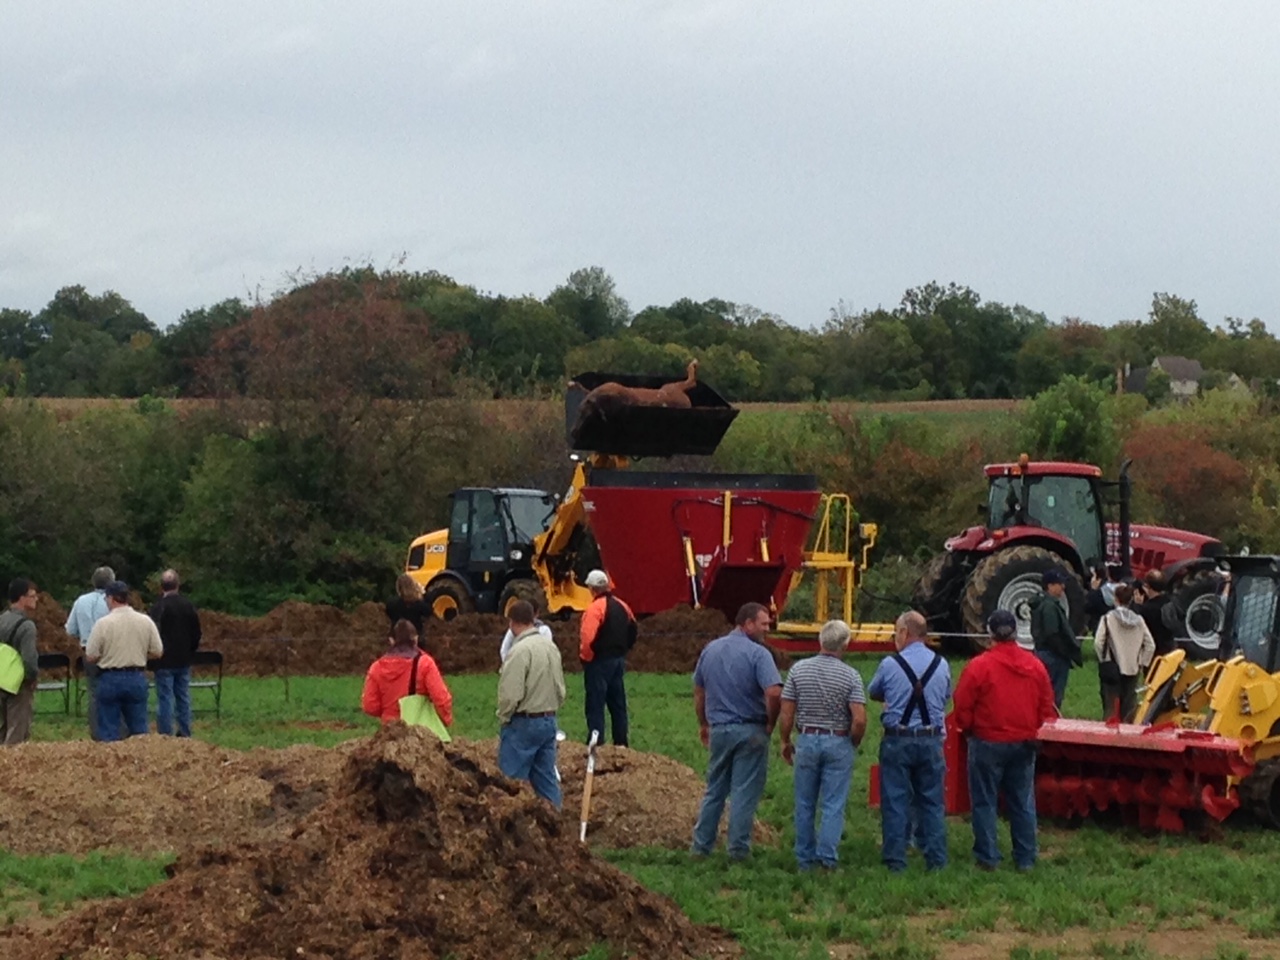
The agent served as the host state coordinator (Penn), the 3 bus tour coordinator and the demonstration’s chairperson. Demonstrations included high density foaming, compost pile building and turning, environmental grinder processors, Clean Harbor Industries,  truck wash stations, and proper euthanasia with cap and bolt guns. The agent will list the success and challenges of these types of demonstrations and educational events. Results are from the 5th International Symposium on Managing Animal Mortality, Products, and By-products, and Associated Health Risk: Connecting Research, Regulations and Response at the Southeast Agricultural Research and Extension Center on Wednesday, September 30, 2015.

Moving horse for mortality composting
Examples of demonstrations during the field day

What have we learned?

Excellent industry tours and Farm tours and Demonstrations are an excellent learning opportunity. All Parties including Extension, Farmers, Industry and government personnel can benefit from hands on education.  Those in attendance gained skills and knowledge to be able to host their own training sessions and to be better prepared to handle animal mortality outbreaks and events in their own state.  They gained a first hand experience on pile building and related technologies for this type of event.

Demo with tractor covering mortality composting pile
Turning of a 60 day compost pile

Future Plans

The International Committee on Animal Mortality and Waste Products is a collection of University researchers and educators, State Department of Agriculture, Federal Homeland Security and Environmental Protection Agency personnel. The committee plans to meet for future International Symposiums as needed.

http://animalmortmgmt.org/symposium/contributors/

Corresponding author, title, and affiliation

J Craig Williams, County Agent, Penn State Extension

Corresponding author email

jcw17@psu.edu

Additional information

Conference website

http://animalmortmgmt.org/

The authors are solely responsible for the content of these proceedings. The technical information does not necessarily reflect the official position of the sponsoring agencies or institutions represented by planning committee members, and inclusion and distribution herein does not constitute an endorsement of views expressed by the same. Printed materials included herein are not refereed publications. Citations should appear as follows. EXAMPLE: Authors. 2017. Title of presentation. Waste to Worth: Spreading Science and Solutions. Cary, NC. April 18-21, 2017. URL of this page. Accessed on: today’s date.

Spotlight on Manure Management in North Carolina and the Atlantic Coastal Plains


Proceedings Home W2W Home w2w17 logo

Purpose 

To provide information about commonly-found manure management systems and approaches in North Carolina and the Coastal Plains, and discuss opportunities for technological innovation in the areas of manure management and nutrient recovery/utilization. Hear from a diverse panel of researchers, animal agriculture producers, and agency representatives who will provide background on the environmental conditions of the region and discuss specific technical considerations for innovative research and development. Learn about what has and hasn’t worked in past attempts to recover nutrients at animal agriculture farms in the area, and about the exciting possibilities for innovation in the U.S. Environmental Protection Agency’s (EPA’s) Nutrient Recycling Challenge (www.nutrientrecyclingchallenge.org).

What did we do? 

N/A

What have we learned? 

N/A

Future Plans 

N/A

Corresponding author, title, and affiliation 

Joseph Ziobro, Physical Scientist, U.S. Environmental Protection Agency; Hema Subramanian, Environmental Protection Specialist, U.S. Environmental Protection Agency

Corresponding author email 

ziobro.joseph@epa.gov; subramanian.hema@epa.gov

Other authors

Dr. John Classen, Associate Professor and Director of Graduate Programs, College of Biological and Agricultural Engineering at North Carolina State University

Dr. Kelly Zering, Professor of Agricultural and Resource Economics, North Carolina State University

Additional information

Session Agenda

  1. Background, history, and technical information about manure management in North Carolina and the Coastal Plains

Presenter: Dr. John Classen, Associate Professor and Director of Graduate Programs, College of Biological and Agricultural Engineering at North Carolina State University

  1. Lessons Learned from the Smithfield Agreement

Presenter: Dr. Kelly Zering, Professor of Agricultural and Resource Economics, North Carolina State University

  1. Panel: Challenges and Opportunities around Manure Management Systems

Moderator: Hema Subramanian

Panel to include the above speakers plus representatives from the local animal agriculture industry, North Carolina Department of Agriculture and Consumer Services, North Carolina Department of Environmental Quality, and U.S. Environmental Protection Agency. 

Gypsum as a Best Management Practice for Reducing P loss from Agricultural Fields


Proceedings Home W2W Home w2w17 logo

Purpose

Phosphorus loss from agricultural fields fertilized with poultry litter may contribute to eutrophication of nearby rivers, lakes, and streams. It has been suggested that gypsum can be used as a soil amendment to reduce P loss from these fields. Also, a new USDA-NRCS National Conservation Practice Standard 333 “Amending Soil Properties with Gypsum Products” has recently been created to promote conservation through gypsum use.

What Did We Do?

Field studies were conducted to evaluate the influence of gypsum on reducing P loss from both hayfields and row crops fertilized with poultry litter. Simulated rainfall was created to evaluate the effectiveness of gypsum on reducing P loss in successive runoff events occurring after poultry litter applications during the growing season.

What Have We Learned?

Results showed that gypsum can reduce the loss of dissolved P with surface water runoff from both hayfields and row crop systems. In addition, applying gypsum to grass buffer strips at the edge of an agricultural field could also be an effective management practice for P loss reduction. Gypsum reduced dissolved P loss in successive runoff events after poultry litter application regardless of timing, suggesting that the effect is persistent and will not diminish over a growing season. These findings suggest that gypsum use as a soil amendment has promise for reducing P loss from agricultural fields.   

Future Plans

Future plans are to determine the most effective gypsum rate needed to reduce P loss from both row crop and hayfields systems.

Corresponding author (name, title, affiliation)

Dexter B. Watts, Research Soil Scientist, USDA-Agricultural Research Service located at the National Soil Dynamics Laboratory in Auburn, AL

Corresponding author email address  

Dexter.Watts@ars.usda.gov

Other Authors 

H. Allen Torbert, Research Soil Science, USDA-Agricultural Research Service located at the National Soil Dynamics Laboratory in Auburn, AL.

Additional Information

Watts, D.B., J.B. Hess, S.F. Biligili, H.A. Torbert, J.L. Sibley, and J.D. Davis. 2017. Flue gas desulfurization gypsum; Its effectiveness as an alternative bedding material for broiler production. Journal of Applied Poultry Research. 26:50-59.

Watts, D.B., G.B. Runion, and K.S, Balkcom. 2017. Nitrogen fertilizer sources and tillage effects on cotton growth, yield and fiber quality. Field Crops Research. 201:184-191.

Watts, D.B., and H.A. Torbert. 2017. Influence of three application yearly application yearly application of FGD gypsum and poultry litter on surface water runoff. Soil Science. 182:18-27.

Torbert, H.A., R.L. Chaney, and D.B. Watts. 2017. Potential adherence of FGD gypsum to forage as a consideration for excessive ingestion by ruminants. Journal of Environmental Quality. doi:10.2134/jeq2016.07.0279 (In Press).

Watts, D.B., and H.A. Torbert. 2016. Influence of FGD gypsum on reducing soluble P in successive runoff events from a Coastal Plain Bermudagrass Pasture. Journal of Environmental Quality. 45:1071-1079.

Watts, D.B. and W.A. Dick. 2014. Sustainable uses of FGD gypsum in agricultural Systems. J. Environ. Qual. 43:253-262.

Chen, L., D. Kost, Y. Tian, X. Guo, D.B. Watts, D. Norton, R.P. Wolkowski, and W.A. Dick. 2014. Effects of gypsum on heavy metals in soils and earthworms. J. Environ. Qual. 43:263-272.

Torbert, H.A. and D.B. Watts. 2014. Impact of FGD Gypsum application on water quality in a Coastal Plain soil. J.  Environ. Qual. 43:273-280.

Watts, D.B. H.A. Torbert, and C.C. Mitchell. 2013. Gypsum use to reduce P loss for agricultural fields. Alabama Experiment Station Publication. Bulletin no: 680 availiable at http://aurora.auburn.edu/bitstream/handle/11200/44267/Gypsum%20Bulletin_2013.pdf?sequence=2

             Watts, D.B. and H.A. Torbert. 2009. Impact of gypsum applied to buffer strips on reducing
              soluble P in surface water runoff. J. Envron. Qual. 38:1511-1517.

The authors are solely responsible for the content of these proceedings. The technical information does not necessarily reflect the official position of the sponsoring agencies or institutions represented by planning committee members, and inclusion and distribution herein does not constitute an endorsement of views expressed by the same. Printed materials included herein are not refereed publications. Citations should appear as follows. EXAMPLE: Authors. 2017. Title of presentation. Waste to Worth: Spreading Science and Solutions. Cary, NC. April 18-21, 2017. URL of this page. Accessed on: today’s date.
Characterization of litter produced in turkey production operations in Virginia

Proceedings Home W2W Home w2w17 logo

Purpose

Turkey production is a partnership between companies (integrators) and private farmers (contractors). The companies own the birds while the farmers raise birds and manage litter. Generally, a turkey farm makes two products, birds for meat and litter. Mature birds are harvested by the companies for processing at designated regional plants. The litter is rich in nitrogen (N), phosphorus (P) and potassium (K), and is usually removed from production houses and used as fertilizer for crops and forage production. If not used and/or managed properly, nutrients in turkey litter, like any other animal manure in general, may result in water quality degradation, especially in sensitive ecosystems such as the Chesapeake Bay (Bay).

This project was initiated to gather locally based turkey litter generation and nutrient content data to develop equations and coefficients to be used as input in Phase 6.0 Chesapeake Bay Program Watershed Model. Using equations derived from locally based data, simultaneously improves the accuracy and quality of annual nutrients (N, P) mass estimates inputs and provides better representation of turkey production operations in the Phase 6.0 Bay watershed modeling tools. The results reported here focused on the mass generation rate and nutrient content of litter from turkey production systems in Virginia.

What did we do?

The first step was to determine and describe the common turkey production systems and bird types in Virginia, and to a large extent, the Bay watershed. Two production systems (1- and 2-stage) and five (hen, heavy hen, heavy tom, breeders, brooder/poult) bird types were identified. Then, we used a combination of farmer and integrator surveys to identify bird and production type for the period 2012 to 2016. The information collected during the survey included bird and production type, number of birds placed, number of birds harvested, average bird harvest/market weights, mass of litter removed from houses at total clean out, number of flocks per cleanout, and number of flocks raised per year. The mass of litter generated was estimated by relating the estimated bird numbers, mass of litter removed from buildings, and average bird market weight. Historical nutrient data was obtained from the manure nutrient management program database maintained by the Virginia Department of Conservation and Recreation. Statistical analysis was conducted on the data collected to determine if there was any differences in mass of litter generated and litter nutrient concentrations. A one-way analysis of variance (ANOVA) was performed to test for significant differences group means and the Turkey’s HSD test to identify which groups were different. Differences were considered significant at p < 0.05.

What have we learned?

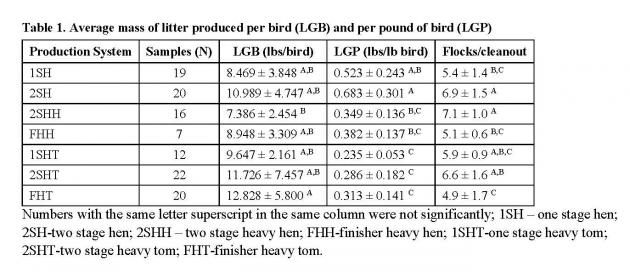
We found differences in the mass of litter generated among bird types. Consequently, bird types were grouped based on the statistical similarity of their means and averages of litter generation nutrients for the groups calculated and proposed as factors (Table 1) to use in calculated annual nutrient loads in the Phase 6.0 Chesapeake Bay Program Watershed Model. The overall mean for mass of litter in pounds (lbs) generated per bird and litter generated per pound of bird were 10.263 (±4.973) and 0.407 (±0.198), respectively.

table 1 average mass of litter produced per bird

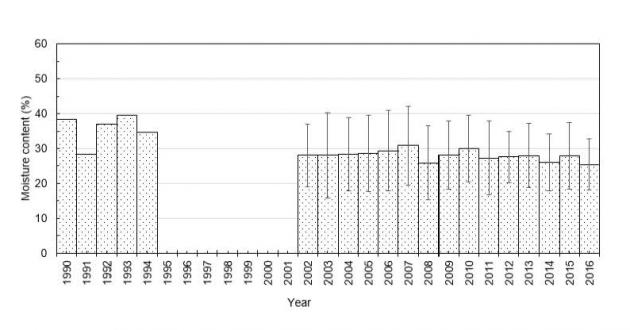
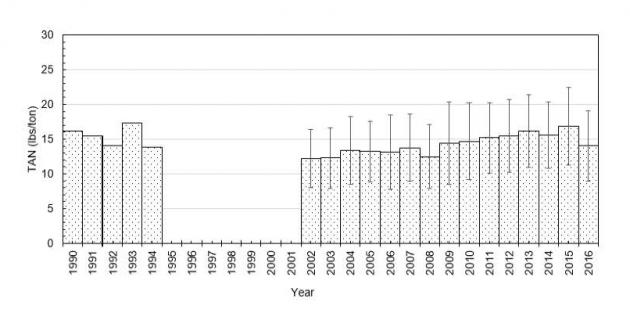
Litter generation rates per bird are about 48 to 77 % less than ASABE 2005 tabulated values. Nutrient content of litter has remained stable since 2000 (Figure 1). The ratio of ammonia nitrogen to total nitrogen and total nitrogen to total phosphorus has remained stable at 0.21 and 1.37, respectively. Conversely, the moisture content has been stable and seem to be dropping over time (Figure 1).

Figure 1. Turkey litter nitrogen (TKN), ammonium (TAN), phosphorus (TP), and moisture content from operations in Virginia between 1990 and 2016.

Figure 1. Turkey litter nitrogen (TKN), ammonium (TAN), phosphorus (TP), and moisture content from operations in Virginia between 1990 and 2016.

Figure 1. Turkey litter nitrogen (TKN), ammonium (TAN), phosphorus (TP), and moisture content from operations in Virginia between 1990 and 2016.

Figure 1. Turkey litter nitrogen (TKN), ammonium (TAN), phosphorus (TP), and moisture content from operations in Virginia between 1990 and 2016.

Figure 1. Turkey litter nitrogen (TKN), ammonium (TAN), phosphorus (TP), and moisture content from operations in Virginia between 1990 and 2016.

Future Plans

Continue data collection to characterize turkey litter generation and nutrient contents in Virginia and expanded to other regions of the Bay watershed. Establish an ongoing system beyond the present study to accept farm specific bird production data summarized to eliminate disclosure of confidential business information and used as the foundation for improving litter generation rate and nutrient concentration goals.

Corresponding author, title, and affiliation

Jactone A. Ogejo, Biological Systems Engineering Department, Virginia Tech

Corresponding author email

arogo@vt.edu

Acknowledgements

Timothy Sexton and Bobby Long, Virginia Department of Conservation and Recreation; Mark Dubin, Chesapeake Bay Program; Jordan Kristoff and Austin Shifflet, Virginia Tech

The authors are solely responsible for the content of these proceedings. The technical information does not necessarily reflect the official position of the sponsoring agencies or institutions represented by planning committee members, and inclusion and distribution herein does not constitute an endorsement of views expressed by the same. Printed materials included herein are not refereed publications. Citations should appear as follows. EXAMPLE: Authors. 2017. Title of presentation. Waste to Worth: Spreading Science and Solutions. Cary, NC. April 18-21, 2017. URL of this page. Accessed on: today’s date.

Fertilizer Value of Nitrogen Captured using Ammonia Scrubbers

Proceedings Home W2W Home w2w17 logo

Purpose

Over half of the nitrogen (N) excreted from broiler chickens is lost to the atmosphere as ammonia (NH3) before the manure is removed from the barns, resulting in air and water pollution and the loss of a valuable fertilizer resource. A two stage exhaust scrubber (ARS Air Scrubber) was developed by scientists with USDA/ARS to trap ammonia and dust emissions from poultry and swine facilities. One objective of this study was to determine the fertilizer efficiency of N, which is mainly present as ammonium (NH4), captured from the exhaust air from poultry houses using acid scrubbers, when applied to forages. The second objective was to determine if any of the scrubber solutions resulted in a decrease in phosphorus (P) runoff or soil test P.

What did we do?

This study was conducted using 24 small plots (1.52 x 6.10 m) located on a Captina silt loam soil at the University of Arkansas Agricultural Experiment Station. There were six treatments in a randomized block design with four replications per treatment. The treatments were: (1) unfertilized control, (2) potassium bisulfate (KHSO4) scrubber solution, (3) alum (Al2(SO4)3.14H2O) scrubber solution, (4) sulfuric acid (H2SO4) scrubber solution, (5) sodium bisulfate (NaHSO4) scrubber solution and (6) ammonium nitrate (NH4NO3) fertilizer dissolved in water. The four scrubber solutions, which were obtained from scrubbers attached to exhaust fans on commercial poultry houses, and the ammonium nitrate solution were all applied at an application rate equivalent to 112 kg N ha-1. Forage yields were measured periodically throughout the growing season. A rainfall simulation study was conducted five months after the solutions were applied to determine potential effects on P runoff.

ARS air scrubber in Arkansas

Applying scrubber solutions

Rainfall simulation

What have we learned?

Forage yields (Mg ha-1) followed the order: potassium bisulfate (7.61), sodium bisulfate (7.46) > ammonium nitrate (6.87), alum (6.72), sulfuric acid (6.45) > unfertilized control (5.12). These data indicate that forage yields with scrubber solutions can be equal to or even greater than that obtained with equivalent amounts of N applied as commercial fertilizer. This is likely due to the presence of other nutrients, such as K in acid salts, like potassium bisulfate. Nitrogen uptake followed similar trends as yields, although there were no significant differences among N sources.


Total P loads in runoff were 37, 25, 20, 19, 17, and 14 g P ha-1, for sulfuric acid, potassium bisulfate, sodium bisulfate, unfertilized control, ammonium nitrate, and alum. The alum solution resulted in significantly lower P loads than H2SO4. This was likely due to a decrease in the water extractable P (WEP) in the soil, since alum was also shown to significantly reduce WEP compared to the unfertilized control. None of the treatments affected Mehlich III extractable P.


Future Plans

Currently research is underway on using acid-tolerant nitrifying bacteria to generate the acidity needed to capture ammonia in the exhaust air from animal rearing facilities.


Corresponding author, title, and affiliation

Philip Moore, Soil Scientist, USDA/ARS

Corresponding author email

philipm@uark.edu

Other authors

Jerry Martin, USDA/ARS, Fayetteville, AR; Hong Li, University of Delaware

Additional information

Philip Moore
Plant Sciences 115
University of Arkansas
Fayetteville, AR 72701

Moore, P.A., Jr., R. Maguire, M. Reiter, J. Ogejo, R. Burns, H. Li, D. Miles and M. Buser. 2013.  Development of an acid scrubber for reducing ammonia emissions from animal rearing facilities.  Proc. Waste to Worth Conference. http://lpelc.org/development-of-an-acid-scrubber-for-reducing-ammonia-emissions-from-animal-rearing-facilities.

The authors are solely responsible for the content of these proceedings. The technical information does not necessarily reflect the official position of the sponsoring agencies or institutions represented by planning committee members, and inclusion and distribution herein does not constitute an endorsement of views expressed by the same. Printed materials included herein are not refereed publications. Citations should appear as follows. EXAMPLE: Authors. 2017. Title of presentation. Waste to Worth: Spreading Science and Solutions. Cary, NC. April 18-21, 2017. URL of this page. Accessed on: today’s date.
Developing a Comprehensive Nutrient Management Plan (CNMP)

Proceedings Home W2W Home w2w17 logo

Purpose

Livestock producers are presented with a number of challenges and opportunities. Developing a quality Comprehensive Nutrient Management Plan (CNMP) can effectively help landowners address natural resource concerns related to soil erosion, water quality, and air quality from manure management. As livestock operations continue to expand and concentrate in certain parts of the country, utilizing a CNMP becomes even more important. Following the NRCS 9-step planning process is critical in developing a good plan. Effective communication is a key element between all parties involved in the planning process. A CNMP documents the decisions made by the landowner for the farmstead area, crop and pasture area, and nutrient management. Information will cover the elements essential for developing a quality CNMP.

What did we do?

Since the CNMP documents the records of decisions by the landowner, it has to be organized in such a fashion that it is understandable to and usable by the landowner. The CNMP is the landowner’s plan. Therefore, the role of the planner is to help landowners do the things that will most benefit them and the resources in the long run. This will take both time and effort. To provide consistency with other conservation planning efforts within NRCS, CNMPs following the same process outlined in the National Planning Procedures Handbook. There are several items that are essential for a quality CNMP to be developed:

• Have a good understanding of potential resource concerns especially soil erosion, water quality and air quality.

• Make the appropriate number of site visits. Trying to do this from the office will likely lead to a poor quality CNMP that may not be implemented.

• Address resource concerns for the Farmstead and Crop and Pasture areas.

• Ensure that all nutrient sources are addressed.

• Follow the 9 steps of planning.

• Decisions are agreed upon by the landowner. The CNMP reflects the landowner’s record of decisions.

• Follow-up to address any questions or concerns.

• Update as necessary. A CNMP is not a static document.

Field

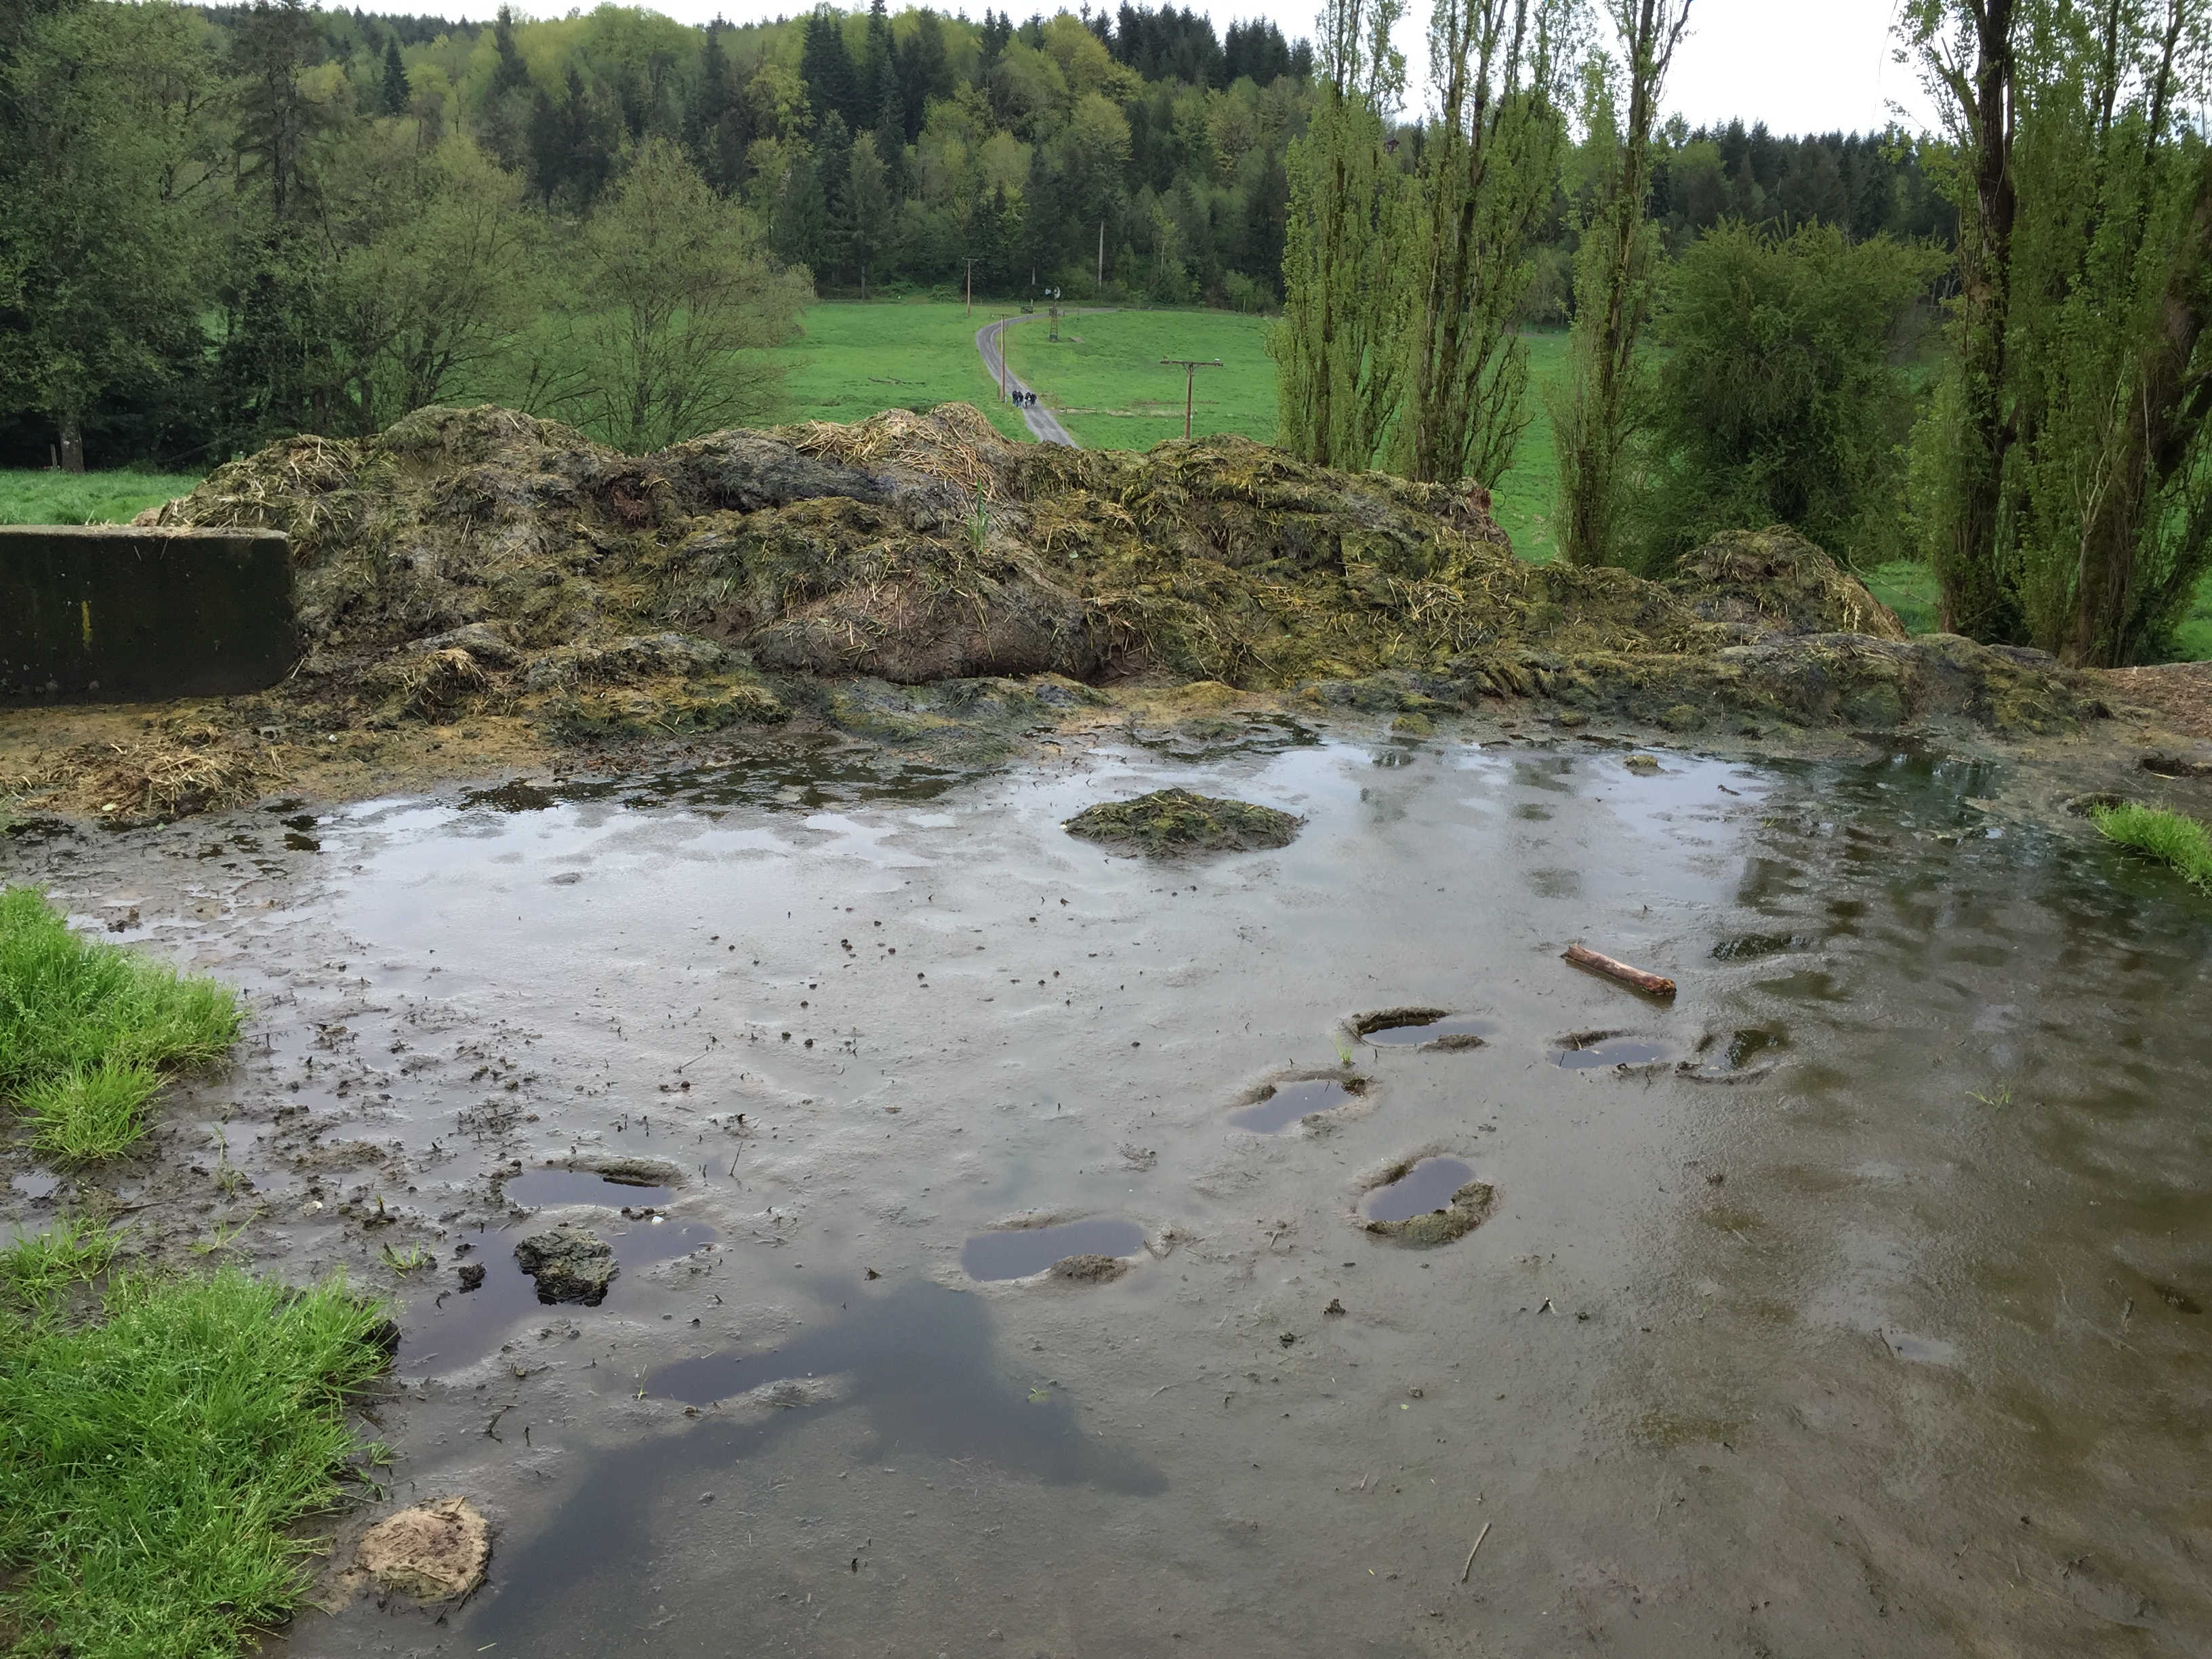
Land application of animal manure without proper land treatment practices

Muddy field with standing water

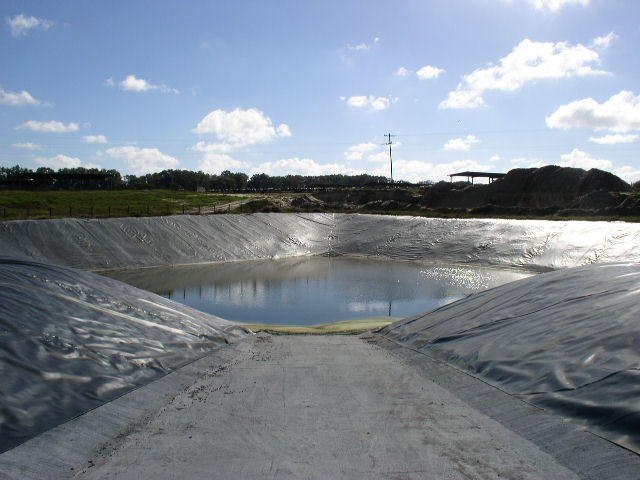
Proper animal manure storage required to address water quality issues

Picture of lined water bed

Evaluation of storage area to adequately address surface and subsurface
water quality issues

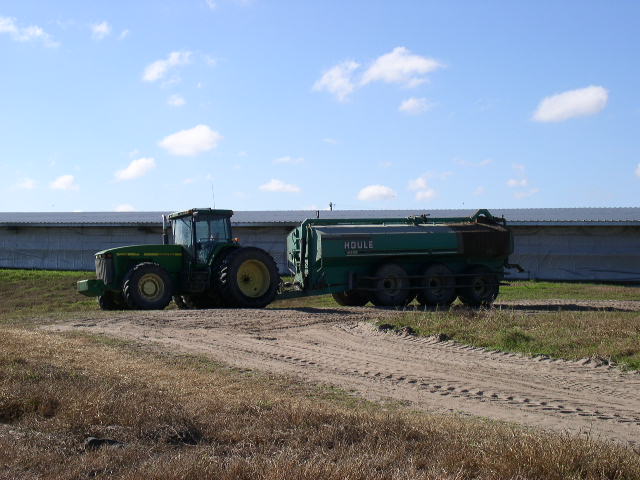
Picture of tractor and tanker spreader

Land application and nutrient management are critical elements for a
properly prepared CNMP

What have we learned?

The quality of CNMPs varies greatly across the country. Some were becoming so large that landowners were having difficulty finding the activities that needed to be completed. The revised CNMP format and process following the NRCS Conservation Planning approach should improve both the quality and usability of the plans developed. Due to statutes in the Farm Bill, all conservation practices recorded in the record of decision of the CNMP, whether receiving financial assistance or not, must be implemented by the end of the established contract period between the landowner and NRCS. Therefore it is important to only include the practices that are going to be implemented. CNMPs should be periodically updated to account for operational changes such as animal numbers, cropping systems, or land application methods.

Future Plans

The CNMP planning process will be evaluated to determine whether landowner objectives are being met and resource concerns properly addressed. Additional evaluations will look at the consistency of the plans generated across the country and the usability by landowners.

Corresponding author, title, and affiliation

Jeffrey P. Porter, P.E.; National Animal Manure and Nutrient Management Team Leader, USDA-Natural Resources Conservation Service

Corresponding author email

jeffrey.porter@gnb.usda.gov

Additional information

References

USDA-NRCS General Manual – Title 190, Part 405 – Comprehensive Nutrient Management Plans

USDA-NRCS Handbooks – Title 180, Part 600 – National Planning Procedures Handbook

Code of Federal Register (CFR) Title 7, Part 1466 – Environmental Quality Incentives Program (1466.7 EQIP Plan of Operations and 1466.21 Contract Requirements)

Webinar

Comprehensive Nutrient Management Plans and the Planning Process – http://www.conservationwebinars.net/webinars/comprehensive-nutrient-management-plans-and-the-planning-process/?searchterm=cnmp

The authors are solely responsible for the content of these proceedings. The technical information does not necessarily reflect the official position of the sponsoring agencies or institutions represented by planning committee members, and inclusion and distribution herein does not constitute an endorsement of views expressed by the same. Printed materials included herein are not refereed publications. Citations should appear as follows. EXAMPLE: Authors. 2017. Title of presentation. Waste to Worth: Spreading Science and Solutions. Cary, NC. April 18-21, 2017. URL of this page. Accessed on: today’s date.

Innovative Business Models for On-farm Anaerobic Digestion in the U.S.

Proceedings Home W2W Home w2w17 logo

Purpose

AgSTAR is a collaborative voluntary program of the Environmental Protection Agency (EPA) and United States Department of Agriculture (USDA). AgSTAR promotes the use of anaerobic digestion (AD) systems to advance economically and environmentally sound livestock manure management. AgSTAR has strong ties to industry, government, non-profit and university stakeholders and assists those who enable, purchase or implement anaerobic digesters by identifying project benefits, risks, options and opportunities.

Anaerobic digestion (AD) continues to be a sustainable manure management opportunity with growing interest in innovative business models for project development.   AD systems provide a number of benefits, including improved nutrient management, locally sourced renewable energy, and diversified revenue streams for farmers.   As energy prices remain low across the country, and interest grows in managing food waste and organics outside of landfills, new business models have been implemented to make these on-farm AD projects viable. This presentation will provide a national overview of the livestock AD sector, explore new AD projects across the U.S., and highlight successful projects with innovative business models.

The presentation will cover several case studies of AD projects on topics including:

  • Third-party ownership and development of projects;
  • Food waste collection and boosting project profitability through tip fees and increased biogas production;
  • Eco-market products from dairy manure fibers; manure-based alternatives to peat moss for the horticulture industry; and
  • Biogas to vehicle fuel; opportunities and financial considerations.

With only 244 operating on-farm AD projects across the U.S., there exists a great opportunity for market share growth at the approximately 8,000 farms that could support a project. This, coupled with the desire for alternative management of organic waste streams, provides a unique opportunity for this sector to grow in the near future.

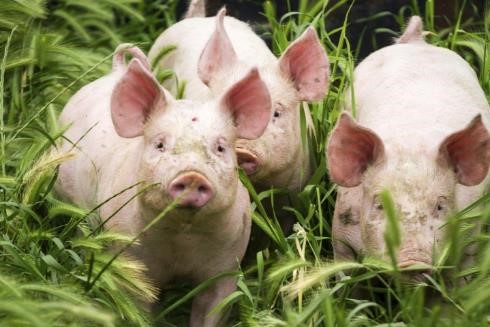
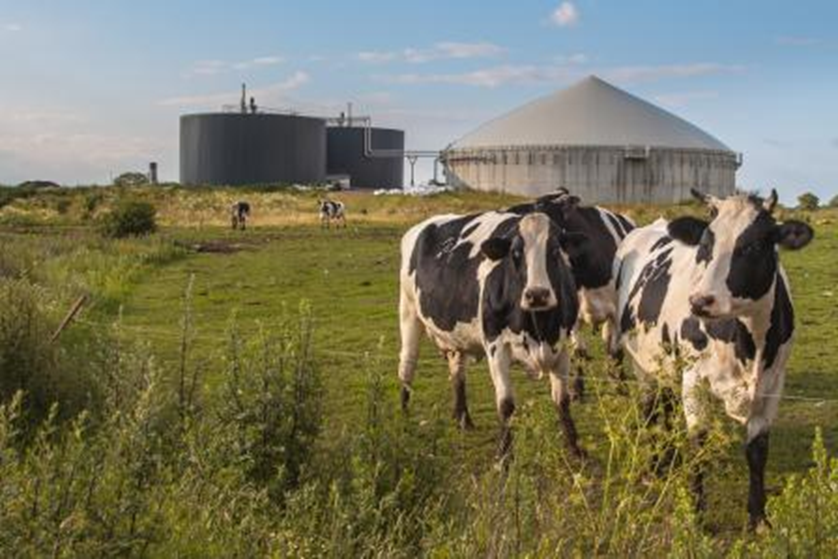
Pigs in a fieldCows in a field

Corresponding author, title, and affiliation

Nick Elger

Program Manager

AgSTAR & Global Methane Initiative

U.S. Environmental Protection Agency

1201 Constitution Ave NW, Mail code: 6207J

Washington, D.C. 20460

Phone: 202.343.9460

Email: elger.nicholas@epa.gov

https://www.epa.gov/agstar

https://www.globalmethane.org/

Review of Odor Management Planning Templates and Calculators Across the US

Proceedings Home | W2W Home waste to worth 2017 logo

Purpose

Odor is a common and prevalent problem for new and existing livestock operations, and odor is often a source of conflict between neighbors. Odor cannot be removed in entirety from livestock production, but it can be managed. A few states have developed odor management plan guidelines or templates that may be mandatory, or voluntarily for the sake of good stewardship. Our long term goal is to construct an odor management plan template for South Dakota and beyond, and improve producer-neighbor relationships. Towards this goal, we present a review of established tools, templates and odor impact calculators that are in use in the United States.

What did we do?

We sent a questionnaire to four odor management plan (OMP) developers in Minnesota, Michigan, Nebraska and Pennsylvania. The questionnaire asked questions about the development process, users, marketing, and evaluation of odor management planning guides. We compared and contrasted the responses and identified opportunities to build on these past experiences elsewhere. Similarly, based on existing literature and online tools, four odor impact estimation calculators, or footprint tools were reviewed. These include the South Dakota Odor Footprint Tool, Odor From Feedlots Setback Emissions Tool (Minnesota), Odor Footprint Tool (Nebraska), and Purdue Odor Setback Model (Indiana).

What have we learned?

From the questionnaire it was clear that though an odor management plan is not a mandatory requirement in most of the states surveyed, the developers produced these guides for the betterment of the livestock industry of their state. During development of the OMPs, there was little exchange between producers, neighbors or policy makers collectively. Also, the use, evaluation and impact of the OMP templates was not tracked. There was not extensive marketing for the odor management plan guides aside from extension news updates and some presentations.

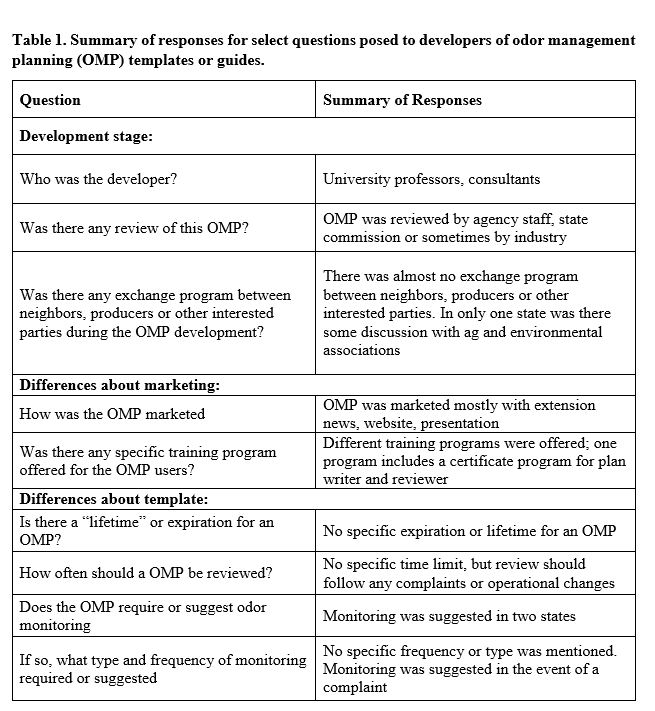
The pattern or format of the OMPs from the four different states was similar. Documentation of odor sources and record keeping of odor complaints was encouraged in all with a tabulated form. Michigan’s was the only guide to suggest quantitative estimation of odor impact, even though there are some nice and effective tools available to make these calculations for most states and regions. Odor monitoring was suggested in two states and one state suggested third party monitoring keep the assessment unbiased. Table 1 presents an overall review of questionnaire findings for the four states surveyed.

Table 1. Summary of responses for select questions posed to developers of odor management planning (OMP) templates or guides

All four odor footprint tools were compared based on the odor emission estimates and dispersion model incorporation. Two of the tools considered terrain factors in odor dispersion calculations. Additional comparisons are shown in Table 2.

Table 2. Comparison of odor setback/odor footprint estimation tools

Future Plans

Building off of the feedback from OMP developers in other states, we plan to engage multiple interest groups in identifying the scope, use and dissemination of an OMP developed for South Dakota. There will be an emphasis on conflict resolution in the event of odor complaints so that odor complaints can be resolved locally (between neighbors) as much as possible.

Corresponding author, title, and affiliation

Suraiya Akter, Graduate Research Assistant, Agricultural and Biosystems Engineering, South Dakota State University

Corresponding author email

suraiya.akter@sdstate.edu

Other authors

Erin Cortus, Associate Professor and Environmental Quality Engineer, Agricultural and Biosystems Engineering, South Dakota State University

Additional information

erin.cortus@sdstate.edu

Acknowledgements

We would like to thank Dr. Jerry May (MSU), Mr. David Schmidt (UMN), Mr. Karl Dymond (Pennsylvania State), Dr. Richard Koelsh (UNL) for their kind response to the questionnaire.