
In this webinar, discover why manure management is important – even in an urban or backyard setting. This presentation was originally broadcast on March 18, 2022. Continue reading “Manure Management in an Urban Setting”
Manure Management Technology Selection Guidance
Proceedings Home | W2W Home 
Purpose
Manure is an inevitable by-product of livestock production. Traditionally, manure has been land applied for the nutrient value in crop production and improved soil quality.With livestock operations getting larger and, in many cases, concentrating in certain areas of the country, it is becoming more difficult to balance manure applications to plant uptake needs. In many places, this imbalance has led to over-application of nutrients with increased potential for surface water, ground water and air quality impairments. No two livestock operations are identical and manure management technologies are generally quite expensive, so it is important to choose the right technology for a specific livestock operation. Information is provided to assist planners and landowners in selecting the right technology to appropriately address the associated manure management concerns.
What did we do?
As with developing a good conservation plan, knowledge of manure management technologies can help landowners and operators best address resource concerns related to animal manure management. There are so many things to consider when looking at selecting various manure treatment technologies to make sure that it will function properly within an operation. From a technology standpoint, users must understand the different applications related to physical, chemical, and biological unit processes which can greatly assist an operator in choosing the most appropriate technology. By having a good understanding of the advantages and disadvantages of these technologies, better decisions can be made to address the manure-related resource concerns and help landowners:
• Install conservation practices to address and avoid soil erosion, water and air quality issues.
• In the use of innovative technologies that will reduce excess manure volume and nutrients and provide value-added products.
• In the use of cover crops and rotational cropping systems to uptake nutrients at a rate more closely related to those from applied animal manures.
• In the use of local manure to provide nutrients for locally grown crops and, when possible, discourage the importation of externally produced feed products.
• When excess manure can no longer be applied to local land, to select options that make feasible the transport of manure nutrients to regions where nutrients are needed.
• Better understand the benefits and limitations of the various manure management technologies.
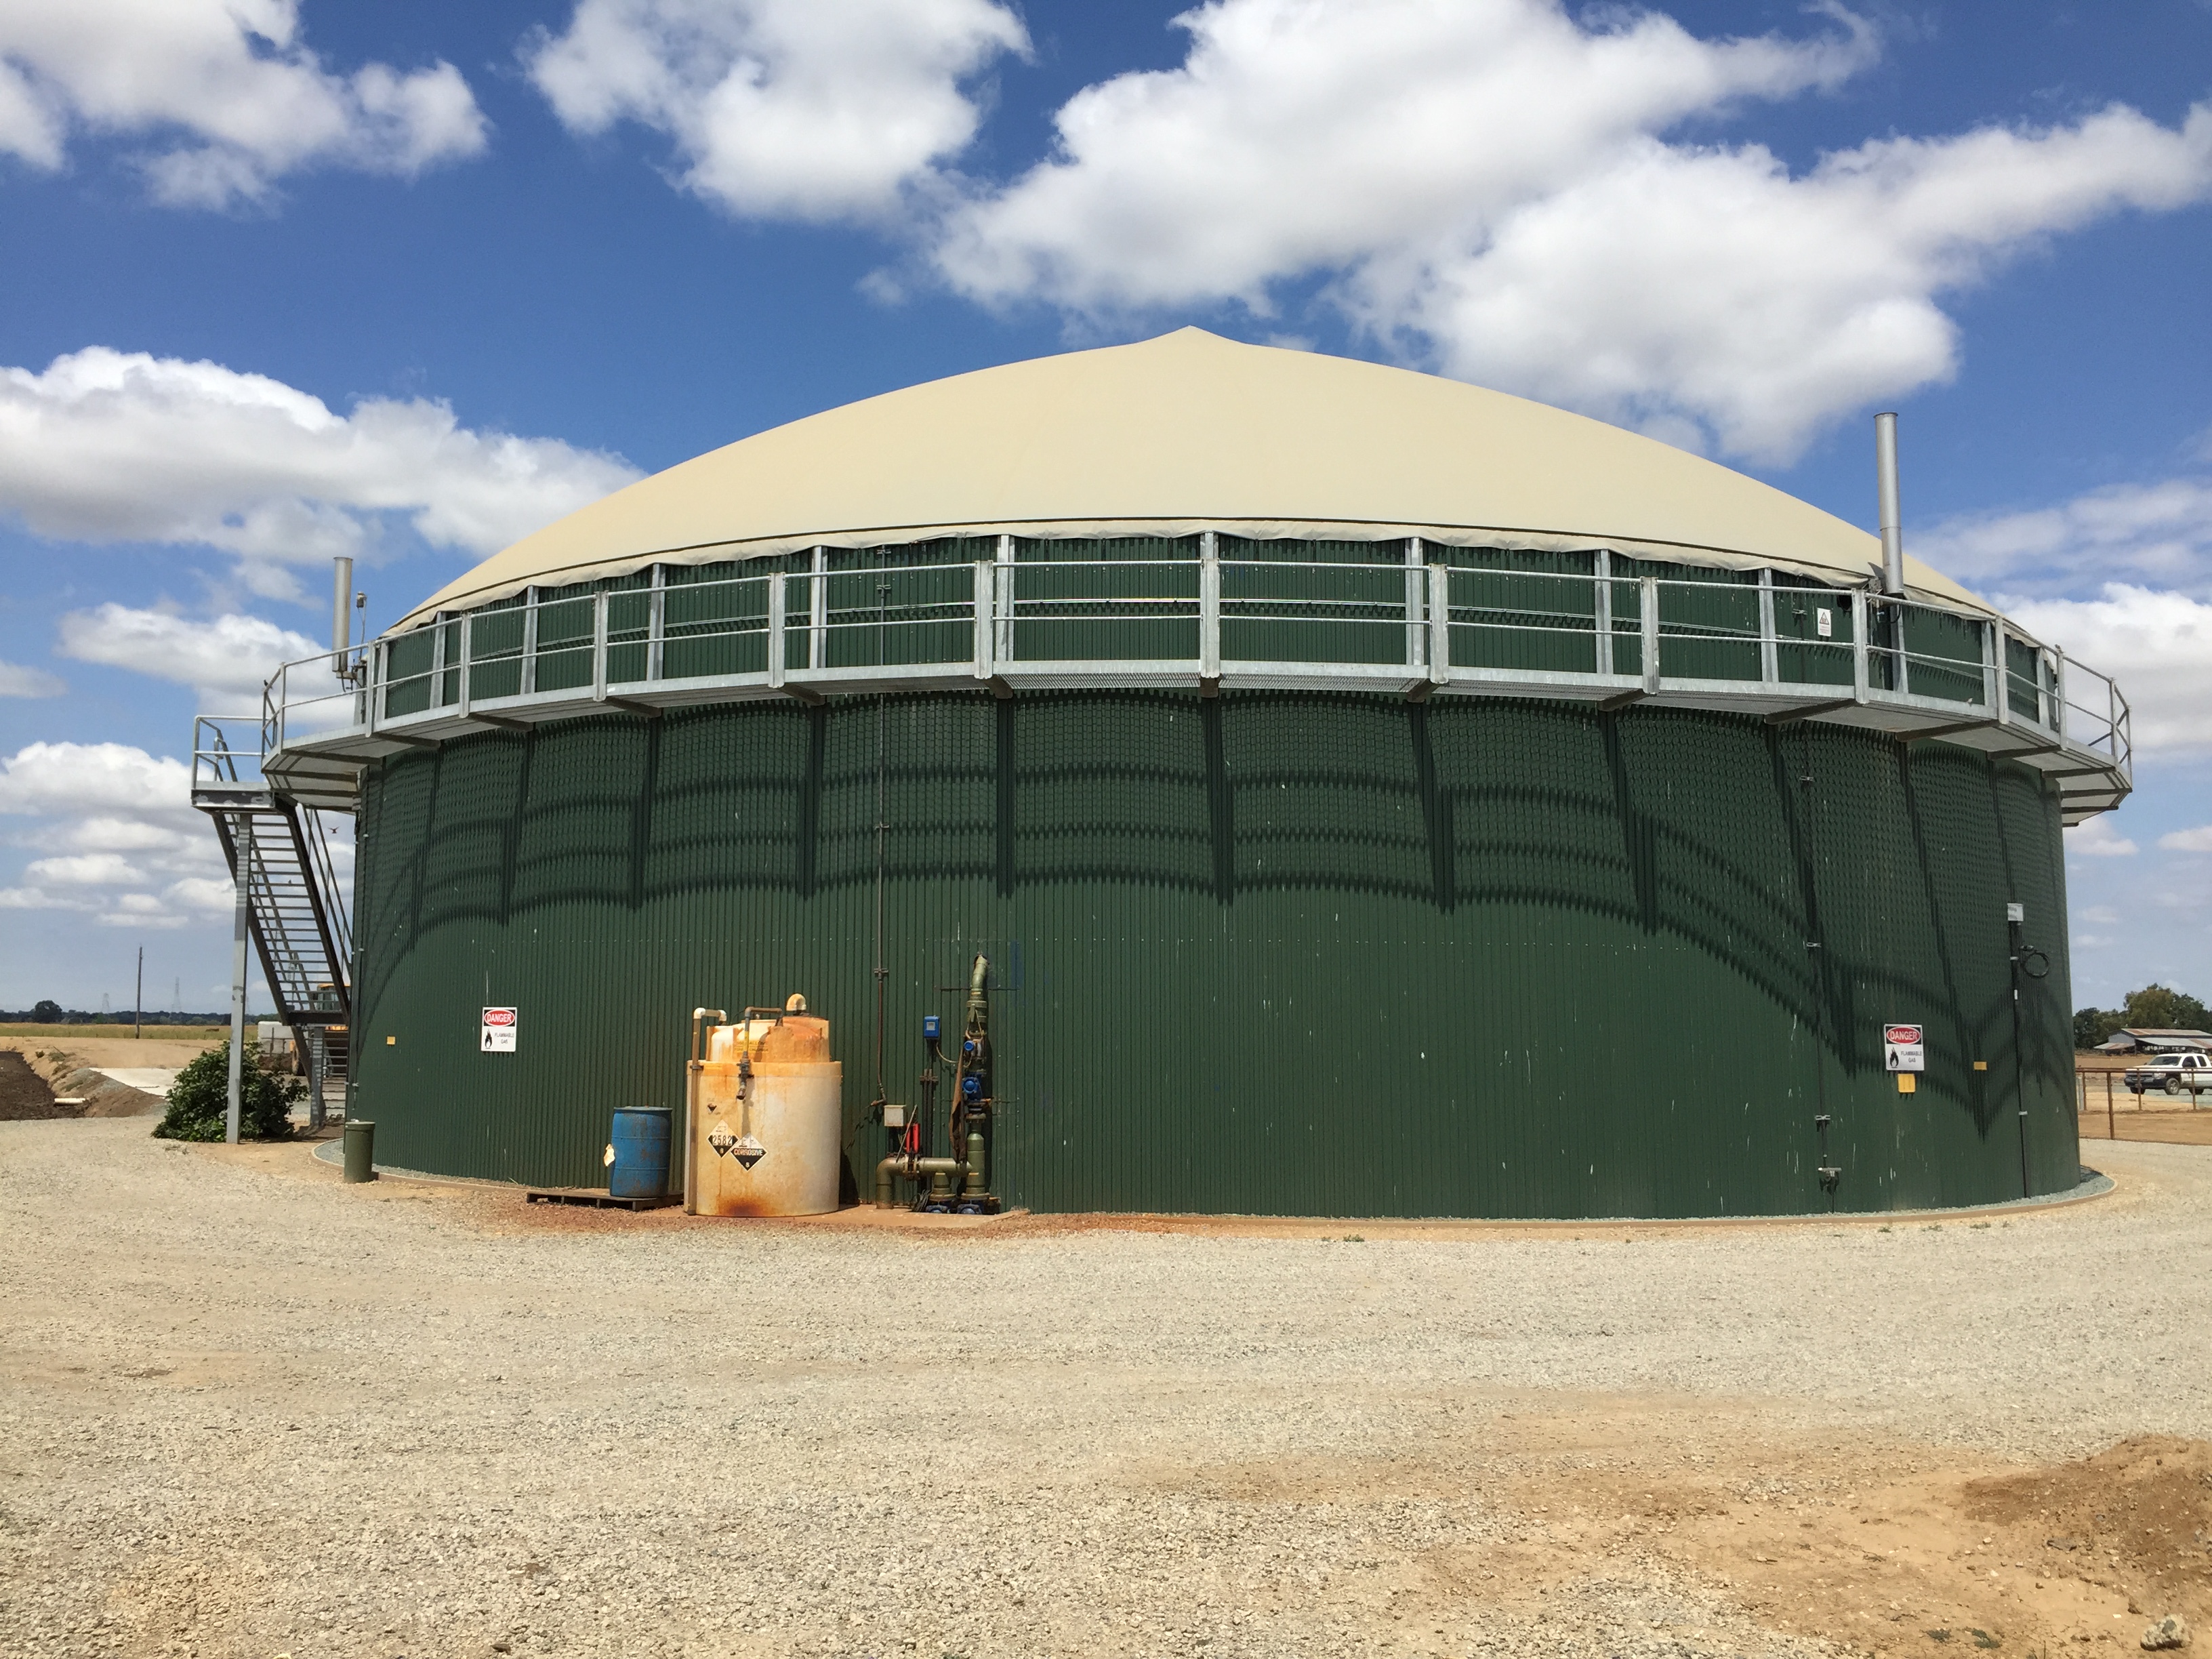
Complete-Mix Anaerobic Digester – option to reduce odors and pathogens; potential energy production
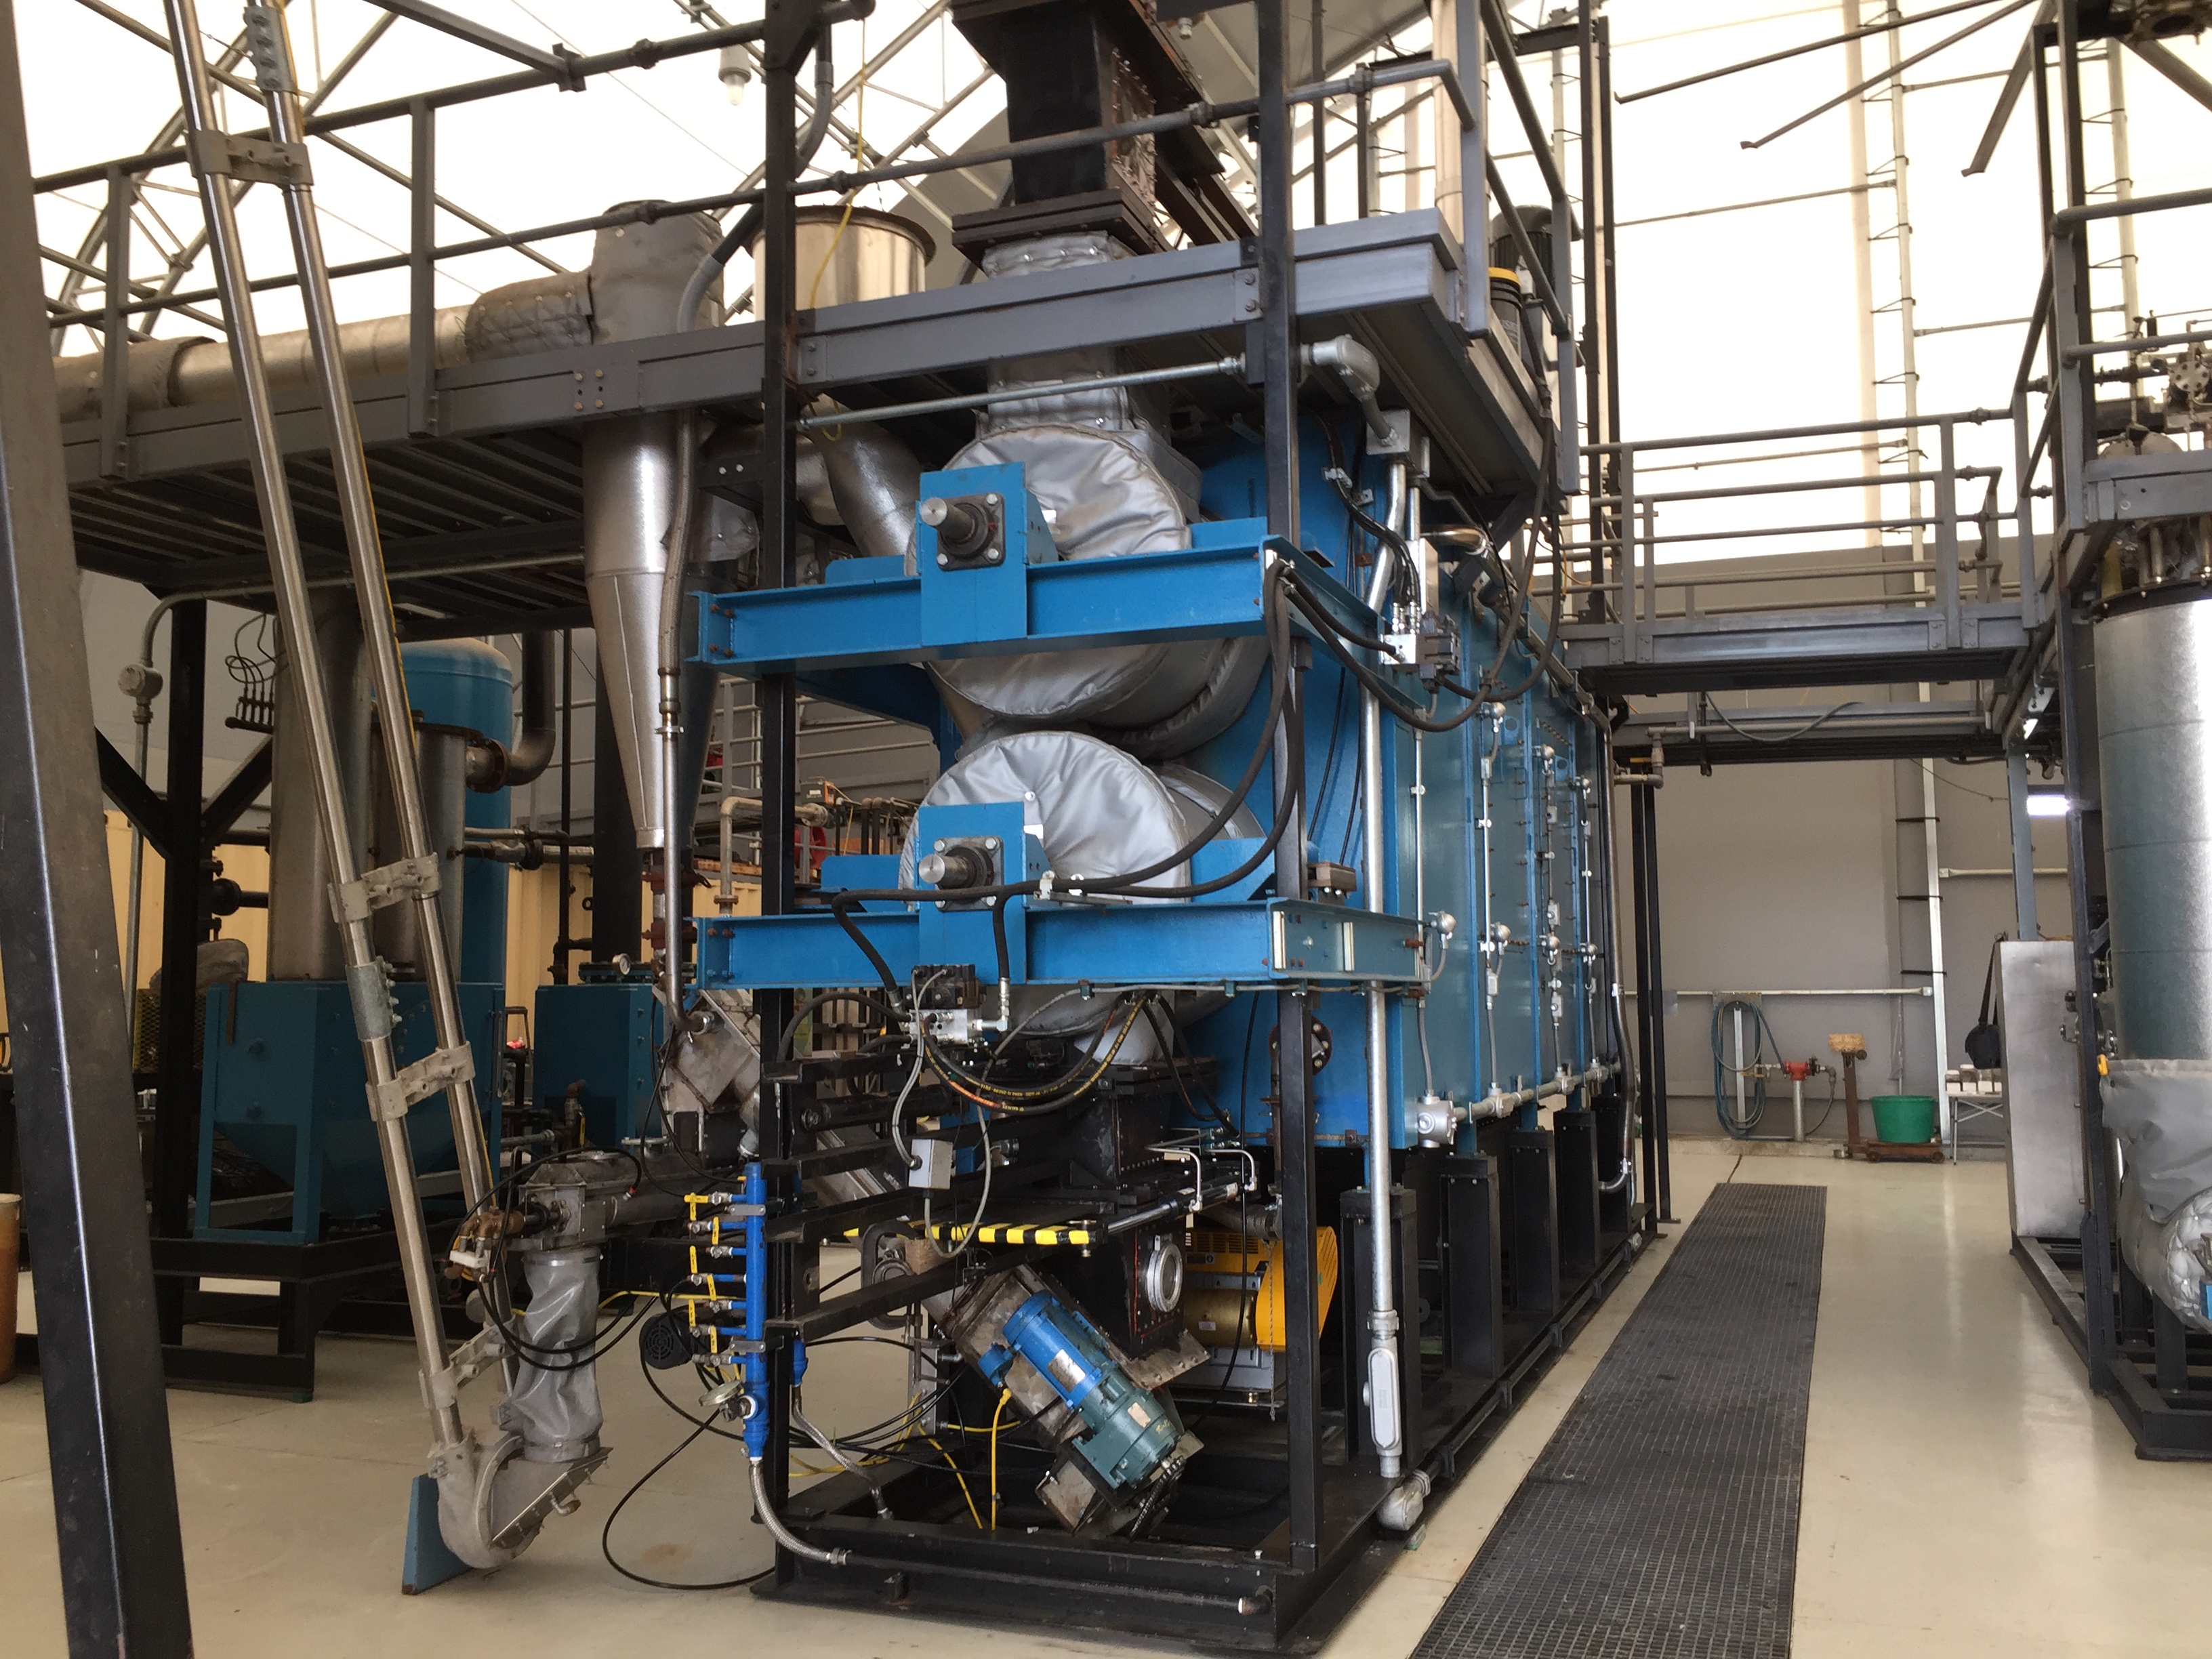
Gasification (pyrolysis) system – for reduced odors; pathogen destruction; volume reduction; potential energy production.
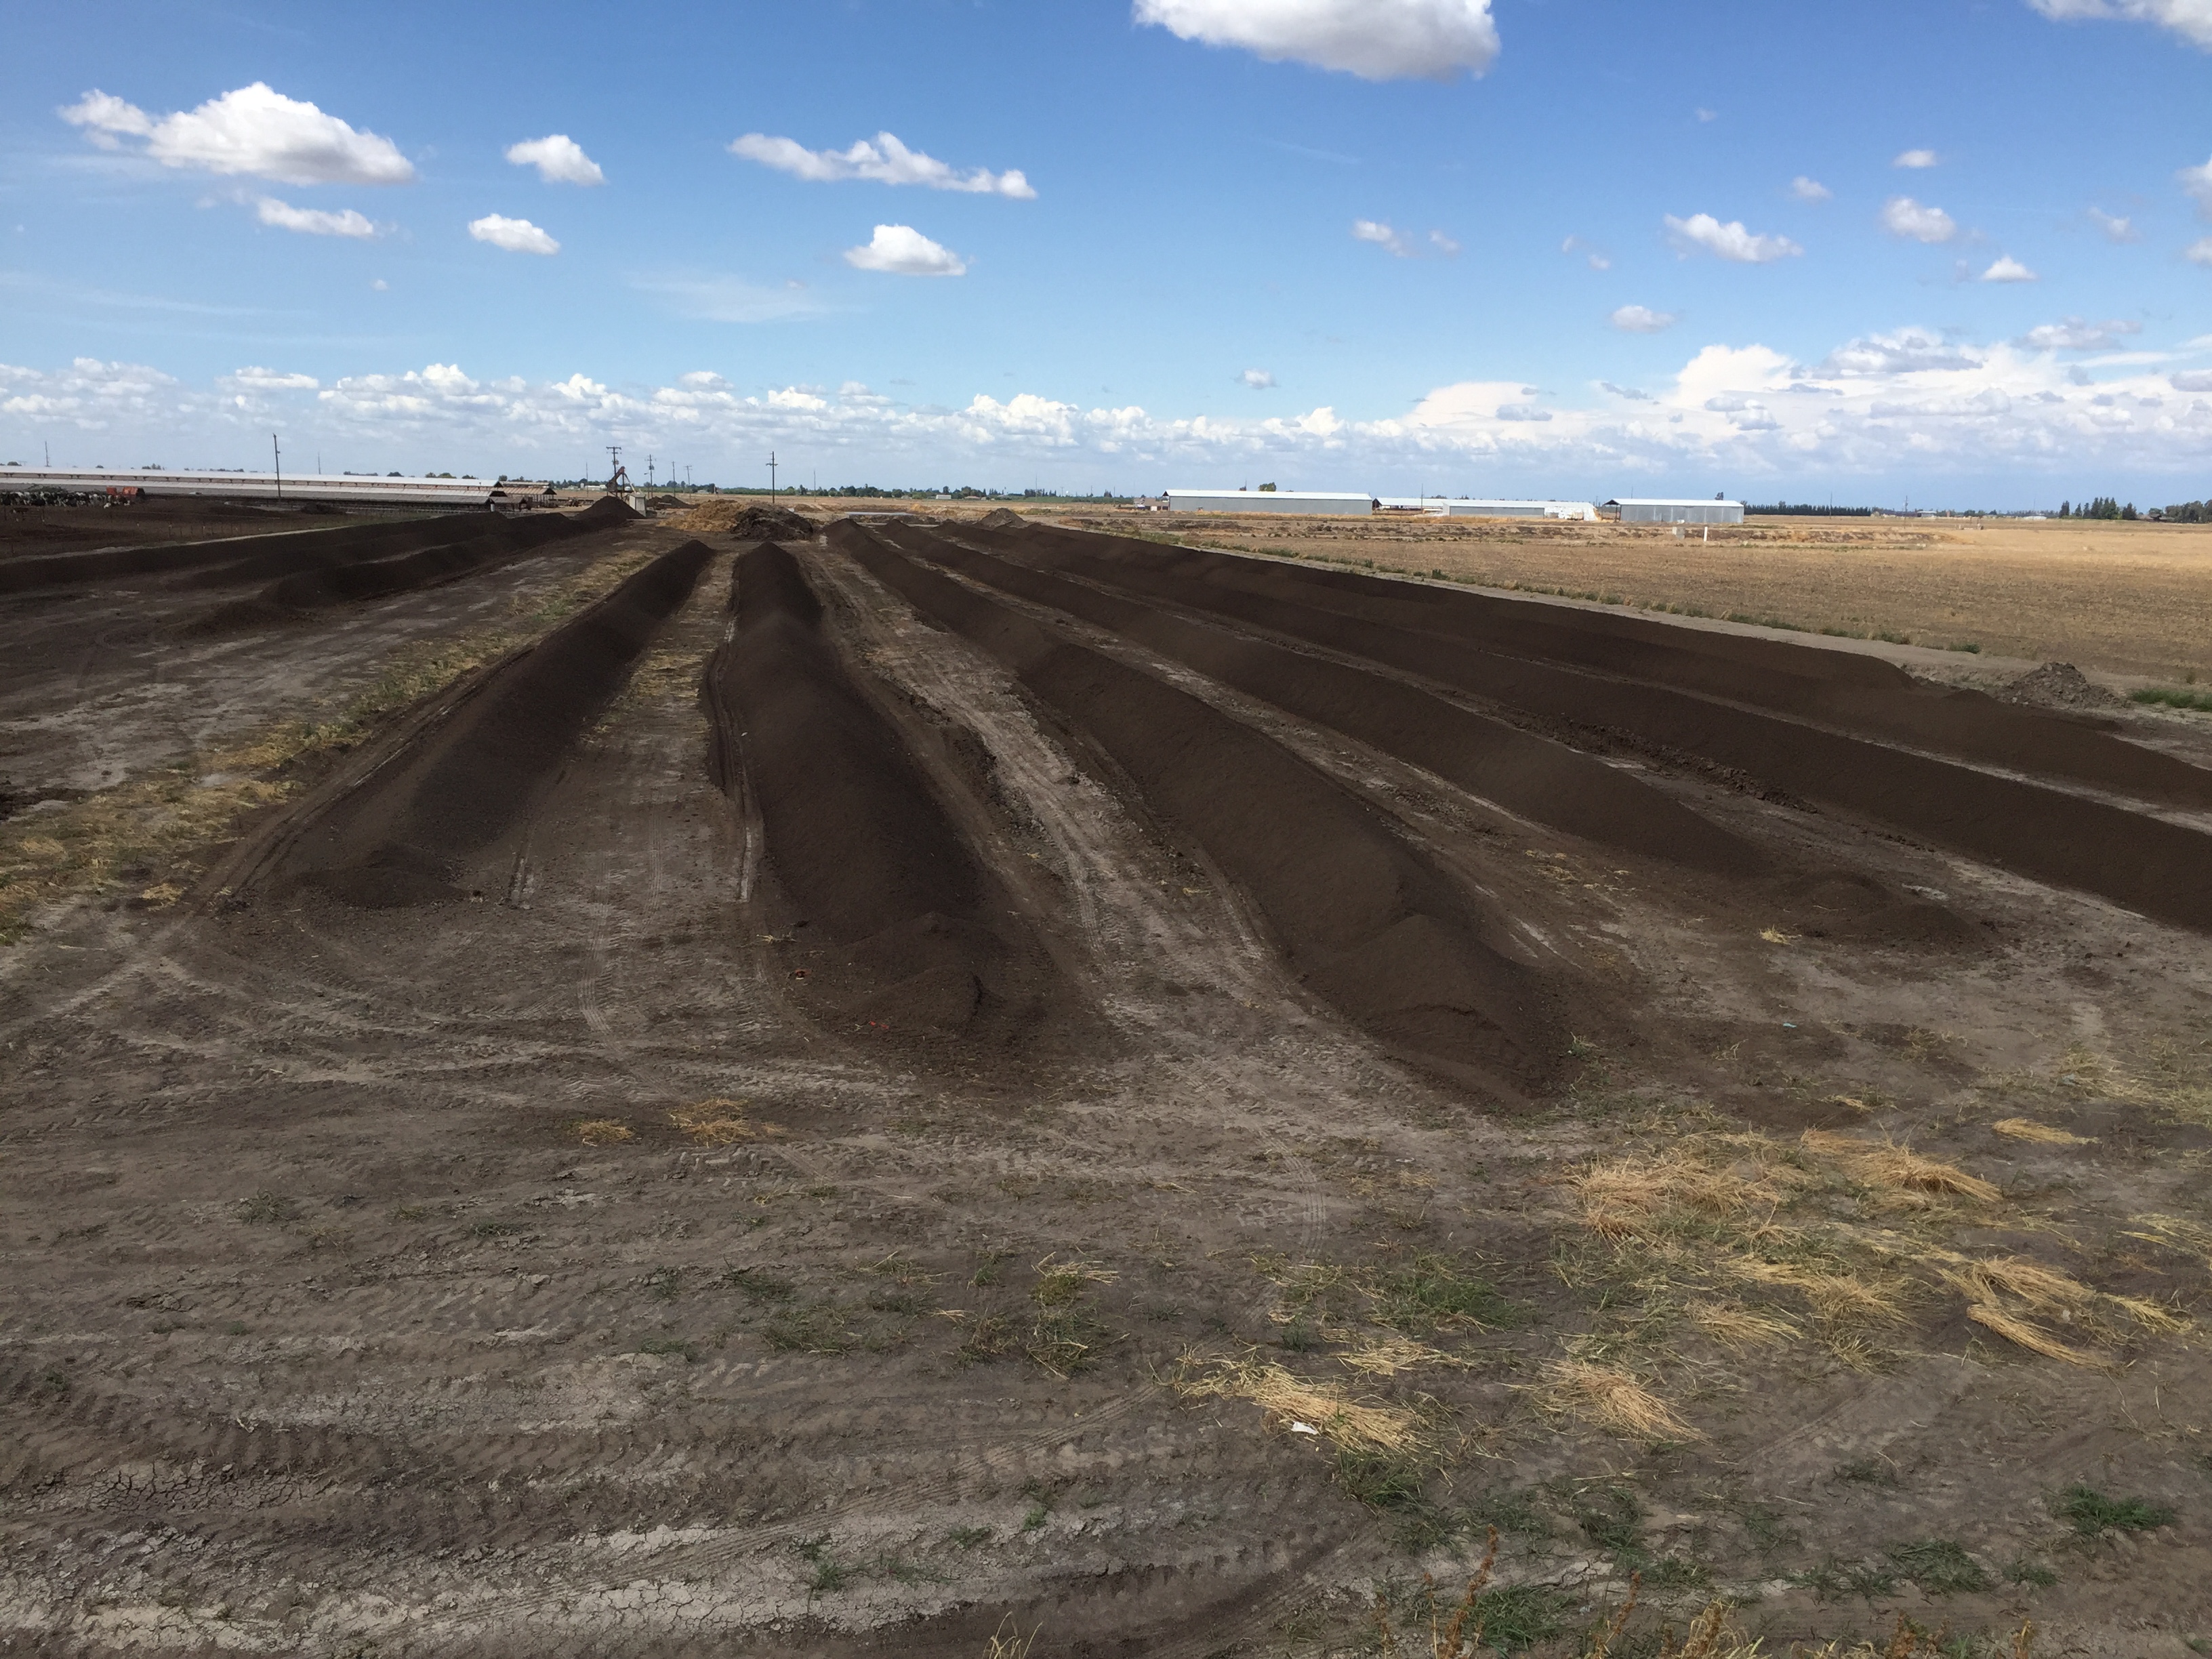
Windrow composting – reduce pathogens; volume reduction
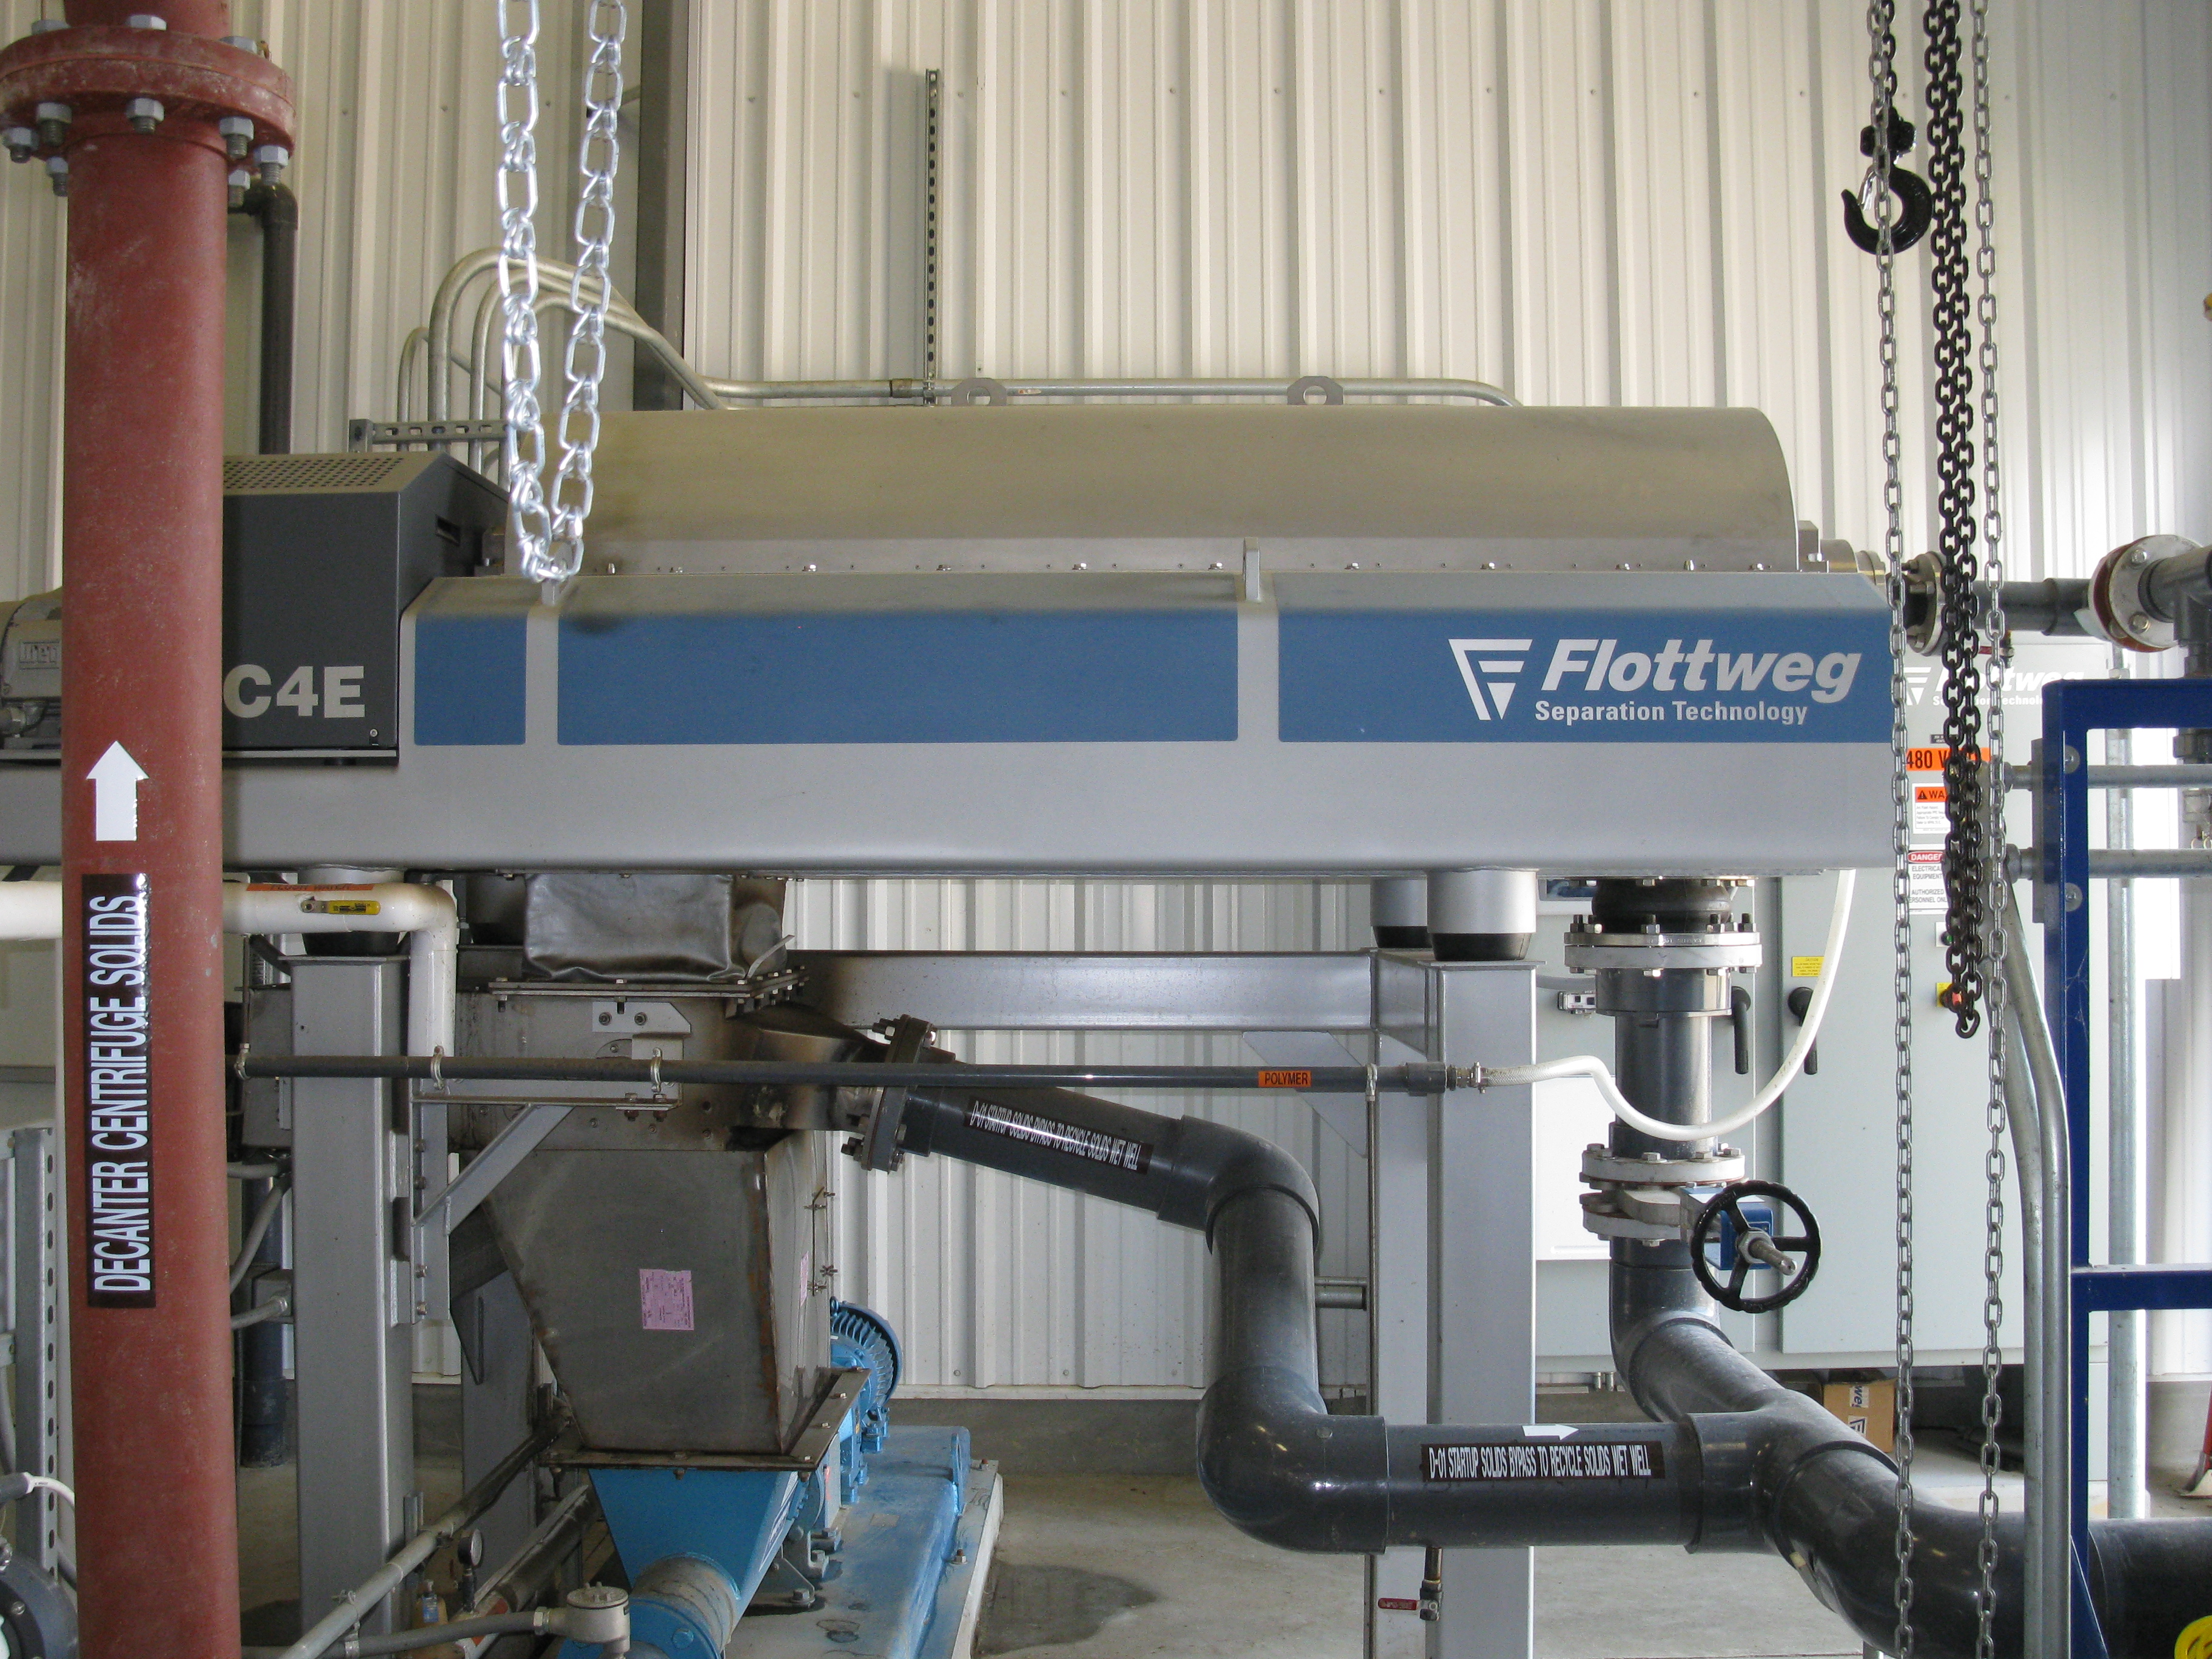
Centrifuge separation system – multiple material streams; potential nutrient
partitioning.
What have we learned?
• There are several options for addressing manure distribution and application management issues. There is no silver bullet.
• Each livestock operation will need to be evaluated separately, because there is no single alternative which will address all manure management issues and concerns.
• Option selections are dependent on a number of factors such as: landowner objectives, manure consistency, land availability, nutrient loads, and available markets.
• Several alternatives may need to be combined to meet the desired outcome.
• Soil erosion, water and air quality concerns also need to be addressed when dealing with manure management issues.
• Most options require significant financial investment.
Future Plans
Work with technology providers and others to further evaluate technologies and update information as necessary. Incorporate findings into NRCS handbooks and fact sheets for use by staff and landowners in selecting the best technology for particular livestock operations.
Corresponding author, title, and affiliation
Jeffrey P. Porter, P.E.; National Animal Manure and Nutrient Management Team Leader USDA-Natural Resources Conservation Service
Corresponding author email
Other authors
Darren Hickman, P.E., National Geospatial Center of Excellence Director USDA-Natural Resources Conservation Service; John Davis, National Nutrient Management Specialist USDA-Natural Resources Conservation Service, retired
Additional information
References
USDA-NRCS Handbooks – Title 210, Part 651 – Agricultural Waste Management Field Handbook
USDA-NRCS Handbooks – Title 210, Part 637 – Environmental Engineering, Chapter 4 – Solid-liquid Separation Alternatives for Manure Handling and Treatment (soon to be published)
Webinars
Evaluation of Manure Management Systems – http://www.conservationwebinars.net/webinars/evaluation-of-manure-management-systems/?searchterm=animal waste
Use of Solid-Liquid Separation Alternatives for Manure Handling and Treatment – http://www.conservationwebinars.net/webinars/use-of-solid-liquid-separation-alternatives-for-manure-handling-and-treatment/?searchterm=animal waste
The authors are solely responsible for the content of these proceedings. The technical information does not necessarily reflect the official position of the sponsoring agencies or institutions represented by planning committee members, and inclusion and distribution herein does not constitute an endorsement of views expressed by the same. Printed materials included herein are not refereed publications. Citations should appear as follows. EXAMPLE: Authors. 2017. Title of presentation. Waste to Worth: Spreading Science and Solutions. Cary, NC. April 18-21, 2017. URL of this page. Accessed on: today’s date.
Poultry Mortality Freezer Units: Better BMP, Better Biosecurity, Better Bottom Line.
Proceedings Home | W2W Home
Purpose
Why Tackle Mortality Management? It’s Ripe for Revolution.
The poultry industry has enjoyed a long run of technological and scientific advancements that have led to improvements in quality and efficiency. To ensure its hard-won prosperity continues into the future, the industry has rightly shifted its focus to sustainability. For example, much money and effort has been expended on developing better management methods and alternative uses/destinations for poultry litter.
In contrast, little effort or money has been expended to improve routine mortality management – arguably one of the most critical aspects of every poultry operation. In many poultry producing areas of the country, mortality management methods have not changed in decades – not since the industry was forced to shift from the longstanding practice of pit burial. Often that shift was to composting (with mixed results at best). For several reasons – improved biosecurity being the most important/immediate – it’s time that the industry shift again.
The shift, however, doesn’t require reinventing the wheel, i.e., mortality management can be revolutionized without developing anything revolutionary. In fact, the mortality management practice of the future owes its existence in part to a technology that was patented exactly 20 years ago by Tyson Foods – large freezer containers designed for storing routine/daily mortality on each individual farm until the containers are later emptied and the material is hauled off the farm for disposal.
Despite having been around for two decades, the practice of using on-farm freezer units has received almost no attention. Little has been done to promote the practice or to study or improve on the original concept, which is a shame given the increasing focus on two of its biggest advantages – biosecurity and nutrient management.
Dusting off this old BMP for a closer look has been the focus of our work – and with promising results. The benefits of hitting the reset button on this practice couldn’t be more clear:
- Greatly improved biosecurity for the individual grower when compared to traditional composting;
- Improved biosecurity for the entire industry as more individual farms switch from composting to freezing, reducing the likelihood of wider outbreaks;
- Reduced operational costs for the individual poultry farm as compared to more labor-intensive practices, such as composting;
- Greatly reduced environmental impact as compared to other BMPs that require land application as a second step, including composting, bio-digestion and incineration; and
- Improved quality of life for the grower, the grower’s family and the grower’s neighbors when compared to other BMPs, such as composting and incineration.
What Did We Do?
We basically took a fresh look at all aspects of this “old” BMP, and shared our findings with various audiences.
That work included:
- Direct testing with our own equipment on our own poultry farm regarding
- Farm visitation by animals and other disease vectors,
- Freezer unit capacity,
- Power consumption, and
- Operational/maintenance aspects;
- Field trials on two pilot project farms over two years regarding
- Freezer unit capacity
- Quality of life issues for growers and neighbors,
- Farm visitation by animals and other disease vectors,
- Operational and collection/hauling aspects;
- Performing literature reviews and interviews regarding
- Farm visitation by animals and other disease vectors
- Pathogen/disease transmission,
- Biosecurity measures
- Nutrient management comparisons
- Quality of life issues for growers and neighbors
- Ensuring the results of the above topics/tests were communicated to
- Growers
- Integrators
- Legislators
- Environmental groups
- Funding agencies (state and federal)
- Veterinary agencies (state and federal)
What Have We Learned?
The breadth of the work at times limited the depth of any one topic’s exploration, but here is an overview of our findings:
- Direct testing with our own equipment on our own poultry farm regarding
- Farm visitation by animals and other disease vectors
- Farm visitation by scavenger animals, including buzzards/vultures, raccoons, foxes and feral cats, that previously dined in the composting shed daily slowly decreased and then stopped entirely about three weeks after the farm converted to freezer units.
- The fly population was dramatically reduced after the farm converted from composting to freezer units. [Reduction was estimated at 80%-90%.]
- Freezer unit capacity
- The test units were carefully filled on a daily basis to replicate the size and amount of deadstock generated over the course of a full farm’s grow-out cycle.
- The capacity tests were repeated over several flocks to ensure we had accurate numbers for creating a capacity calculator/matrix, which has since been adopted by the USDA’s Natural Resources Conservation Service to determine the correct number of units per farm based on flock size and finish bird weight (or number of grow-out days) in connection with the agency’s cost-share program.
- Power consumption
- Power consumption was recorded daily over several flocks and under several conditions, e.g., during all four seasons and under cover versus outside and unprotected from the elements.
- Energy costs were higher for uncovered units and obviously varied depending on the season, but the average cost to power one unit is only 90 cents a day. The total cost of power for the average farm (all four units) is only $92 per flock. (See additional information for supporting documentation and charts.)
- Operational/maintenance aspects;
- It was determined that the benefits of installing the units under cover (e.g., inside a small shed or retrofitted bin composter) with a winch system to assist with emptying the units greatly outweighed the additional infrastructure costs.
- This greatly reduced wear and tear on the freezer component of the system during emptying, eliminated clogging of the removable filter component, as well as provided enhanced access to the unit for periodic cleaning/maintenance by a refrigeration professional.
- Farm visitation by animals and other disease vectors
- Field trials on two pilot project farms over two years regarding
- Freezer unit capacity
- After tracking two years of full farm collection/hauling data, we were able to increase the per unit capacity number in the calculator/matrix from 1,500 lbs. to 1,800 lbs., thereby reducing the number of units required per farm to satisfy that farm’s capacity needs.
- Quality of life issues for growers and neighbors
- Both farms reported improved quality of life, largely thanks to the elimination or reduction of animals, insects and smells associated with composting.
- Farm visitation by animals and other disease vectors
- Both farms reported elimination or reduction of the scavenging animals and disease-carrying insects commonly associated with composting.
- Operational and collection/hauling aspects
- With the benefit of two years of actual use in the field, we entirely re-designed the sheds used for housing the freezer units.
- The biggest improvements were created by turning the units so they faced each other rather than all lined up side-by-side facing outward. (See additional information for supporting documentation and diagrams.) This change then meant that the grower went inside the shed (and out of the elements) to load the units. This change also provided direct access to the fork pockets, allowing for quicker emptying and replacement with a forklift.
- Freezer unit capacity
- Performing literature reviews and interviews regarding
- Farm visitation by animals and other disease vectors
- More research confirming the connection between farm visitation by scavenger animals and the use of composting was recently published by the USDA National Wildlife Research Center:
- “Certain wildlife species may become habituated to anthropogenically modified habitats, especially those associated with abundant food resources. Such behavior, at least in the context of multiple farms, could facilitate the movement of IAV from farm to farm if a mammal were to become infected at one farm and then travel to a second location. … As such, the potential intrusion of select peridomestic mammals into poultry facilities should be accounted for in biosecurity plans.”
- Root, J. J. et al. When fur and feather occur together: interclass transmission of avian influenza A virus from mammals to birds through common resources. Sci. Rep. 5, 14354; doi:10.1038/ srep14354 (2015) at page 6 (internal citations omitted; emphasis added).
- More research confirming the connection between farm visitation by scavenger animals and the use of composting was recently published by the USDA National Wildlife Research Center:
- Pathogen/disease transmission,
- Animals and insects have long been known to be carriers of dozens of pathogens harmful to poultry – and to people. Recently, however, the USDA National Wildlife Research Center demonstrated conclusively that mammals are not only carriers – they also can transmit avian influenza virus to birds.
- The study’s conclusion is particularly troubling given the number and variety of mammals and other animals that routinely visit composting sheds as demonstrated by our research using a game camera. These same animals also routinely visit nearby waterways and other poultry farms increasing the likelihood of cross-contamination, as explained in this the video titled Farm Freezer Biosecurity Benefits.
- “When wildlife and poultry interact and both can carry and spread a potentially damaging agricultural pathogen, it’s cause for concern,” said research wildlife biologist Dr. Jeff Root, one of several researchers from the National Wildlife Research Center, part of the USDA-APHIS Wildlife Services program, studying the role wild mammals may play in the spread of avian influenza viruses.
- Animals and insects have long been known to be carriers of dozens of pathogens harmful to poultry – and to people. Recently, however, the USDA National Wildlife Research Center demonstrated conclusively that mammals are not only carriers – they also can transmit avian influenza virus to birds.
- Biosecurity measures
- Every day the grower collects routine mortality and stores it inside large freezer units. After the broiler flock is caught and processed, but before the next flock is started – i.e. when no live birds are present, a customized truck and forklift empty the freezer units and hauls away the deadstock. During this 10- to 20- day window between flocks biosecurity is relaxed and dozens of visitors (feed trucks, litter brokers, mortality collection) are on site in preparation for the next flock.
- “Access will change after a production cycle,” according to a biosecurity best practices document (enclosed) from Iowa State University. “Empty buildings are temporarily considered outside of the [protected area and even] the Line of Separation is temporarily removed because there are no birds in the barn.”
- Every day the grower collects routine mortality and stores it inside large freezer units. After the broiler flock is caught and processed, but before the next flock is started – i.e. when no live birds are present, a customized truck and forklift empty the freezer units and hauls away the deadstock. During this 10- to 20- day window between flocks biosecurity is relaxed and dozens of visitors (feed trucks, litter brokers, mortality collection) are on site in preparation for the next flock.
- Nutrient management comparisons
- Research provided by retired extension agent Bud Malone (enclosed) provided us with the opportunity to calculate nitrogen and phosphorous numbers for on-farm mortality, and therefore, the amount of those nutrients that can be diverted from land application through the use of freezer units instead of composting.
- The research (contained in an enclosed presentation) also provided a comparison of the cost-effectiveness of various nutrient management BMPs – and a finding that freezing and recycling is about 90% more efficient than the average of all other ag BMPs in reducing phosphorous.
- Quality of life issues for growers and neighbors
- Local and county governments in several states have been compiling a lot of research on the various approaches for ensuring farmers and their residential neighbors can coexist peacefully.
- Many of the complaints have focused on the unwanted scavenger animals, including buzzards/vultures, raccoons, foxes and feral cats, as well as the smells associated with composting.
- The concept of utilizing sealed freezer collection units to eliminate the smells and animals associated with composting is being considered by some government agencies as an alternative to instituting deeper and deeper setbacks from property lines, which make farming operations more difficult and costly.
- Farm visitation by animals and other disease vectors
Future Plans
We see more work on three fronts:
- First, we’ll continue to do monitoring and testing locally so that we may add another year or two of data to the time frames utilized initially.
- Second, we are actively working to develop new more profitable uses for the deadstock (alternatives to rendering) that could one day further reduce the cost of mortality management for the grower.
- Lastly, as two of the biggest advantages of this practice – biosecurity and nutrient management – garner more attention nationwide, our hope would be to see more thorough university-level research into each of the otherwise disparate topics that we were forced to cobble together to develop a broad, initial understanding of this BMP.
Corresponding author (name, title, affiliation)
Victor Clark, Co-Founder & Vice President, Legal and Government Affairs, Farm Freezers LLC and Greener Solutions LLC
Corresponding author email address
Other Authors
Terry Baker, Co-Founder & President, Farm Freezers LLC and Greener Solutions LLC
Additional Information
https://rendermagazine.com/wp-content/uploads/2019/07/Render_Oct16.pdf
Farm Freezer Biosecurity Benefits
One Night in a Composting Shed
—
Avian flu conditions still evolving (editorial)
USDA NRCS Conservation fact sheet Poultry Freezers
How Does It Work? (on-farm freezing)
Influenza infections in wild raccoons (CDC)
Collection Shed Unit specifications
Collection Unit specifications
Freezing vs Composting for Biosecurity (Render magazine)
Manure and spent litter management: HPAI biosecurity (Iowa State University)
Acknowledgements
Bud Malone, retired University of Delaware Extension poultry specialist and owner of Malone Poultry Consulting
Bill Brown, University of Delaware Extension poultry specialist, poultry grower and Delmarva Poultry Industry board member
Delaware Department of Agriculture
Delaware Nutrient Management Commission
Delaware Office of the Natural Resources Conservation Service
Maryland Office of the Natural Resources Conservation Service
The authors are solely responsible for the content of these proceedings. The technical information does not necessarily reflect the official position of the sponsoring agencies or institutions represented by planning committee members, and inclusion and distribution herein does not constitute an endorsement of views expressed by the same. Printed materials included herein are not refereed publications. Citations should appear as follows. EXAMPLE: Authors. 2017. Title of presentation. Waste to Worth: Spreading Science and Solutions. Cary, NC. April 18-21, 2017. URL of this page. Accessed on: today’s date.
Developing a Comprehensive Nutrient Management Plan (CNMP)
Proceedings Home | W2W Home
Purpose
Livestock producers are presented with a number of challenges and opportunities. Developing a quality Comprehensive Nutrient Management Plan (CNMP) can effectively help landowners address natural resource concerns related to soil erosion, water quality, and air quality from manure management. As livestock operations continue to expand and concentrate in certain parts of the country, utilizing a CNMP becomes even more important. Following the NRCS 9-step planning process is critical in developing a good plan. Effective communication is a key element between all parties involved in the planning process. A CNMP documents the decisions made by the landowner for the farmstead area, crop and pasture area, and nutrient management. Information will cover the elements essential for developing a quality CNMP.
What did we do?
Since the CNMP documents the records of decisions by the landowner, it has to be organized in such a fashion that it is understandable to and usable by the landowner. The CNMP is the landowner’s plan. Therefore, the role of the planner is to help landowners do the things that will most benefit them and the resources in the long run. This will take both time and effort. To provide consistency with other conservation planning efforts within NRCS, CNMPs following the same process outlined in the National Planning Procedures Handbook. There are several items that are essential for a quality CNMP to be developed:
• Have a good understanding of potential resource concerns especially soil erosion, water quality and air quality.
• Make the appropriate number of site visits. Trying to do this from the office will likely lead to a poor quality CNMP that may not be implemented.
• Address resource concerns for the Farmstead and Crop and Pasture areas.
• Ensure that all nutrient sources are addressed.
• Follow the 9 steps of planning.
• Decisions are agreed upon by the landowner. The CNMP reflects the landowner’s record of decisions.
• Follow-up to address any questions or concerns.
• Update as necessary. A CNMP is not a static document.

Land application of animal manure without proper land treatment practices
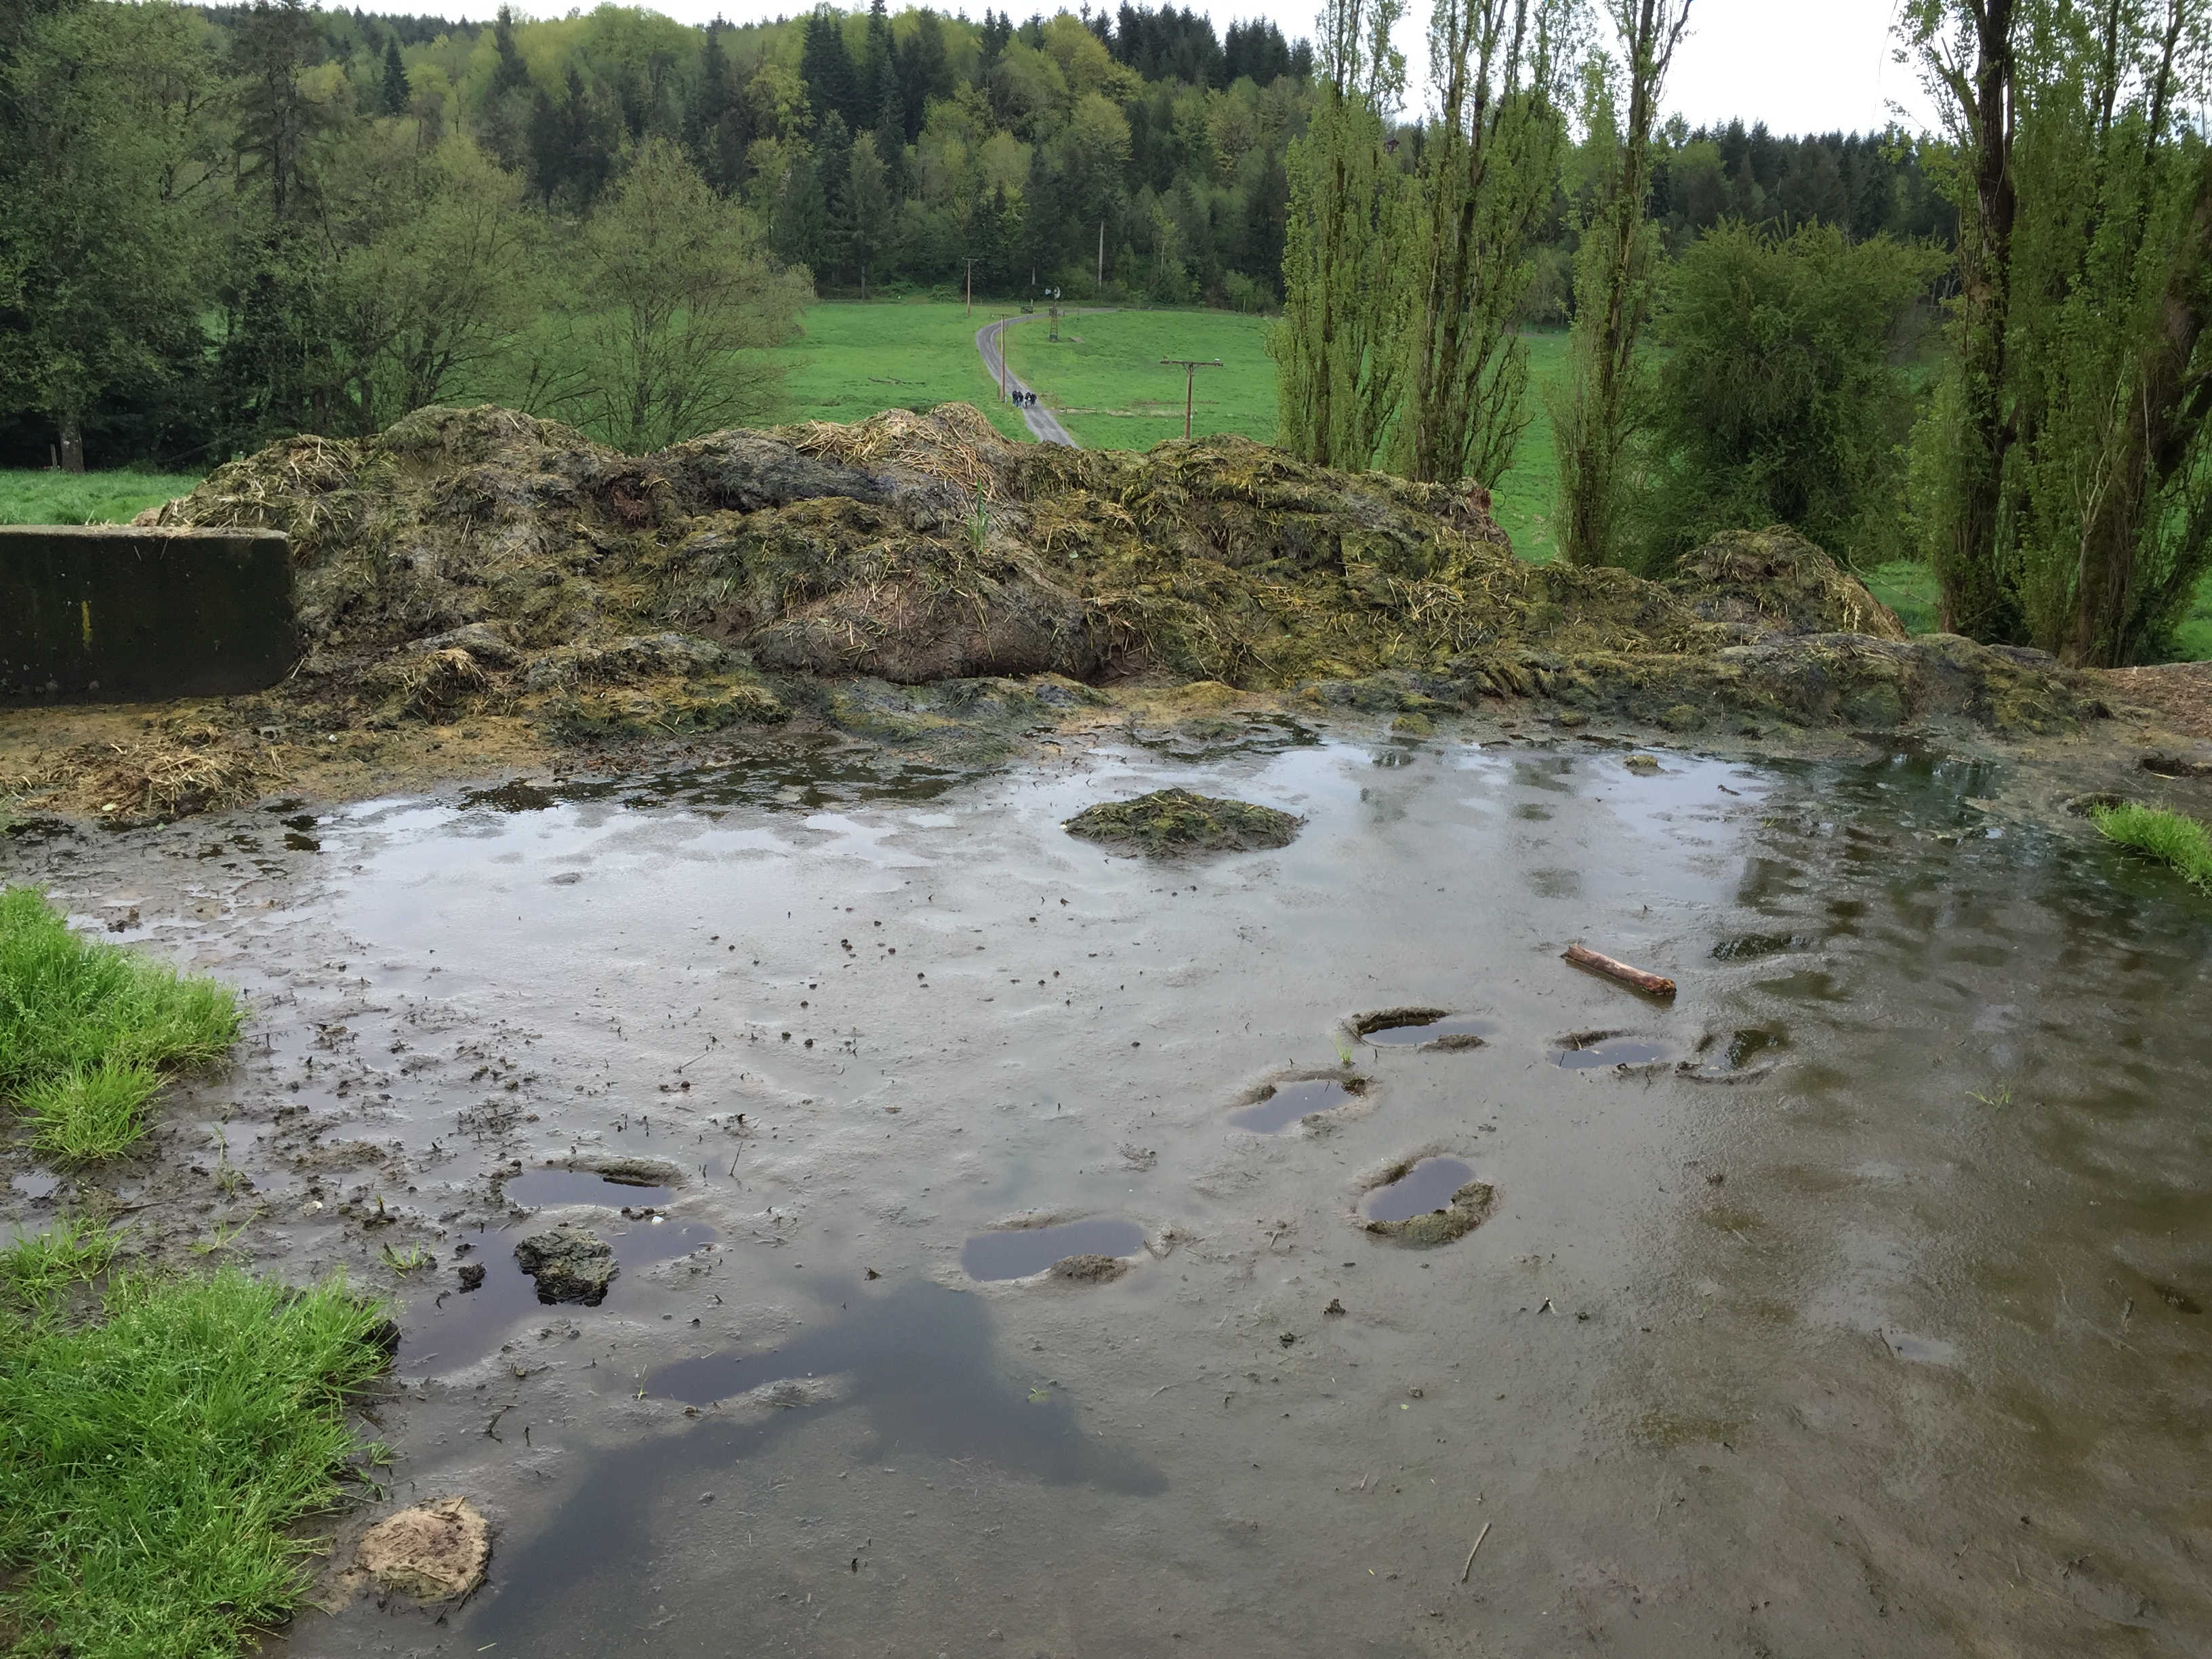
Proper animal manure storage required to address water quality issues
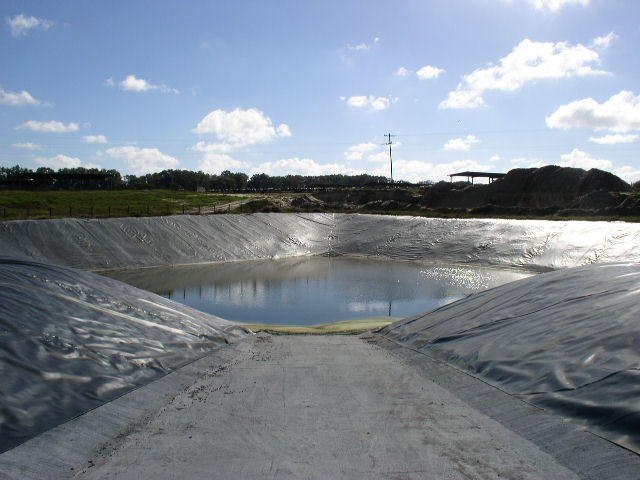
Evaluation of storage area to adequately address surface and subsurface
water quality issues
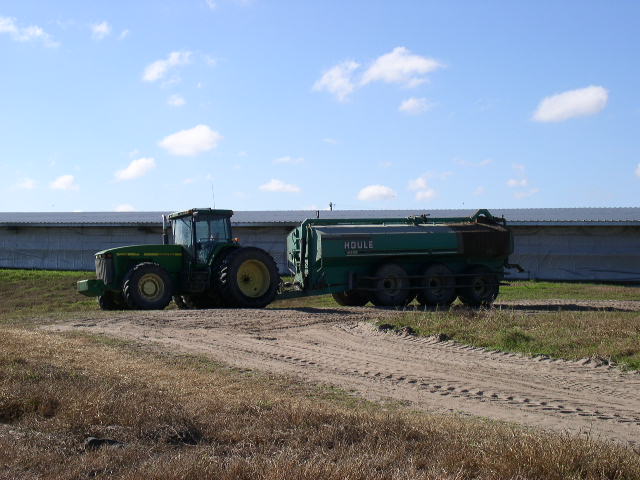
Land application and nutrient management are critical elements for a
properly prepared CNMP
What have we learned?
The quality of CNMPs varies greatly across the country. Some were becoming so large that landowners were having difficulty finding the activities that needed to be completed. The revised CNMP format and process following the NRCS Conservation Planning approach should improve both the quality and usability of the plans developed. Due to statutes in the Farm Bill, all conservation practices recorded in the record of decision of the CNMP, whether receiving financial assistance or not, must be implemented by the end of the established contract period between the landowner and NRCS. Therefore it is important to only include the practices that are going to be implemented. CNMPs should be periodically updated to account for operational changes such as animal numbers, cropping systems, or land application methods.
Future Plans
The CNMP planning process will be evaluated to determine whether landowner objectives are being met and resource concerns properly addressed. Additional evaluations will look at the consistency of the plans generated across the country and the usability by landowners.
Corresponding author, title, and affiliation
Jeffrey P. Porter, P.E.; National Animal Manure and Nutrient Management Team Leader, USDA-Natural Resources Conservation Service
Corresponding author email
Additional information
References
USDA-NRCS General Manual – Title 190, Part 405 – Comprehensive Nutrient Management Plans
USDA-NRCS Handbooks – Title 180, Part 600 – National Planning Procedures Handbook
Code of Federal Register (CFR) Title 7, Part 1466 – Environmental Quality Incentives Program (1466.7 EQIP Plan of Operations and 1466.21 Contract Requirements)
Webinar
Comprehensive Nutrient Management Plans and the Planning Process – http://www.conservationwebinars.net/webinars/comprehensive-nutrient-management-plans-and-the-planning-process/?searchterm=cnmp
The authors are solely responsible for the content of these proceedings. The technical information does not necessarily reflect the official position of the sponsoring agencies or institutions represented by planning committee members, and inclusion and distribution herein does not constitute an endorsement of views expressed by the same. Printed materials included herein are not refereed publications. Citations should appear as follows. EXAMPLE: Authors. 2017. Title of presentation. Waste to Worth: Spreading Science and Solutions. Cary, NC. April 18-21, 2017. URL of this page. Accessed on: today’s date.
Environmental Management on Equine Farms or the Good, the Bad, and the Ugly
Why Look at Environmental Practices of Horse Farms?
Equine farms are often small acreages that may not have ready access to technologies and information appropriate to their farms. Westendorf et al. (2010a) found that many equine farmers use extension services less than other sources of information, but they may use feed stores or neighbors for information (Table 1); Marriott et al. (2012) also found a limited understanding of available conservation resources among equine farmers. Best Management Practice (BMP) adoption on equine farms is the focus of this paper.
Related: Managing Manure on Horse Farms
|
Table 1. Manure management information sources on equine farms (Total Respondents – 442) |
||||||
|---|---|---|---|---|---|---|
| Another Horse Farmer | Trade Magazines | Cooperative Extension | Other | Feed Dealer | Internet | Other Retailer |
| 221 | 183 | 229 | 116 | 97 | 89 | 26 |
|
Westendorf et al. (2010a,b) |
||||||
What did we do?
Equine farms generally dry stack their waste; in a NJ survey (Westendorf, et al. 2010b) over 70% of farms indicate storing manure on farm, many of these sites may lack BMP’s appropriate for a storage (Table 2, 3). Eighty-three percent in this survey had manure storages located greater than 61m from water or wetlands, and 86% had storages located greater than 61m from neighbors; this might indicate their storage does not pose a significant water quality or nuisance risk. Fiorellino et al. (2010) found that even with low levels of BMP adoption, most equine farms had a reduced water quality risk. Over 50% of NJ farmers indicate that they compost manure, but it is my observation that few actually do; the definition of compost may vary from mature compost to rotting decomposition. Seventy-five percent of farms bed with wood shavings, 25% with straw and the remainder with a combination of wood chips, wood pellets, and paper.
Table 2. Percentage of New Jersey equine survey farms implementing various management practices (%) |
||||||||||||
|---|---|---|---|---|---|---|---|---|---|---|---|---|
Spread manure on farm |
Manure storage area |
Compost horse manure |
Off-farm manure disposal |
Maintain and use dry lot areas |
Credit manure as a fertilizer |
Regular soil tests |
Drag pastures regularly |
Clean stalls daily |
Manure storage <50 ft. from water |
Manure storage >200 ft. from water |
Manure storage <50gt. from neighbor |
Manure storage >200 ft. from neighbor |
54 |
74 |
47 |
58 |
47 |
39 |
32 |
75 |
70 |
1.1 |
83.2 |
1.1 |
86.4 |
|
Westendorf, et al. (2010b) |
||||||||||||
|
Table 3. Percentage of equine survey farms spreading or storing manure (%) |
||
|---|---|---|
| No. of horses | Spread Manure (n = 442) | Manure Storage (n = 434) |
| 1 to 2 | 55.2 | 65.3 |
| 3 to 5 | 59.2 | 62.9 |
| 6 to 10 | 55.3 | 80.7 |
| 11 to 20 | 50.0 | 87.9 |
| 21 to 40 | 37.8 | 94.4 |
| > 40 | 37.5 | 93.3 |
|
Westendorf, et al. (2010b) |
||
Nearly 60% of horse farms dispose of some manure off the farm; for use as fertilizer, to a centralized composter, on-farm compost for sale, or to be given away are the prime means of disposal; unfortunately some is removed by dumpster. Fifty-four percent spread some manure on-farm, of these only 39% account for any fertilizer value. If we trust the survey, then probably only 20-25% of the farms have an understanding of the fertilizer value of manure; this survey did find a positive correlation between manure spreading and soil testing (P<.05), suggesting some understanding of soil fertility basics.
Fifty-three percent of farms had a sacrifice or exercise lot that provides horses an area for eating, drinking, shelter, and relaxing if needed. A sacrifice area can help to protect pasture and grazing areas. Many farms only have a turnout lot for both exercise and grazing; this can result in greater mud accumulation and other possible water quality concerns.
A feed management survey (Westendorf, et al. 2013) was sent to 500 NJ equine farmers (see Table 4). Forty-five percent received feeding and nutrition information from a feed store, 20% from a veterinarian, only 3% from a professional consultant and 2% from extension. Most farmers had no concept of feeding to reduce excretion of nutrients such as phosphorus. Monitoring intake, cleaning feed bunks and contaminated lots regularly, and disposing all waste feed in the manure storage are good recommendations for all producers. Please see the Williams et al. (2015) abstract in the poster session for more information about an on-farm feeding project.
|
Table 4. Description of how feeding decisions are made (%) |
|||||
|---|---|---|---|---|---|
| Balance diets on your own | Veterinarian advice | No plan at all | Feed store advice | Consulting nutritionist | Extension advice |
| 45 | 20.5 | 15 | 14.5 | 3 | 2 |
|
Westendorf, et al. 2013 |
|||||
What have we learned?
In summary: 1. Many horse farms dispose some or all manure off-site; 2. Between 50 and 75% spread manure on crop or grazing land; 3. Most have at least a designated location for manure storage; 4. Larger farms are more likely to store manure. 5. Many farms have a low non-point source (NPS) pollution risk, but little understanding of BMP’s; and 6. Pasture management BMP’s are seldom applied.
Future Plans
Outreach should focus on the implementation of low-cost management practices that equine farmers are likely to adopt.
Author
Michael L. Westendorf, Extension Specialist in Animal Science, Rutgers, the State University of New Jersey westendorf@aesop.rutgers.edu
Reference
Fiorellino, N. M., J. M. McGrath, B. Momen, S. K. Kariuki, M. J. Calkins and A. O. Burk. 2014. Use of Best Management Practices and Pasture and Soil Quality on Maryland Horse Farms. J. Equine Vet. Sci. 34:257-264.
Marriot, J. M., A. Shober, P. Monaghan and C. Wiese. 2012. Equine Owner Knowledge and Implementations of Conservation Practices. J. of Extension. 50: Issue 5. https://archives.joe.org/joe/2012october/pdf/JOE_v50_5rb4.pdf
Westendorf, M. L., T. Joshua, S. J. Komar, C. Williams, and R. Govindasamy. 2010a. Effectiveness of Cooperative Extension Manure Management Programs. J. Equine Vet. Sci. 30:322-325.
Westendorf, M. L., T. Joshua, S. J. Komar, C. Williams, and R. Govindasamy. 2010b. Manure Management Practices on New Jersey Equine Farms. Prof. Anim. Sci. 26:123-129.
Westendorf, M. L., V. Puduri, C. Williams, T. Joshua, and R. Govindasamy. 2013. Dietary and Manure Management Practices on Equine Farms in Two New Jersey Watersheds. J. Equine Vet. Sci. 33:601-606.b
Acknowledgements
This work supported by the New Jersey State Equine Initiative, the Rutgers Equine Science Center, and the New Jersey State Department of Agriculture.
Special thanks to Troy Joshua, USDA-NASS, New Jersey for help in setting up some of the surveys.
The authors are solely responsible for the content of these proceedings. The technical information does not necessarily reflect the official position of the sponsoring agencies or institutions represented by planning committee members, and inclusion and distribution herein does not constitute an endorsement of views expressed by the same. Printed materials included herein are not refereed publications. Citations should appear as follows. EXAMPLE: Authors. 2015. Title of presentation. Waste to Worth: Spreading Science and Solutions. Seattle, WA. March 31-April 3, 2015. URL of this page. Accessed on: today’s date.
Validation of Near-Infrared Reflectance Spectral Data for Analyzing Horse Manure
Can Near-Infrared Reflectance Spectroscopy (NIRS) Be Used For Analyzing Horse Manure?
Increased horse numbers and insufficient acreage limit the ability for on-farm use of horse manure. Nearly 58% of surveyed farmers in NJ indicate that some manure was disposed off-farm while only 54% spread any manure on the farm (Westendorf et al., 2010). Analysis of manure by Near-Infrared Reflectance Spectroscopy (NIRS) could be a useful means of determining nutrient and energy content without time consuming efforts of wet chemistry and other laboratory analyses if horse manure is used as a fertilizer or energy source. The NIRS analysis works by subjecting samples to a concentrated light of a known spectrum and measuring the absorbance of the reflected beam (Dyer and Feng, 1997). Covalent chemical bonds of the common organic elements (Carbon, Nitrogen, Oxygen and Hydrogen) have strong absorbance in the NIRS region, useful because there is a correlation between absorbance and concentration (Malley et al., 2002). By comparing data between samples generated by NIRS to laboratory analysis of the same samples, NIRS equipment can be calibrated for practical use. The objectives of this project were: 1) determine the nutrient content and value of horse manure, and make NIRS calibrations based on previously determined wet chemistry values, and 2) determine if ash or Neutral Detergent Fiber (NDF) content can be used to predict Gross Energy (GE) levels.
What did we do?
Horse manure consisting of 123 solid dry stack manure samples, were collected from 30 NJ farms over four seasons during a 12-month period in 2008-2009. Samples were collected from various random locations in a manure pile in ~ 4 l sealable plastic bags, frozen, and stored until analysis. All samples were dried at 55o C to a constant weight in a Thermocore® oven. Following drying, all samples were ground to a particle size of 5-10 mm in a Waring® industrial blender, referred to as Coarse ground samples. Samples were sent to DairyOne Laboratories in Ithaca, NY and analyzed for manure components (Total-N, P2O5, K2O, NDF, and GE); samples were analyzed for Ash by the Rutgers University Soil Testing Laboratory. Coarse ground samples were further ground in a coffee grinder to a particle size between 2-3 mm (these samples are referred to as Fine ground samples). All NIRS analysis of Coarse and Fine ground samples were made with a Unit y Scientific Spectrastar ™ 2400 Drawer model (Brookfield, CT). Samples were scanned at 1nm intervals over the wavelength range of 1250-2350 nm, as prescribed by Unity Scientific. Data from the DairyOne Laboratory results were used as reference values to develop calibrations using the Ucal™ software package (Unity Scientific, Brookfield, CT) set at default values using a partial linear squares statistical model.
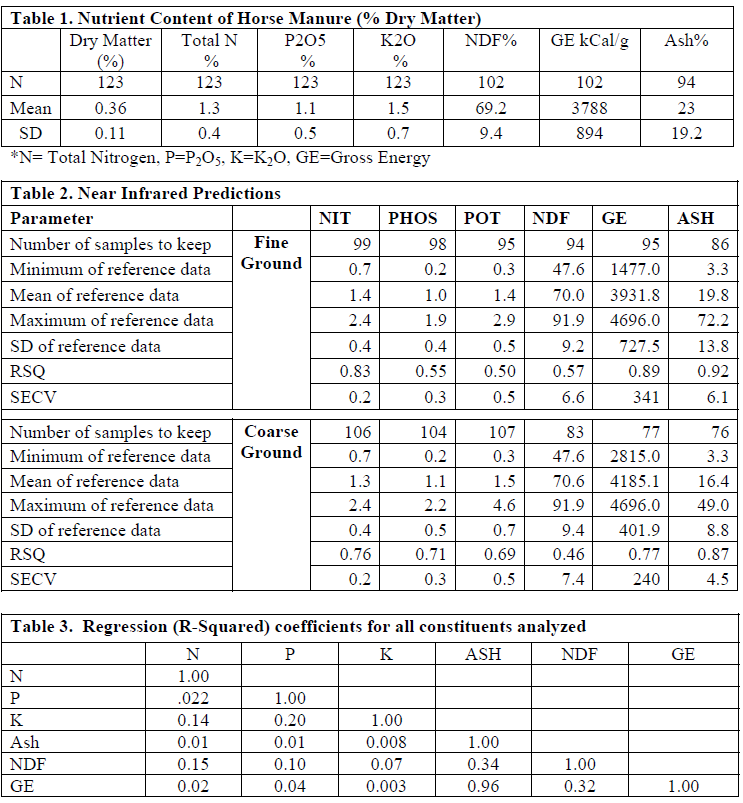
What have we learned?
On a dry matter basis (Table 1) samples averaged 1.3% N, 1.1% P2O5, 1.5% K2O, 69.2% NDF, 3800 kCal/g GE, and 24% Ash. The NIRS equations (Table 2) for Coarse (5-10 mm) ground horse manure predicted nutrient content, R-squared values of 0.76, 0.71, 0.69, 0.46, 0.77, and 0.87 for N, P2O5, K2O, NDF, GE, and Ash, respectively. The NIRS also predicted Fine (2-4 mm) ground horse manure R-squared values of 0.83, 0.55, 0.50, 0.57, 0.89, and 0.92 for N, P2O5, K2O, NDF, GE, and Ash, respectively. Ash, GE and NDF were regressed to determine how effectively Ash and NDF would predict GE (Table 3); NDF was a poor predictor of GE content (R-squared of 0.32), while Ash was a good predictor (R-squared of 0.96).
Future Plans
This research suggests that NIRS can be useful for predicting nutrient content of horse manure and that Ash is a good predictor of energy content. A comparative field trial on horse farms is planned for follow-up.
Authors
Michael L. Westendorf. Extension Specialist in Animal Science. Rutgers, the State University of New Jersey westendorf@aesop.rutgers.edu
Zane R. Helsel. Extension Specialist in Plant Biology and Pathology. Rutgers, the State University of New Jersey.
Additional information
Author Contact Information:
Michael Westendorf
Rutgers, The State University of New Jersey
84 Lipman Drive
New Brunswick, NJ 08901
Phone: 848-932-9408
e-mail: westendorf@aesop.rutgers.edu
Reference:
Dyer, D. J. and P. Feng. 1997. NIR Destined to be Major Analytical Influence. Feedstuffs Magazine. November 10, 1997.
Malley, D.F., Yesmin, L., and Eilers, R. G. 2002. Rapid Analysis of Hog Manure and Manure- amended Soils Using Near-infrared Spectroscopy. Soil Science Society of America Journal. 2002. 1677-1686.
Westendorf, M. L., T. Joshua, S. J. Komar, C. Williams, and R. Govindasamy. 2010. Manure Management Practices on New Jersey Equine Farms. Prof. Anim. Sci. 26:123-129.
Acknowledgements
Supported in part by the State Equine Initiative. Rutgers Equine Science Center. New Jersey Agricultural Experiment Station.
The authors are solely responsible for the content of these proceedings. The technical information does not necessarily reflect the official position of the sponsoring agencies or institutions represented by planning committee members, and inclusion and distribution herein does not constitute an endorsement of views expressed by the same. Printed materials included herein are not refereed publications. Citations should appear as follows. EXAMPLE: Authors. 2015. Title of presentation. Waste to Worth: Spreading Science and Solutions. Seattle, WA. March 31-April 3, 2015. URL of this page. Accessed on: today’s date.
Rotational Grazing Effects on Pasture Nutrient Content
Why Look at Rotations Grazing in Horse Pastures?
Rotational grazing is a recommended strategy to improve pasture health and animal performance. Previous studies have reported improved forage quality in rotationally grazed pastures compared to those continuously grazed by cattle, but data are limited for horse pastures.
What did we do?
A study at the University of Tennessee was conducted to evaluate the effects of rotational grazing on the nutrient content of horse pastures. A 2.02 ha rotational grazing pasture (RG) and a 2.02 ha continuous grazing pasture (CG) were each grazed by three adult horses at a stocking rate of 0.6 ha/horse over a two year period. The RG system was divided into four 0.40 ha paddocks and a heavy use area. Pastures were maintained at uniform maximum height of 15 to 20 cm by mowing. Horses were rotated between the RG paddocks every 10 to 14 d, or when forage was grazed to a height of approximately 8 cm. Pasture forage samples (n = 520) were collected and composited monthly (n = 14) during the growing season (April to November) by clipping forage from randomly placed 0.25 m2 quadrates from RG and CG, as well as before and after grazing each RG paddock. Botanical composition and percent ground cover were visually assessed. Forage samples were oven dried at 60°C in a forced air oven for 72 h to determine DM. Forage biomass yield (kg/ha), digestible energy (DE, Mcal/kg), crude protein (CP), acid detergent fiber (ADF), neutral detergent fiber (NDF), lignin, calcium (Ca), phosphorous (P), potassium (K), magnesium (Mg), ash, fat, water soluble carbohydrates (WSC), sugar and fructan were measured using a FOSS 6500 near-infrared spectrometer. Data were analyzed using paired T-tests and differences were determined to be significant at P < 0.05. Data are reported as means ± SEM as a percent of DM.
What have we learned?
| Table 1. Nutrient content of continuously grazed (CG) pasture and rotationally grazed (RG) pasture. Data are summarized as means ± SE. | ||
|---|---|---|
| Nutrient | Continuous | Rotational |
| DM, % | 91.72 ± 0.36 | 91.89 ± 0.34 |
| DE, Mcal/kg | 2.31 ± 0.064 | 2.42± 0.039* |
| CP, % | 14.92 ± 0.77 | 15.79 ± 0.64 |
| ADF, % | 33.16 ± 1.21 | 30.81 ± 0.82* |
| NDF, % | 56.80 ± 1.75 | 53.53 ± 1.65* |
| Lignin, % | 3.47 ± 0.38 | 2.88 ± 0.32* |
| Ca, % | 0.69 ± 0.11 | 0.68 ± 0.11 |
| P, % | 0.25 ± 0.009 | 0.27 ± 0.008* |
| K, % | 1.92 ± 0.10 | 2.11 ± 0.087* |
| Mg, % | 0.25 ± 0.009 | 0.26 ± 0.007 |
| Ash, % | 9.35 ± 0.83 | 9.39 ± 0.66 |
| Fat, % | 2.65 ± 0.12 | 2.83 ± 0.08 |
| WSC, % | 4.95 ± 0.60 | 6.72 ± 0.71* |
| Sugar, % | 3.33 ± 0.50 | 4.86 ± 0.55* |
| Fructan, % | 1.61 ± 0.15 | 1.59 ± 0.16 |
| *means within rows differ; P < 0.05 | ||
Forage biomass yield did not differ between RG and CG (2,125 ± 52.2; 2,267 ± 72.4 kg/ha, respectively). The percentage of grass species was greater in RG compared to CG (81.7 ± 3.9; 73.9 ± 4.5, respectively) and the percentage of weed species was lower in RG compared to CG (3.4 ± 0.8; 12.0 ± 1.5, respectively). Tall fescue, kentucky bluegrass, bermudagrass and white clover were the dominant forage species. Rotational grazing increased forage quality compared to continuous grazing. The RG system was higher in DE (Mcal/kg), phosphorous (P), potassium (K), water soluble carbohydrates (WSC), and sugar compared to the CG system (Table 1). While there wasn’t a significant difference in crude protein (CP) content between RG and CG, the numerical difference could potentially affect animal performance. The RG pasture was lower in acid detergent fiber (ADF), neutral detergent fiber (NDF) and lignin compared to the CG pasture. Within the RG pasture, forage nutrient content declined following a grazing period, but recovered with rest. Paddocks were lower in DE, CP, P, K, Fat, WSC and sugar while they were higher in ADF and NDF after grazing compared to before grazing (Table 2).
| Table 2. Nutrient content of rotational grazing (RG) paddocks before and after grazing. Data are summarized as means ± SE. | ||
|---|---|---|
| Nutrient | Before | After |
| DM, % | 91.84 ± 0.27 | 91.84 ± 0.39 |
| DE, Mcal/kg | 2.34 ± 0.03 | 2.21 ± 0.02* |
| CP, % | 14.98 ± 0.39 | 13.71 ± 0.43* |
| ADF, % | 32.24 ± 0.54 | 34.33 ± 0.48* |
| NDF, % | 55.97 ± 0.88 | 59.24 ± 0.89* |
| Lignin, % | 2.79 ± 0.20 | 3.41 ± 0.25* |
| Ca, % | 0.58 ± 0.05 | 0.59 ± 0.05 |
| P, % | 0.28 ± 0.004 | 0.25 ± 0.006* |
| K, % | 2.11 ± 0.08 | 1.72 ± 0.07* |
| Mg, % | 0.26 ± 0.007 | 0.26 ± 0.009 |
| Ash, % | 8.76 ± 0.19 | 8.79 ± 0.21 |
| Fat, % | 2.64 ± 0.05 | 2.45 ± 0.06* |
| WSC, % | 6.05 ± 0.47 | 4.85 ± 0.39* |
| Sugar, % | 4.40 ± 0.38 | 3.22 ± 0.30* |
| Fructan, % | 1.67 ± 0.15 | 1.69 ± 0.16 |
| *means within rows differ; P < 0.05 | ||
Future Plans
Rotational grazing may be a preferred alternative to continuous grazing as it favors grass production, suppresses weeds and increases energy and nutrient content of pastures. While rotational grazing may be beneficial from an environmental and animal production standpoint, an increase in DE and WSC may pose a risk for horses prone to obesity and metabolic dysfunction. Appropriate precautions should be taken in managing at risk horses under rotational grazing systems. This work is being continued at Virginia Tech and other universities to further understand the use of rotational grazing systems for horses.
Authors
Bridgett McIntosh, Equine Extension Specialist, Virginia Tech bmcintosh@vt.edu
Matt Webb, Ashton Daniel, David McIntosh and Joe David Plunk, University of Tennessee
Additional information
http://www.arec.vaes.vt.edu/middleburg/
Acknowledgements
The authors thank the University of Tennessee Middle Tennessee Research and Education Center and the Tennessee Department of Agriculture’s Nonpoint Source Pollution 319 Water Quality Grant for their support of this project.
The authors are solely responsible for the content of these proceedings. The technical information does not necessarily reflect the official position of the sponsoring agencies or institutions represented by planning committee members, and inclusion and distribution herein does not constitute an endorsement of views expressed by the same. Printed materials included herein are not refereed publications. Citations should appear as follows. EXAMPLE: Authors. 2015. Title of presentation. Waste to Worth: Spreading Science and Solutions. Seattle, WA. March 31-April 3, 2015. URL of this page. Accessed on: today’s date.
Ethnobotanical Control of Odor in Urban Poultry Production: A Review
Purpose
Urban agriculture has been growing as the movement of population to the urban centers is increasing. According to FAO (2008), by 2030 majority of the population in sub sahara Africa (SSA) would be living in the urban area. Pollution from animal manure is a global concern and is much more acute and serious in countries with high concentrations of animals on a limited land base for manure disposal (Roderick, Stroot and Varel, 1998), this is the case with urban livestock production. Environmental pollution and odor complaints related to animal production have increased dramatically during the past decade (Ernest and Ronald, 2004). These odors potentially interfere with quality and enjoyment of life (Mauderly, 2002 and Albert, 2002). According to Pfost, Fulhage and Hoehne, 1999, odor complaints are more common when the humidity is high and the air is still or when the prevailing breezes carry odors toward populated areas. Inspite of the role that urban agriculture can play in pursuing the Millennium Development Goals, more specifically those, related to poverty reduction, food security, and environmental sustainability, odor from livestock still remains a major obstacle to future development. According to Obayelu 2010 there has been public’s increasing intolerance of livestock odors, hence the need to find solutions which will be ecosystem friendly. This paper will review some methods of odor control focusing on natural solutions to this problem.
What did we do?
For an odor to be detected downwind, odorous compounds must be: (a) formed, (b) released to the atmosphere, and (c) transported to the receptor site. These three steps provide the basis for most odor control. If any one of the steps is inhibited, the odor will diminish. (Chastain, 2000)
There are four general types of compounds for odor control: (1) masking agents that override the offensive odors, (2) counteractants that are chemically designed to block the sensing of odors, (3) odor absorption chemicals that react with compounds in manure to reduce odor emission, and (4) biological compounds such as enzymatic or bacterial products that alter the decomposition so that odorous compounds are not generated (Chastain, 2000). Some of these compounds are added directly to the manure while others are added to the feed. Yucca schidigera is a natural feed additive for livestock and poultry used to control odors, ammonia and other gas emissions, which can be detrimental to livestock performance. Essential oils are being promoted as effective and safe antimicrobial or antiviral (disinfectant) agents that also act as masking agents in the control of odor examples are thymol and carvacrol. Natural zeolite, clinoptilolite (an ammonium-selective zeolite), has been shown t o enhance adsorption of volatile organic compounds and odor emitted from animal manure due to its high surface area. Cai et al. (2007) reported reduction >51% for selected offensive odorants (i.e. acetic acid, butanoic acid, iso-valeric acid, dimethyl trisulfide, dimethyl sulfone, phenol, indole and skatole) in poultry manure with a 10% zeolite topical application. Treatment of broiler litter with alum was originally developed to reduce the amount of soluble phosphorous in poultry litter. However, it was also observed that using alum reduced the pH of the litter to below 6.5, and as a result, reductions in ammonia emissions from the litter have been observed.
Amendment of manure with alkaline materials such as cement kiln dust, lime, or other alkaline by-products can increase the pH to above 12.0, which limits the vast majority of microbialactivity, including odor producing microorganisms (Veenhuizen and Qi, 1993, Li et al., 1998). The effect of the addition of lime and other ONAs that alter the pH and moisture content of the waste and bedding requires further scientific research (McGahan, et al., 2002).
Dust particles can carry gases and odors. Therefore, dust control in the buildings can reduce the amount of odor carried outside. Management practices that can greatly reduce the amount of dust in poultry buildings are Clean interior building surfaces regularly, Reduce dust from feed, this can be by addition of oil to dry rations, proper and timely maintenance of feeders, augers, and other feed handling equipment. Also managing the relative humidity (RH) in poultry houses. Planting just three rows of trees around animal farms has also been proven to cut nuisance emissions of dust, ammonia, and odors from poultry houses. The use of tress around livestock facilities to mitigate odour and improve air quality has been recently reviewed by Tyndall and Colletti (2000). They concluded that trees have the potential to be an effective and inexpensive odor control technology particularly when used in combination with other odour control methods. Trees ameliorate odours by dilutio n of odour, encourage dust and aerosol deposition by reducing wind speeds, physical interception of dust and aerosols, and acting as a sink for chemical constituents of odour.
What have we learned?
The use of indigenous microorganisms for odor reduction related to livestock is being promoted under Natural farming, in this instance cultured mixtures of microorganisms consisting mainly of lactic acid bacteria, purple bacteria and yeast are used. This is already made into commercial product and marketed as effective microorganism activated solution (EMAS).
Interestingly, there is paucity of information on ethnobotanicals that are useful for odour control. Most literatures on ethnobotany focused of treatment and control of animal diseases but not on traditional control of the environment of livestock. As scientists are still working hard to develop chemical or biological additives which will eliminate or reduce odors associated with poultry wastes there is the need to survey traditional livestock owners for information that can serve for development of effective,inexpensive, efficient and suitable agent for odor control in poultry management.
Corresponding author, title, and affiliation
Oyebanji Bukola, Department of Animal Sciences, Obafemi Awolowo University, Ile-Ife, Nigeria
Corresponding author email
References
Albert, H. (2002) Outdoor Air Quality. Livestock Waste Facilities Handbook, Midwest Plan Service (MWPS),
Iowa State University in Ames, Iowa. Volume 18, section 3 Page 96.
Cai, L., Koziel, J.A., Liang, Y., Nguyen, A.T., and H. Xin. 2007. Evaluation of zeolite for
control of odorants emissions from simulated poultry manure storage. J. Environ. Qual.
36:184-193.
Chastain, J.P., and F.J. Wolak. 2000. Application of a Gaussian Plume Model of Odor
Dispersion to Select a Site for Livestock Facilities. Proceedings of the Odors and VOC
Emissions 2000 Conference, sponsored by the Water Environment Federation, April 16-19,
Cincinnati, OH., 14 pages, published on CD-ROM.
Ernest, F.B and Ronald, A.F.(2004) An Economic Evaluation of Livestock Odor Regulation Distances.
Journal of Environmental Quality, Volume 33, November–December 2004
FAO 2008. Urban agriculture for sustainable poverty alleviation and food security. FAO Rome
Mauderly, J.L. (2002) Health Effects of Mixtures of Air Pollutants. Air Quality and Health: State of the Science, Proceedings of the Clean Air Strategic Alliance Symposium, Red Deer, Alberta, Canada, June 3-4, 2002.
McGahan. E, Kolominska, C Bawden, K. and Ormerod. R (2002). Strategies to reduce odour emissions from Meat chicken farms Proceedings 2002 Poultry Information Exchange
Pfost, D. L., C. D. Fulhage, and J. A. Hoehne (1999) Odors from livestock operations: Causes and possible cures. Outreach and Extension Pub. # G 1884. University of MissouriColumbia.
Obayelu, A. E 2010. Assessment Of The Economic And Environmental Effects Of Odor Emission From Mechanically Ventilated Livestock Building In Ibadan Oyo State Nigeria. International Journal of science and nature VOL. 1(2) 113-119
Tyndall, J. and J. Colletti. 2000. Air quality and shelterbelts: Odor mitigation and livestock production a literature review. Technical report no. 4124-4521-48-3209 submitted to USDA, National Agroforestry Center, Lincoln, NE.
The authors are solely responsible for the content of these proceedings. The technical information does not necessarily reflect the official position of the sponsoring agencies or institutions represented by planning committee members, and inclusion and distribution herein does not constitute an endorsement of views expressed by the same. Printed materials included herein are not refereed publications. Citations should appear as follows. EXAMPLE: Authors. 2015. Title of presentation. Waste to Worth: Spreading Science and Solutions. Seattle, WA. March 31-April 3, 2015. URL of this page. Accessed on: today’s date.
The North American Partnership for Phosphorus Sustainability: Creating a Circular P Economy as Part of a Sustainable Food System
Purpose
To promote and foster the implementation of sustainable P solutions in both the private and public sectors
 What did we do?
Recently, a team of Phosphorus researchers initiated the North American Partnership for Phosphorus Sustainability (NAPPS) with seed funding from Arizona State University. The goal of North American Partnership for Phosphorus Sustainability (NAPPS) is to actively engage stakeholders (e.g. corporations, national and local policy makers, planners and officials, representatives of agriculture, industry) to promote and foster the implementation of sustainable P solutions in both the private and public sectors. NAPPS seeks to engage partners in identifying key bottlenecks and strategies for decision-making, policy, and implementation of P efficiency and recycling technologies.
What have we learned?
Phosphorus is necessary for life, and is essential for agricultural production, and so for food security. The growing world population, changing diets of humans to more meat and dairy and growing use of phosphate additives, and biomass production for energy or industrial uses result in an increasing need for phosphorus input, and the world is today heavily dependent on non-renewable, finite phosphate rock reserves that which are concentrated in a small number of countries, posing geopolitical vulnerability. These trends lead to the depletion of phosphate rock resources, pressure on and instability in phosphate prices, decreasing quality and increasing contaminant loads of remaining reserves, and unstable, insecure P supply for regions without local rock resources, especially in the developing world. At the same time, excess P is lost from the food system at multiple points. The result is eutrophication of freshwater and coastal ecosystems – lo ss of the amenity value of lakes and rivers as well as toxic algal blooms and impacts on fisheries.
Phosphorus stewardship is therefore essential, and we must use P more efficiently in the agri-food system, and actively develop phosphorus reuse and recycling technologies and practices. At the same time, the issue of contaminants, both in phosphate rock and in recycled phosphates must be addressed, as well as the need to reduce phosphate inputs to surface waters where these are problematic. We can reduce the use of mined P by producing and applying fertilizer from recycled sources. By using improved practices and smarter crops, we can reduce the demand for P fertilizer and reduce the runoff to surface water bodies. By reducing and re-using food waste and eating food with lower P footprints we can lower our phosphorus consumption and demand. Collectively, these will also lessen the impacts of P runoff on precious water resources.
Future Plans
NAPPS activities and stakeholder recruitment will be organized around four main sectors: P Recycling; P Efficiency in Food Production; BioEnergy and Food Choice; and Water Quality. Projects and activities will be decided by the Board of Directors, but may include:
1. Develop a common vision for creating a sustainable P cycle in North America
2. Identifying and helping businesses and other organizations respond to opportunities offered by challenges in P management and emerging research in P sustainability
3. Building networks between different interest groups and sectors related to phosphorus management and recycling
4. Evaluating new P efficiency and recycling technologies, including feasibility, availability of suppliers, inventory of existing technologies and companies, cost/benefit analysis, and life cycle analyses
5. Fostering implementation of new technologies by improving the efficiency of business value chains
6. Assessing and facilitating regulatory development pertaining to phosphorus management, including waste, environmental, discharge, and agriculture to improve P sustainability
7. Representing North American phosphorus managers and innovators in international meetings and initiatives
8. Preparing funding RFPs for demonstration projects and integration and dissemination of new technologies and concepts
Authors
Helen Ivy Rowe, Assistant Research Professor, School of LIfe Sciences, Arizona State University hirowe@asu.edu
James J. Elser, Regents Professor, School of LIfe Sciences, Arizona State University
Additional information
Acknowledgements
We thank Arizona State University for providing funds to launch this initiative.


The authors are solely responsible for the content of these proceedings. The technical information does not necessarily reflect the official position of the sponsoring agencies or institutions represented by planning committee members, and inclusion and distribution herein does not constitute an endorsement of views expressed by the same. Printed materials included herein are not refereed publications. Citations should appear as follows. EXAMPLE: Authors. 2015. Title of presentation. Waste to Worth: Spreading Science and Solutions. Seattle, WA. March 31-April 3, 2015. URL of this page. Accessed on: today’s date.
An NE-1441 Project: Proposed Methodologies for Administering a Multi-State Environmental Best Management Practices Survey of Equine Properties
*Purpose
Several states have reported that equine are the fastest growing segment of the livestock industry. Nationwide, equine has increased by 77% since 1997; and it is reported there are approximately 9.5 million horses in the United States (AHC, 2005). Proper management of equine operations requires the adoption of Best Management Practices (BMPs) to balance nutrient production and prevent erosion. Government agencies are concerned about non-point sources of water pollution and have focused on agriculture, including equine operations, as a major contributor to water quality issues. Many states’ laws have regulated equine farms, requiring farm managers to incorporate BMPs. The objectives of this proposed national (multi-state) survey are to quantify and assess the use of the equine industry’s BMPs in pasture management, erosion control and to examine potential environmental impacts. Few state studies have investigated horse BMPs in the U.S, and more research is needed to assess the effect of horse farm management on U.S. water quality. Knowledge of the current scope and nature of equine industry management practices are important when developing regulations, laws, and educational programs to enhance the stewardship and govern land management on equine operations.
What did we do?
The methodology to assess horse property manager/owner practices consists of gathering a minimum of 150-2,000 names and email addresses of horse owners/farm managers from the 15 states involved in the NE-1441 project. Some of the N. E. states have fewer equine operations. An email containing survey information and a link to the 40 question online survey will be sent to horse farm managers in 2016. Three follow-up reminders will be sent to non-responding addresses. It is hoped to have a 40% response rate. Data will analyzed using SPSS 16.0 (SPSS Inc., Chicago, IL) for descriptive statistics, determining response frequencies and percentages.
The Questionnaire Instrument will include the following areas:
Part I General: Involved in the horse industry? Are you the owner or manager of a horse operation? If No, then you are finished taking the survey. Business or Hobby?
Part II Demographics: Location, State, County, Survey participants gender, age, Size of farm total acreage, Confinement areas, Pasture areas, primary and 2nd use of operation, Highest average number of horses on property? On average, how many hours per day do your horses spend grazing pastures by seasons?
Part III Horse Pasture Management Rotational Grazing, unlimited access,Pasture Management Plan, Agricultural Erosion and Sedimentation Plan weed control and type, mowing, resting pastures,Sacrifice lots, pasture topography, surface water, Sheds and barns,divert runoff, roof gutters.
Part IV: Horse Pasture Applications and/or Evaluation: Line, Fertilizer, Herbicide use, Seeding practices, Lime, Soil testing.
Part V: Horse Manure Management: Nutrient Management Plan, primary manure management, collection, storage, uses, removal.
Part VI: Conclusion: What are your limitations in altering the management of your horse operation? What information resources do you use for your equine farm operations?
What have we learned?
The questions for an equine related APHIS/USDA animal agriculture survey need to be more specific to the activities and needs of the horse industry. Whereas most animal agriculture operations do not deal directly with the general public as a necessary component of their business plan, the horse industry depends on active and engaged clientele. If we are able to gather national data through a single effort survey, the resulting information could be compared and sorted in a consistent and statistically reliable manner, allowing educational materials and opportunities to be tailored to area or regional needs.
Future Plans
A survey will be conducted by the NE-1441 (a northeast regional Hatch research group focusing on environmental impacts of equine operations) participating states to determine the use of the following best management practices: managed storage area, composted manure storage, stream crossings, buffers and vegetative filter strips, heavy use pads and sacrifice areas, soil testing, and fertility management on fields receiving manure. Develop means of determining the impact of equine outreach programs, more specifically determination of BMP adoption rate.This will allow us to chart progress among producers who use extension services and/or implement BMPs with the assistance of extension or other service providers such as NRCS, state departments of agriculture, and etc. We will work with social scientists to determine adoption rates, what the reasons for resistance to adoption are, and how to develop programs to overcome this resistance.
Corresponding author, title, and affiliation
Betsy Greene, Professor/Equine Extension Specialist, University of Vermont
Corresponding author email
Other authors
Ann Swinker, Extension, Pennsylvania State University Amy Burk, Extension, University of Maryland Rebecca Bott, Extension, South Dakota State University Carey Williams, Extension, Rutgers, State University of New Jersey
Additional information
Westendorf, M. L., T. Joshua, S. J. Komar, C. Williams, and R. Govindasamy. 2010. Manure Management Practices on New Jersey Equine Farms. Prof. Anim. Sci. 26:123-129.
Swinker, A., S. Worobey, H. McKernan, R. Meinen, D. Kniffen, D. Foulk, M. Hall, J. Weld, F. Schneider, A. Burk, M. Brubaker, 2013, Profile of the Equine Industry’s Environmental, Best Management Practices and Variations in Pennsylvania, J. of NACAA. 6:1, 2158-9429.
Fiorellino, N.M., K.M. Wilson, and A.O. Burk. 2013. Characterizing the use of environmentally friendly pasture management practices by horse farm operators in Maryland. J. Soil Water Conserv. 68:34-40.
Acknowledgements
The State University Extension Equine Specialists that make up the NE-1441: Environmental Impacts of Equine Operations, Multi-State Program. USDA.
The authors are solely responsible for the content of these proceedings. The technical information does not necessarily reflect the official position of the sponsoring agencies or institutions represented by planning committee members, and inclusion and distribution herein does not constitute an endorsement of views expressed by the same. Printed materials included herein are not refereed publications. Citations should appear as follows. EXAMPLE: Authors. 2015. Title of presentation. Waste to Worth: Spreading Science and Solutions. Seattle, WA. March 31-April 3, 2015. URL of this page. Accessed on: today’s date.